Market Overview
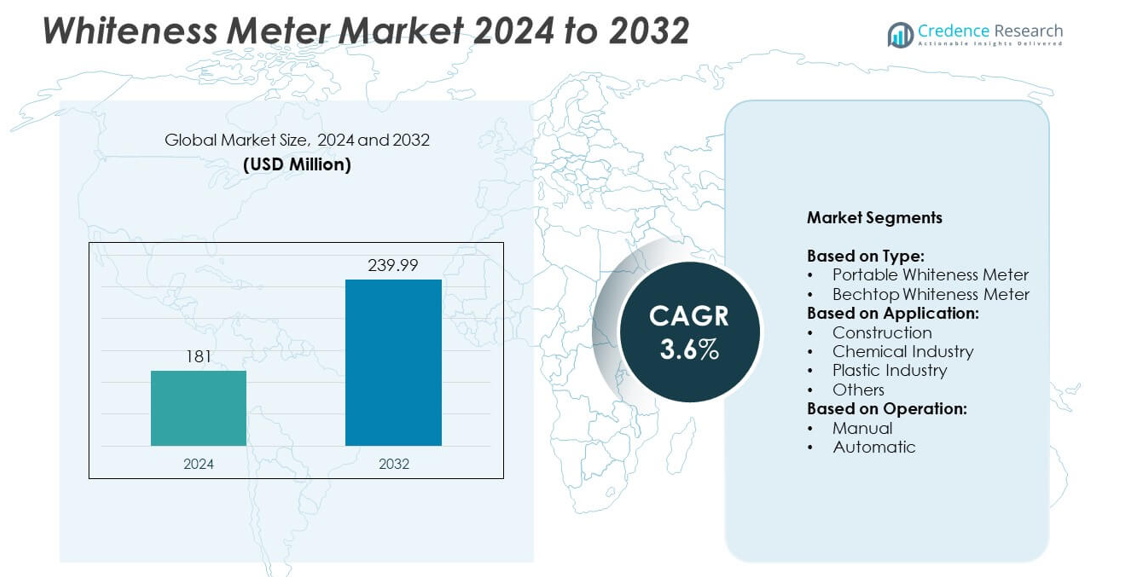
The Whiteness Meter market size was valued at USD 181 million in 2024 and is anticipated to reach USD 239.99 million by 2032, at a CAGR of 3.6% during the forecast period.
| REPORT ATTRIBUTE |
DETAILS |
| Historical Period |
2020-2023 |
| Base Year |
2024 |
| Forecast Period |
2025-2032 |
| Whiteness Meter Market Size 2024 |
USD 181 million |
| Whiteness Meter Market, CAGR |
3.6% |
| Whiteness Meter Market Size 2032 |
USD 239.99 million |
The Whiteness Meter market is driven by prominent players such as PCE Instruments, Caltech Engineering Services, Mesu Lab Instruments (Guangzhou) Co. Ltd, Arotek Scientific Instruments Private Limited, Labtron Equipment Ltd, Optics Technology, Kett US, EIE Instruments, Mxrady Lab Solutions Private Limited, and AELAB Group. These companies focus on developing precise, automated, and portable solutions to meet the growing demand for quality control in plastics, construction, and chemical industries. Asia-Pacific led the global market with approximately 34% share in 2024, driven by rapid industrialization and expanding manufacturing capacity, followed by North America with around 32% share.
Market Insights
- The Whiteness Meter market was valued at USD 181 million in 2024 and is projected to reach USD 239.99 million by 2032, growing at a CAGR of 3.6%.
- Rising demand for quality control in plastics, construction, and chemical industries is driving market growth, with portable whiteness meters holding over 55% share in 2024.
- Key trends include increasing adoption of automatic whiteness meters, integration with IoT-enabled quality systems, and development of portable, smart devices for field testing.
- The market is moderately competitive, with players focusing on innovation, automation, and global distribution partnerships to strengthen their position and expand presence in emerging markets.
- Asia-Pacific led the market with 34% share in 2024, followed by North America with 32% and Europe with 28%, while Latin America and Middle East & Africa together contributed around 6%, reflecting rising adoption in developing economies.
Access crucial information at unmatched prices!
Request your sample report today & start making informed decisions powered by Credence Research Inc.!
Download Sample
Market Segmentation Analysis:
By Type
Portable whiteness meters dominated the market with over 55% share in 2024, driven by their mobility and ease of use across construction sites and production floors. These devices enable quick on-site measurement of material brightness, reducing delays in quality control processes. The rising demand for cost-effective, lightweight, and battery-operated devices in small-scale manufacturing facilities is boosting adoption. Bench-top whiteness meters continue to hold steady demand in research labs and large-scale industrial settings, where higher precision and repeatability are required for batch testing and regulatory compliance.
- For instance, Hinotek’s WSB-V intelligent whiteness meter features a light source life of 100,000 hours, repeatability ≤ 0.1, and zero drift ≤ 0.1 when measuring blue-light whiteness.
By Application
The plastic industry led the market with nearly 40% share in 2024, supported by strict quality standards for brightness and color consistency in polymer products. Plastic manufacturers increasingly use whiteness meters to ensure optical properties meet customer and regulatory specifications. The construction industry is a growing segment, as these devices help maintain uniform brightness in paints, coatings, and cementitious materials. The chemical industry also contributes significantly, using whiteness meters in pigment, detergent, and textile processing. Rising infrastructure projects and demand for premium-grade materials are key drivers for adoption across applications.
- For instance, Yante Science & Technology Co. Ltd.’s YT-CM3000 automatic color analyzer measures whiteness in plastics with a measuring range of 0-200%, repeatability ≤ 0.05 ΔE*, and reproducibility ≤ 0.30 ΔE*.
By Operation
Automatic whiteness meters accounted for around 60% share in 2024, propelled by their ability to deliver faster, error-free measurements with minimal operator intervention. These systems are increasingly integrated into production lines, supporting real-time quality monitoring and reducing operational downtime. Industries with high throughput requirements, such as plastics and chemicals, favor automatic systems to maintain consistency and improve efficiency. Manual whiteness meters still serve niche use cases, especially in small laboratories or field applications where low-cost, portable solutions are preferred, but automation remains the dominant growth driver in this segment.
Market Overview
Rising Demand for Quality Control in Plastics
Growing use of plastics in packaging and consumer goods drives demand for precise whiteness measurement. Manufacturers rely on whiteness meters to maintain color consistency and meet optical standards. The plastic industry’s 40% market share highlights its leading role in adoption. Increasing regulatory focus on product quality and aesthetics further accelerates investment in advanced whiteness meters, supporting efficient production processes. This factor remains the key growth driver shaping market expansion.
- For instance, PCE Instruments UK Ltd.’s PCE-WSB-1 handheld whiteness/brightness color meter offers a display resolution of 0.1, repeat accuracy ± 0.1, weighs approx 500 grams, and runs off AA batteries (5×1.5 V).
Expansion of Construction Activities
Global infrastructure development boosts demand for whiteness meters to control brightness in paints, coatings, and cement. Construction companies increasingly integrate these devices to ensure aesthetic consistency and meet architectural specifications. The growing preference for premium building materials is driving the use of advanced quality monitoring tools. Rapid urbanization in Asia-Pacific and the Middle East further strengthens this driver, making construction a major contributor to market growth.
- For instance, the specifications for GAO Tek Inc.’s “Whiteness Meter with Automatic Correction” confirm its high-automatic and multi-function microcomputer. It is equipped with an RS232 serial communication interface and includes an embedded memory and storage system capable of storing 20 groups of measurement data. The instrument also features quick automatic correction and self-diagnosis functionality.
Shift Toward Automated Solutions
The move toward Industry 4.0 and smart factories is driving the adoption of automatic whiteness meters. These devices provide faster, error-free results and enable integration with digital production monitoring systems. Industries prefer automation to minimize manual intervention and reduce variability in quality checks. Automatic meters’ 60% market share in 2024 demonstrates their growing dominance, making automation a significant growth enabler in high-volume production environments.
Key Trends & Opportunities
Integration with Digital Quality Systems
Manufacturers are adopting whiteness meters that integrate seamlessly with digital quality management platforms. This trend supports real-time data logging, remote monitoring, and predictive maintenance. It allows quality managers to respond quickly to deviations, reducing rework and waste. The opportunity lies in developing IoT-enabled whiteness meters for continuous production environments, which will further drive market adoption. This remains a key trend and opportunity for technology suppliers.
- For instance, according to the specifications available for the Westtune WSB-L Laboratory Whiteness Brightness Color Tester, the instrument has a measurement range of 0–120%, a minimum reading of 0.1%, a display stability of \(\pm 0.2\)%, a repeatability of 0.3, and an accuracy of \(\pm 1.5\)%. The instrument has a gross weight of 7 kg and overall dimensions of 280mm × 120mm × 350mm.
Emergence of Portable, Smart Devices
There is rising interest in compact, battery-operated whiteness meters with wireless connectivity. Portable devices enable field testing and immediate decision-making, which is especially useful for construction sites and small-scale manufacturing. Their growing affordability and ease of use open opportunities for adoption in developing markets. Manufacturers offering user-friendly, connected solutions stand to gain significant market share in the coming years.
- For instance, Konica Minolta’s CR-400 portable Chroma Meter delivers repeatability within ΔE*ab 0.07 when measuring a white calibration plate 30 times at 10-second intervals.
Key Challenges
High Initial Investment and Calibration Costs
Whiteness meters, particularly automatic and high-precision models, involve substantial capital costs. Frequent calibration and maintenance add to operational expenses, making them challenging for small manufacturers with limited budgets. This acts as a barrier to adoption in price-sensitive markets. Managing cost without compromising measurement accuracy remains the key challenge for market players.
Limited Awareness in Emerging Markets
In several developing economies, awareness about the benefits of whiteness measurement remains low. Small manufacturers often rely on visual inspection, leading to inconsistent product quality. Lack of technical expertise and training hinders adoption despite the availability of cost-effective devices. Addressing this gap through education and targeted marketing will be critical to unlock untapped potential.
Regional Analysis
North America
North America held around 32% market share in 2024, driven by strong demand from the plastics and construction sectors. The United States leads adoption, supported by strict quality standards and advanced manufacturing infrastructure. Growing investments in smart manufacturing and digital quality control systems are further accelerating the use of automatic whiteness meters. The presence of leading manufacturers and established R&D facilities supports continuous innovation. Canada and Mexico are also witnessing rising adoption due to expanding construction and packaging industries, making the region a key contributor to global market revenue and long-term technology development.
Europe
Europe accounted for nearly 28% market share in 2024, supported by stringent EU regulations on product quality and safety. Countries such as Germany, France, and the UK dominate adoption, with a focus on precision instruments for plastics, paper, and chemical applications. The growing trend of sustainable construction materials further drives demand for whiteness measurement solutions. High investments in R&D and automation foster the development of advanced whiteness meters. The region benefits from a mature manufacturing base and high awareness about product quality, ensuring steady growth across industrial applications during the forecast period.
Asia-Pacific
Asia-Pacific led the global market with approximately 34% market share in 2024, emerging as the fastest-growing region. China and India dominate demand, driven by rapid industrialization, infrastructure development, and booming plastics production. Expanding manufacturing sectors and government investments in quality compliance programs are increasing adoption rates. Rising awareness about product aesthetics and international export requirements are pushing manufacturers toward adopting advanced whiteness meters. Japan and South Korea also contribute significantly, with a focus on high-precision instruments for specialty applications. This region is expected to maintain its dominance due to its large-scale production capacities.
Latin America
Latin America captured close to 4% market share in 2024, with Brazil and Mexico leading demand. Growth is driven by increasing construction activities and expansion of local manufacturing industries. Adoption of whiteness meters is rising in the paints, coatings, and packaging sectors to meet both domestic and export quality requirements. Limited awareness among small manufacturers remains a challenge, but growing investment from global players is helping improve penetration. The shift toward automated and portable devices offers significant potential, particularly as infrastructure development projects gain momentum in key markets across the region.
Middle East & Africa
Middle East & Africa held around 2% market share in 2024, representing a niche but growing segment. Demand is supported by ongoing infrastructure projects and investments in industrial development across the Gulf countries. The construction industry plays a central role in adoption, using whiteness meters for quality control in building materials. South Africa and UAE are emerging as key markets due to rising manufacturing activities and improved access to quality testing equipment. Limited technical expertise and cost constraints hinder faster adoption, but increasing awareness and urbanization are expected to create opportunities in coming years.
Market Segmentations:
By Type:
- Portable Whiteness Meter
- Bechtop Whiteness Meter
By Application:
- Construction
- Chemical Industry
- Plastic Industry
- Others
By Operation:
By Geography:
- North America
- Europe
- Germany
- France
- U.K.
- Italy
- Spain
- Rest of Europe
- Asia Pacific
- China
- Japan
- India
- South Korea
- South-east Asia
- Rest of Asia Pacific
- Latin America
- Brazil
- Argentina
- Rest of Latin America
- Middle East & Africa
- GCC Countries
- South Africa
- Rest of the Middle East and Africa
Competitive Landscape
The Whiteness Meter market features key players such as PCE Instruments, Caltech Engineering Services, Mesu Lab Instruments (Guangzhou) Co. Ltd, Arotek Scientific Instruments Private Limited, Labtron Equipment Ltd, Optics Technology, Kett US, EIE Instruments, Mxrady Lab Solutions Private Limited, and AELAB Group. The competitive landscape is characterized by innovation-driven strategies, with companies focusing on developing highly accurate, automated, and portable devices to meet diverse industrial requirements. Market participants emphasize integration of digital interfaces, IoT connectivity, and real-time data monitoring to cater to Industry 4.0 initiatives. Strategic partnerships with distributors and end-users help expand global reach and strengthen after-sales services. Continuous investment in R&D supports the introduction of user-friendly, cost-effective solutions targeting small and mid-sized manufacturers. Players also compete by offering calibration support, regulatory compliance features, and training programs to increase adoption rates. Competition remains moderate, with growing focus on expanding presence in emerging economies through localized production and service networks.
Shape Your Report to Specific Countries or Regions & Enjoy 30% Off!
Key Player Analysis
Recent Developments
- In 2025, George Kent Group announced a collaboration with a Chinese company from Qingdao to develop Malaysia’s first ultrasonic water meter.
- In 2024, Hunter Lab introduced new ColorFlex L2 replaced the discontinued ColorFlex EZ product line in late 2024. This new version offers an upgraded platform for color and whiteness measurement.
- In 2024, AELAB Group offering a range of high-performance whiteness meters and related equipment to laboratory and industrial customers.
Report Coverage
The research report offers an in-depth analysis based on Type, Application, Operation and Geography. It details leading market players, providing an overview of their business, product offerings, investments, revenue streams, and key applications. Additionally, the report includes insights into the competitive environment, SWOT analysis, current market trends, as well as the primary drivers and constraints. Furthermore, it discusses various factors that have driven market expansion in recent years. The report also explores market dynamics, regulatory scenarios, and technological advancements that are shaping the industry. It assesses the impact of external factors and global economic changes on market growth. Lastly, it provides strategic recommendations for new entrants and established companies to navigate the complexities of the market.
Future Outlook
- The market is expected to grow steadily with rising demand for quality control across industries.
- Adoption of automatic whiteness meters will increase due to Industry 4.0 and smart factory trends.
- Portable whiteness meters will see higher demand for on-site testing in construction and manufacturing.
- Integration with IoT and cloud-based systems will enable real-time monitoring and data analytics.
- Emerging markets in Asia-Pacific and Latin America will drive significant growth in coming years.
- Development of energy-efficient and user-friendly devices will gain focus from manufacturers.
- Regulatory requirements for product quality and standardization will continue to boost adoption.
- Strategic partnerships and collaborations will expand product reach and improve service offerings.
- Increasing digitalization will create opportunities for software-linked quality control solutions.
- Rising competition will lead to more affordable devices, improving access for small-scale industries.


