Market Overview
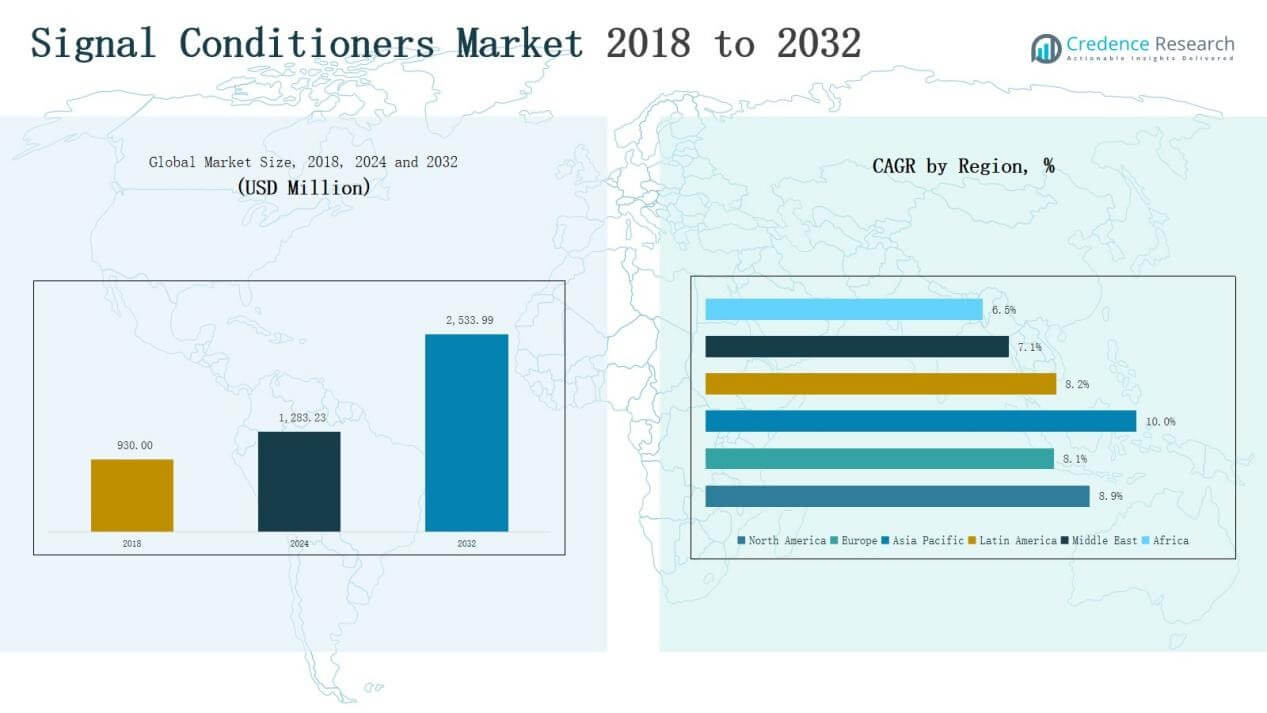
Signal Conditioners Market size was valued at USD 930.00 million in 2018, reaching USD 1,283.23 million in 2024, and is anticipated to reach USD 2,533.99 million by 2032, at a CAGR of 8.94% during the forecast period (2024–2032).
| REPORT ATTRIBUTE |
DETAILS |
| Historical Period |
2020-2023 |
| Base Year |
2024 |
| Forecast Period |
2025-2032 |
| Signal Conditioners Market Size 2024 |
USD 1,283.23 Million |
| Signal Conditioners Market, CAGR |
8.94% |
| Signal Conditioners Market Size 2032 |
USD 2,533.99 Million |
The Signal Conditioners Market is shaped by the presence of leading companies including Omega Engineering, Rockwell Automation, Schneider Electric, Texas Instruments, Analog Devices, Maxim Integrated, Yokogawa Electric Corporation, and KYOWA. These players maintain competitive strength through extensive product portfolios, technological innovation, and global distribution networks. They focus on integrating advanced digital interfaces, IoT compatibility, and wireless solutions to meet rising demand across automation, healthcare, and energy sectors. Regionally, Asia Pacific emerged as the leading market in 2024 with a 31% share, driven by rapid industrialization, strong manufacturing bases, and large-scale adoption of smart factory technologies across China, India, Japan, and South Korea.
Access crucial information at unmatched prices!
Request your sample report today & start making informed decisions powered by Credence Research Inc.!
Download Sample
Market Insights
- The Signal Conditioners Market grew from USD 930.00 million in 2018 to USD 1,283.23 million in 2024, and is expected to reach USD 2,533.99 million by 2032.
- Asia Pacific led with 31% share in 2024, supported by rapid industrialization, smart factory adoption, and strong demand from China, India, Japan, and South Korea.
- Analog signal conditioners dominated with 38% share in 2024, while digital models gained momentum due to Industry 4.0 compatibility and advanced data processing capabilities.
- Wired signal conditioners accounted for 55% share in 2024, driven by industrial automation and process control, though wireless solutions are expanding faster with IoT adoption.
- Module-based designs held 41% share in 2024, reflecting scalability and flexibility in industrial environments, while ruggedized conditioners gained traction in aerospace, defense, and extreme conditions.
 Market Segment Insights
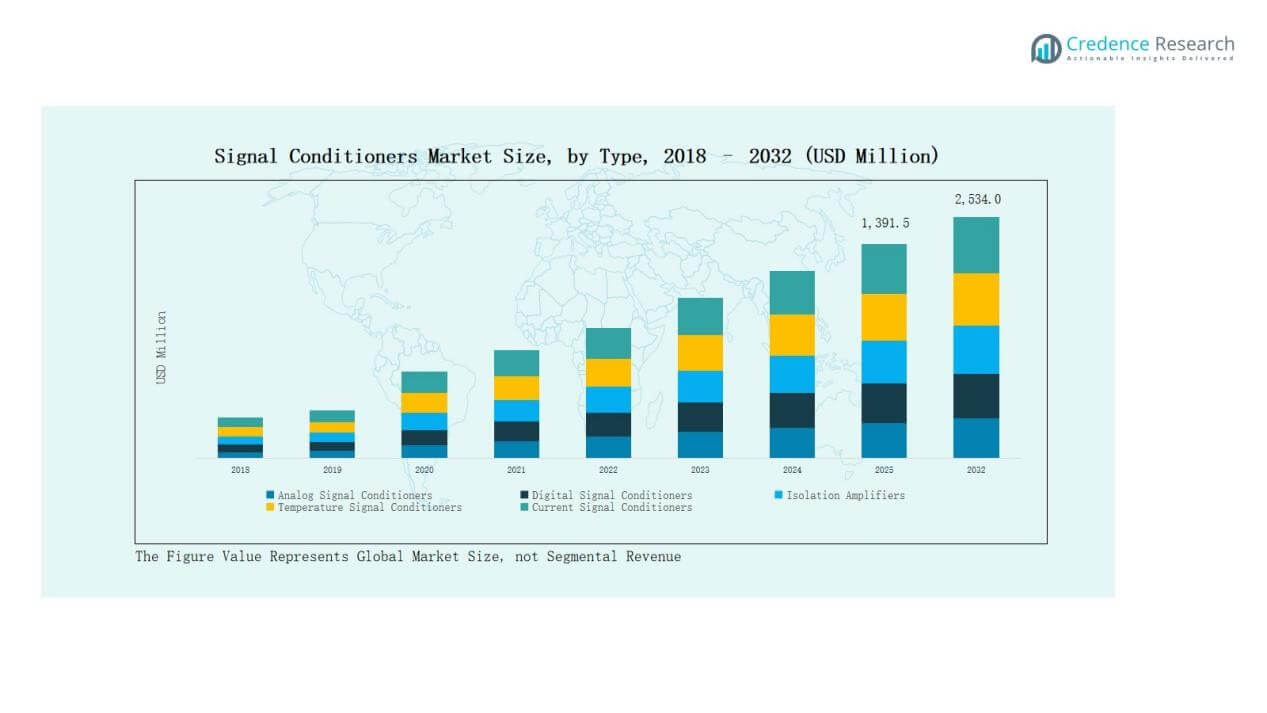
By Type
The analog signal conditioners segment dominated the Signal Conditioners Market in 2024, accounting for 38% of the total share. Analog solutions remain widely adopted due to cost efficiency, ease of integration, and reliability in legacy industrial systems. However, digital signal conditioners are gaining traction, supported by advanced data processing and compatibility with Industry 4.0 architectures. Rising demand for isolation amplifiers and temperature signal conditioners in precision applications, alongside current signal conditioners in energy monitoring, further strengthens overall market growth.
For instance, Weidmüller expanded its ACT20P Pro DCDC II isolation amplifier series, offering higher precision in current signal conditioning for renewable energy and automation applications.
By Connectivity
The wired signal conditioners segment held the largest market share of 55% in 2024, driven by widespread use in industrial automation, process control, and energy applications where reliability and low latency are essential. Wireless solutions are expanding at a faster pace, supported by IoT adoption and remote monitoring needs across distributed facilities. Networked signal conditioners are also emerging, offering enhanced connectivity for smart factories and predictive maintenance frameworks.
For instance, Siemens showcased its SIMATIC S7-1500 signal condition modules with integrated digital connectivity at SPS 2023, supporting predictive maintenance and smart manufacturing applications.
By Design
The module-based signal conditioners segment led the market with 41% share in 2024, reflecting strong adoption in multi-channel applications and flexible industrial environments. Their scalability and ability to interface with varied sensor inputs support dominant use across manufacturing and process industries. Integrated signal conditioners are gaining demand in compact devices, while standalone and ruggedized designs find applications in critical sectors such as aerospace, defense, and field operations
 Key Growth Drivers
Rising Demand in Industrial Automation
The expansion of industrial automation continues to drive significant demand for signal conditioners. These devices ensure accurate transmission and processing of signals from various sensors and instruments, improving system reliability. With manufacturers investing in Industry 4.0, predictive maintenance, and smart factories, the need for precise signal conditioning grows rapidly. The adoption of programmable logic controllers (PLCs), distributed control systems (DCS), and supervisory control systems further strengthens market expansion by making conditioners essential for accuracy and performance.
For instance, Rexel’s signal conditioners isolate and convert sensor signals to standardized formats, enhancing process reliability and reducing noise interference in manufacturing plants.
Increased Adoption in Process Industries
Process industries such as oil and gas, chemicals, and power generation increasingly rely on signal conditioners to ensure measurement accuracy and safety. These industries deal with complex signals that require conditioning for effective monitoring and control. The rising focus on safety compliance, along with high demand for real-time monitoring, accelerates product adoption. Additionally, the global push for energy efficiency and reliable plant operations creates strong opportunities for signal conditioners to play a central role in minimizing downtime and optimizing productivity.
Integration with Emerging Technologies
The integration of signal conditioners with IoT, cloud computing, and AI platforms is a major growth driver. These technologies enhance remote monitoring, data analytics, and predictive maintenance capabilities across industrial environments. Smart conditioners with digital interfaces enable seamless communication with networked systems, improving efficiency and reducing human intervention. With increasing investments in digital transformation across manufacturing, healthcare, and energy sectors, the integration of signal conditioners into connected infrastructures ensures sustained demand and market growth.
For instance, Siemens launched its Sitrans SCM IQ signal conditioning system integrated with cloud-based MindSphere, enabling predictive maintenance and real-time monitoring of rotating equipment in process industries.
Key Trends & Opportunities
Shift Toward Wireless and Networked Connectivity
Wireless and networked signal conditioners are emerging as a strong trend in the market. Organizations seek flexible, scalable solutions to connect devices across wide facilities without extensive cabling. This shift supports cost savings and operational efficiency, especially in remote or hazardous environments. With rising adoption of IoT and smart sensors, wireless conditioners offer real-time monitoring and improved adaptability. The trend represents a key opportunity for manufacturers to develop advanced solutions catering to industries prioritizing remote access and connectivity.
For instance, ioX-Connect introduced wireless temperature and motion sensors for smart buildings that enable continuous environment monitoring and automation with remote access.
Growing Demand for Ruggedized and Specialized Designs
Specialized applications in aerospace, defense, and extreme industrial environments are driving demand for ruggedized signal conditioners. These devices are built to withstand temperature fluctuations, vibrations, and harsh operating conditions while maintaining accuracy. The opportunity lies in providing highly reliable products that meet industry-specific compliance and safety standards. As critical sectors invest in high-performance monitoring equipment, manufacturers offering durable and application-specific conditioners are positioned to capture premium market segments and secure long-term contracts.
For instance, Dataforth released the SCM5B45 analog signal conditioning module, designed for industrial environments requiring isolation and durability in applications with fluctuating temperatures and electrical noise.
Key Challenges
High Installation and Maintenance Costs
The initial cost of installing signal conditioners, coupled with ongoing maintenance expenses, poses a challenge for market growth. Smaller enterprises and cost-sensitive industries often hesitate to adopt advanced solutions due to limited budgets. Additionally, the need for skilled technicians to manage calibration and upkeep adds to the financial burden. These cost barriers limit widespread adoption, particularly in developing regions, despite the clear operational benefits offered by signal conditioners.
Compatibility with Legacy Systems
Ensuring compatibility with legacy equipment remains a significant challenge in the market. Many industries operate with older infrastructure, making integration of modern digital signal conditioners complex and costly. Upgrading existing systems to support advanced conditioners often requires additional investments in controllers and software. This slows adoption rates in traditional industries where replacing entire setups is not financially feasible. Vendors face the task of designing adaptable conditioners that can integrate seamlessly into mixed-system environments.
Intense Market Competition
The Signal Conditioners Market is characterized by high competition among established global players and regional suppliers. Price pressure, product commoditization, and rapid technological shifts intensify the competitive landscape. Companies are forced to balance innovation with cost efficiency, while also differentiating themselves through value-added services. Emerging players challenge incumbents by offering low-cost alternatives, further pressuring profit margins. Sustaining growth requires continuous investment in R&D, customization, and strategic partnerships, making competition a persistent challenge for manufacturers.
Regional Analysis
North America
The North America Signal Conditioners Market reached USD 301.32 million in 2018, expanded to USD 410.11 million in 2024, and is projected to reach USD 808.60 million by 2032, at a CAGR of 8.9%. The region held a 32% share in 2024, supported by advanced industrial automation and early adoption of digital conditioning solutions. Strong presence of leading manufacturers, high investments in smart factories, and growth in process industries strengthen market expansion. The U.S. remains the key contributor, with Canada and Mexico supporting demand through energy, automotive, and healthcare sectors.
Europe
Europe accounted for USD 226.27 million in 2018, increased to USD 299.09 million in 2024, and is anticipated to reach USD 555.08 million by 2032, at a CAGR of 8.1%. Holding a 23% share in 2024, Europe benefits from established process industries, robust healthcare infrastructure, and rising focus on energy efficiency. Germany, the UK, and France dominate adoption due to advanced manufacturing bases. Demand for ruggedized conditioners in aerospace, defense, and automotive further drives regional growth, with Eastern Europe showing gradual uptake supported by infrastructure modernization.
Asia Pacific
Asia Pacific led the global market with USD 281.23 million in 2018, rising to USD 401.97 million in 2024, and is projected to achieve USD 860.80 million by 2032, at the fastest CAGR of 10.0%. The region held a 31% share in 2024, driven by rapid industrialization, expanding electronics manufacturing, and large-scale energy projects in China, India, Japan, and South Korea. Rising investments in automation, coupled with government initiatives for smart manufacturing, position Asia Pacific as the global growth hub. Increasing adoption of digital and wireless conditioners supports long-term expansion.
Latin America
The Latin America Signal Conditioners Market was valued at USD 74.49 million in 2018, grew to USD 102.00 million in 2024, and is expected to reach USD 189.97 million by 2032, at a CAGR of 8.2%. The region captured a 8% share in 2024, with Brazil and Mexico leading demand across energy, oil and gas, and automotive industries. Expansion of manufacturing infrastructure and adoption of automation technologies are accelerating product uptake. While economic volatility remains a concern, growing demand for cost-efficient conditioners offers long-term opportunities for suppliers targeting emerging markets.
Middle East
The Middle East market generated USD 26.88 million in 2018, increased to USD 34.00 million in 2024, and is forecasted to reach USD 58.30 million by 2032, at a CAGR of 7.1%. With a 3% share in 2024, demand is fueled by large-scale energy projects, oil and gas operations, and industrial modernization in GCC countries. Israel and Turkey are also investing in advanced industrial systems, creating niche opportunities for suppliers. However, slower diversification outside oil-driven economies may limit adoption compared to other regions.
Africa
The Africa Signal Conditioners Market stood at USD 19.81 million in 2018, expanded to USD 36.06 million in 2024, and is projected to reach USD 61.24 million by 2032, at a CAGR of 6.5%. The region represented a 3% share in 2024, supported by rising energy projects, mining activities, and gradual industrial growth. South Africa and Egypt dominate demand due to expanding power and manufacturing sectors. While infrastructure challenges and limited budgets restrict widespread adoption, increasing focus on renewable energy projects is expected to create future opportunities for signal conditioner deployment.
 Market Segmentations:
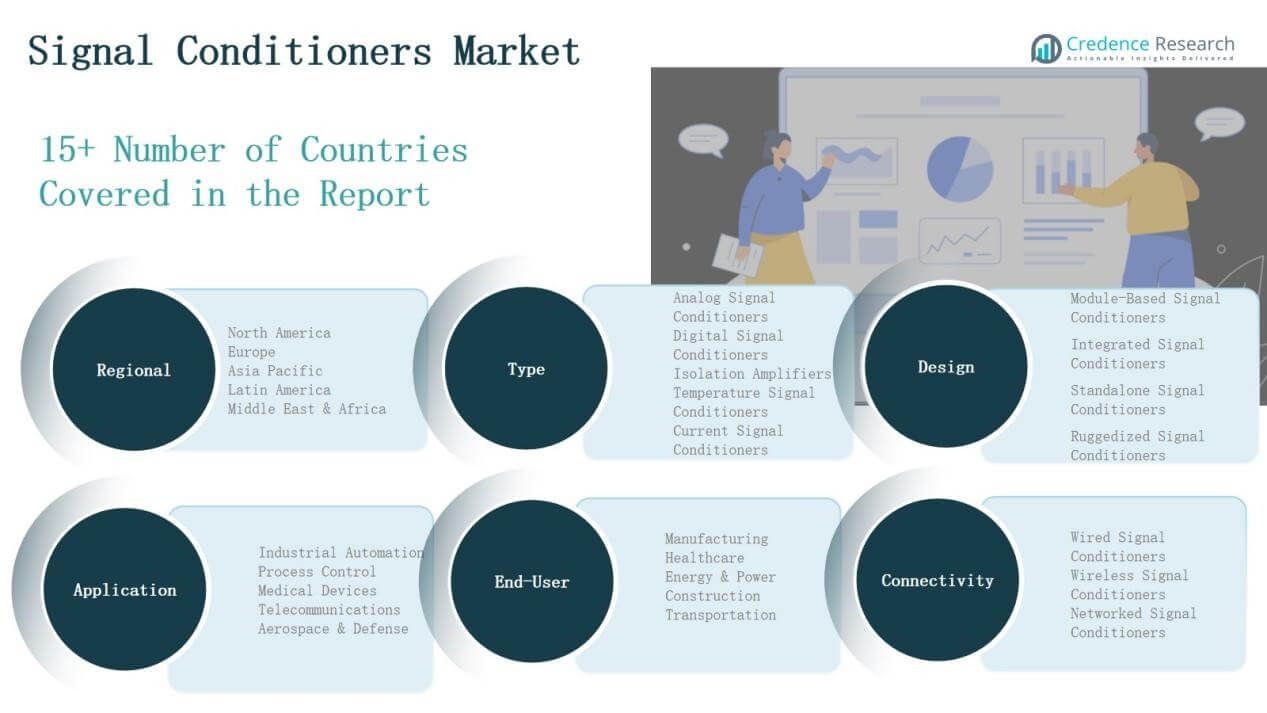
By Type
- Analog Signal Conditioners
- Digital Signal Conditioners
- Isolation Amplifiers
- Temperature Signal Conditioners
- Current Signal Conditioners
By Connectivity
- Wired Signal Conditioners
- Wireless Signal Conditioners
- Networked Signal Conditioners
By Design
- Module-Based Signal Conditioners
- Integrated Signal Conditioners
- Standalone Signal Conditioners
- Ruggedized Signal Conditioners
By Application
- Industrial Automation
- Process Control
- Medical Devices
- Telecommunications
- Aerospace & Defense
By End-User
- Manufacturing
- Healthcare
- Energy & Power
- Construction
- Transportation
By Region
- North America
- Europe
- UK
- France
- Germany
- Italy
- Spain
- Russia
- Rest of Europe
- Asia Pacific
- China
- Japan
- South Korea
- India
- Australia
- Southeast Asia
- Rest of Asia Pacific
- Latin America
- Brazil
- Argentina
- Rest of Latin America
- Middle East
- GCC Countries
- Israel
- Turkey
- Rest of Middle East
- Africa
- South Africa
- Egypt
- Rest of Africa
Competitive Landscape
The Signal Conditioners Market is moderately fragmented, with global leaders and regional players competing through innovation, product quality, and distribution strength. Key companies such as Omega Engineering, Rockwell Automation, Schneider Electric, Texas Instruments, Analog Devices, Maxim Integrated, Yokogawa Electric Corporation, and KYOWA dominate through extensive portfolios and strong brand recognition. These players focus on integrating advanced digital interfaces, wireless connectivity, and IoT-ready solutions to meet rising demand for automation and smart monitoring. Strategic partnerships, acquisitions, and regional expansions remain central to enhancing market penetration and addressing sector-specific needs such as process industries, healthcare, and aerospace. Competition is also marked by price pressures and differentiation through application-specific designs, particularly ruggedized and modular conditioners. While established companies invest heavily in R&D and customization, smaller firms leverage low-cost offerings to capture opportunities in emerging markets. This balance of innovation and affordability defines the competitive dynamics, driving continuous product development and market consolidation.
Shape Your Report to Specific Countries or Regions & Enjoy 30% Off!
Key Players
Recent Developments
- In 2023, Dataforth Corporation launched a next-generation modular high voltage attenuator system for analog signal conditioning.
- In May 2025, Analog Devices (ADI) showcased advanced RF, microwave, power, and signal chain solutions, including signal-conditioning components, at IMS 2025.
- In 2023, Phoenix Contact launched new intrinsically safe versions of their MINI Analog Pro signal conditioners for explosion protection.
Report Coverage
The research report offers an in-depth analysis based on Type, Connectivity, Design, Application, End User and Region. It details leading market players, providing an overview of their business, product offerings, investments, revenue streams, and key applications. Additionally, the report includes insights into the competitive environment, SWOT analysis, current market trends, as well as the primary drivers and constraints. Furthermore, it discusses various factors that have driven market expansion in recent years. The report also explores market dynamics, regulatory scenarios, and technological advancements that are shaping the industry. It assesses the impact of external factors and global economic changes on market growth. Lastly, it provides strategic recommendations for new entrants and established companies to navigate the complexities of the market.
Future Outlook
- Demand will grow with increasing adoption of Industry 4.0 and smart factories.
- Digital signal conditioners will see higher penetration across industrial and healthcare applications.
- Wireless and networked conditioners will gain traction for remote monitoring and control.
- Ruggedized designs will expand use in aerospace, defense, and harsh industrial environments.
- Integration with IoT and cloud platforms will drive real-time data analytics opportunities.
- Miniaturized and integrated solutions will support compact device applications.
- Energy and power sectors will boost adoption for efficient monitoring systems.
- Emerging economies will offer growth opportunities through industrial modernization.
- Strategic collaborations and acquisitions will reshape competitive positioning in the market.
- Sustainability-focused innovations will encourage development of energy-efficient and durable conditioners.


