CHAPTER NO. 1 : INTRODUCTION 25
1.1.1. Report Description 25
Purpose of the Report 25
USP & Key Offerings 25
1.1.2. Key Benefits for Stakeholders 25
1.1.3. Target Audience 26
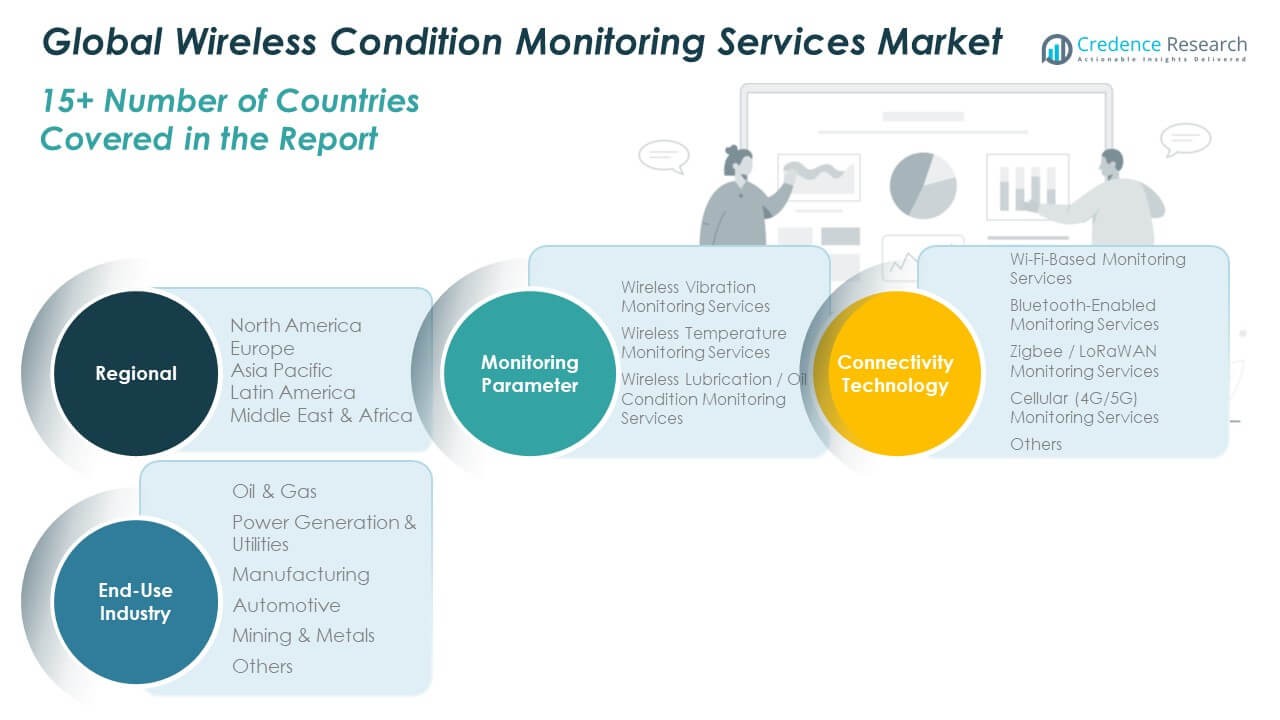
1.1.4. Report Scope 26
1.1.5. Regional Scope 27
CHAPTER NO. 2 : EXECUTIVE SUMMARY 28
2.1. Wireless Condition Monitoring Services Market Snapshot 28
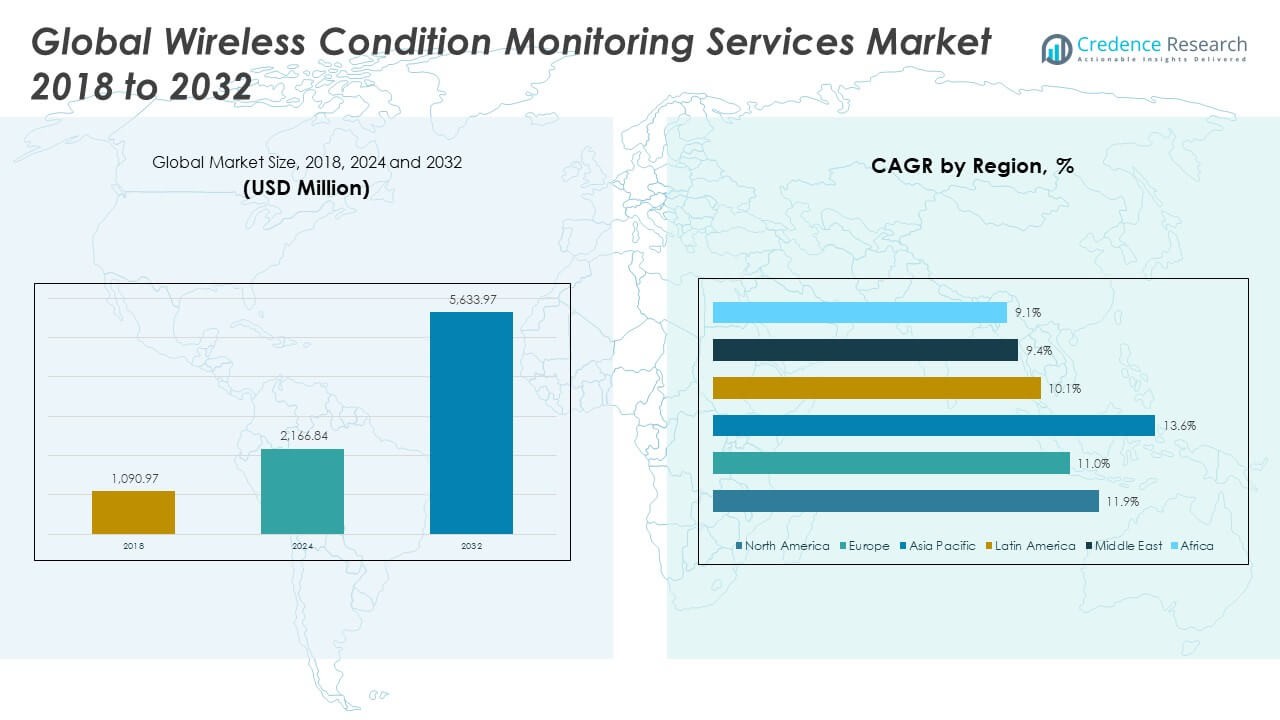
2.1.1. Global Wireless Condition Monitoring Services Market, 2018 – 2032 (USD Million) 29
CHAPTER NO. 3 : GEOPOLITICAL CRISIS IMPACT ANALYSIS 30
3.1. Russia-Ukraine and Israel-Palestine War Impacts 30
CHAPTER NO. 4 : WIRELESS CONDITION MONITORING SERVICES MARKET – INDUSTRY ANALYSIS 31
4.1. Introduction 31
4.2. Market Drivers 32
4.2.1. Increasing Adoption of Predictive Maintenance Strategies 32
4.2.2. Growing Demand for Remote and Real-Time Monitoring Solutions 33
4.3. Market Restraints 34
4.3.1. Data Security and Connectivity Concerns 34
4.4. Market Opportunities 35
4.4.1. Market Opportunity Analysis 35
4.5. Porter’s Five Forces Analysis 36
CHAPTER NO. 5 : ANALYSIS COMPETITIVE LANDSCAPE 37
5.1. Company Market Share Analysis – 2024 37
5.1.1. Global Wireless Condition Monitoring Services Market: Company Market Share, by Revenue, 2024 37
5.1.2. Global Wireless Condition Monitoring Services Market: Top 6 Company Market Share, by Revenue, 2024 37
5.1.3. Global Wireless Condition Monitoring Services Market: Top 3 Company Market Share, by Revenue, 2024 38
5.2. Global Wireless Condition Monitoring Services Market Company Revenue Market Share, 2024 39
5.3. Company Assessment Metrics, 2024 40
5.3.1. Stars 40
5.3.2. Emerging Leaders 40
5.3.3. Pervasive Players 40
5.3.4. Participants 40
5.4. Start-ups /SMEs Assessment Metrics, 2024 40
5.4.1. Progressive Companies 40
5.4.2. Responsive Companies 40
5.4.3. Dynamic Companies 40
5.5. Starting BlocksStrategic Developments 40
5.5.1. Acquisitions & Mergers 41
New Connectivity Technology Launch 41
Regional Expansion 41
5.6. Key Players Connectivity Technology Matrix 42
CHAPTER NO. 6 : PESTEL & ADJACENT MARKET ANALYSIS 43
6.1. PESTEL 43
6.1.1. Political Factors 43
6.1.2. Economic Factors 43
6.1.3. Social Factors 43
6.1.4. Technological Factors 43
6.1.5. Environmental Factors 43
6.1.6. Legal Factors 43
6.2. Adjacent Market Analysis 43
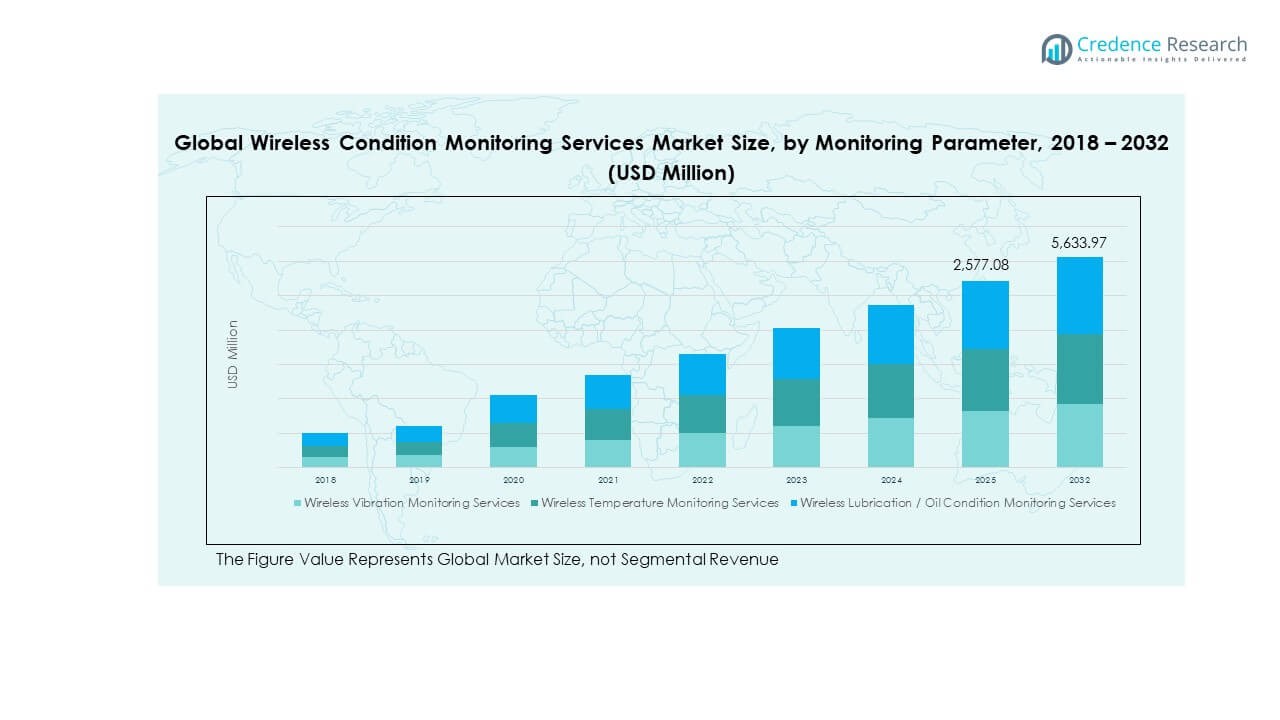
CHAPTER NO. 7 : WIRELESS CONDITION MONITORING SERVICES MARKET – BY MONITORING PARAMETER SEGMENT ANALYSIS 44
7.1. Wireless Condition Monitoring Services Market Overview, by Monitoring Parameter Segment 44
7.1.1. Wireless Condition Monitoring Services Market Revenue Share, By Monitoring Parameter, 2023 & 2032 45
7.1.2. Wireless Condition Monitoring Services Market Attractiveness Analysis, By Monitoring Parameter 46
7.1.3. Incremental Revenue Growth Opportunity, by Monitoring Parameter, 2024 – 2032 46
7.1.4. Wireless Condition Monitoring Services Market Revenue, By Monitoring Parameter, 2018, 2023, 2027 & 2032 47
7.2. Wireless Vibration Monitoring Services 48
7.2.1. Global Wireless Vibration Monitoring Services Wireless Condition Monitoring Services Market Revenue, By Region, 2018 – 2023 (USD Million) 49
7.2.2. Global Wireless Vibration Monitoring Services Wireless Condition Monitoring Services Market Revenue, By Region, 2024 – 2032 (USD Million) 49
7.3. Wireless Temperature Monitoring Services 50
7.3.1. Global Wireless Temperature Monitoring Services Wireless Condition Monitoring Services Market Revenue, By Region, 2018 – 2023 (USD Million) 51
7.3.2. Global Wireless Temperature Monitoring Services Wireless Condition Monitoring Services Market Revenue, By Region, 2024 – 2032 (USD Million) 51
7.4. Wireless Lubrication / Oil Condition Monitoring Services 52
7.4.1. Global Wireless Lubrication / Oil Condition Monitoring Services Wireless Condition Monitoring Services Market Revenue, By Region, 2018 – 2023 (USD Million) 53
7.4.2. Global Wireless Lubrication / Oil Condition Monitoring Services Wireless Condition Monitoring Services Market Revenue, By Region, 2024 – 2032 (USD Million) 53
CHAPTER NO. 8 : WIRELESS CONDITION MONITORING SERVICES MARKET – BY CONNECTIVITY TECHNOLOGY SEGMENT ANALYSIS 54
8.1. Wireless Condition Monitoring Services Market Overview, by Connectivity Technology Segment 54
8.1.1. Wireless Condition Monitoring Services Market Revenue Share, By Connectivity Technology, 2023 & 2032 55
8.1.2. Wireless Condition Monitoring Services Market Attractiveness Analysis, By Connectivity Technology 56
8.1.3. Incremental Revenue Growth Opportunity, by Connectivity Technology, 2024 – 2032 56
8.1.4. Wireless Condition Monitoring Services Market Revenue, By Connectivity Technology, 2018, 2023, 2027 & 2032 57
8.2. Wi-Fi-Based Monitoring Services 58
8.2.1. Global Wi-Fi-Based Monitoring Services Wireless Condition Monitoring Services Market Revenue, By Region, 2018 – 2023 (USD Million) 59
8.2.2. Global Wi-Fi-Based Monitoring Services Wireless Condition Monitoring Services Market Revenue, By Region, 2024 – 2032 (USD Million) 59
8.3. Bluetooth-Enabled Monitoring Services 60
8.3.1. Global Bluetooth-Enabled Monitoring Services Wireless Condition Monitoring Services Market Revenue, By Region, 2018 – 2023 (USD Million) 61
8.3.2. Global Bluetooth-Enabled Monitoring Services Wireless Condition Monitoring Services Market Revenue, By Region, 2024 – 2032 (USD Million) 61
8.4. Zigbee / LoRaWAN Monitoring Services 62
8.4.1. Global Zigbee / LoRaWAN Monitoring Services Wireless Condition Monitoring Services Market Revenue, By Region, 2018 – 2023 (USD Million) 63
8.4.2. Global Zigbee / LoRaWAN Monitoring Services Wireless Condition Monitoring Services Market Revenue, By Region, 2024 – 2032 (USD Million) 63
8.5. Cellular (4G/5G) Monitoring Services 64
8.5.1. Global Cellular (4G/5G) Monitoring Services Wireless Condition Monitoring Services Market Revenue, By Region, 2018 – 2023 (USD Million) 65
8.5.2. Global Cellular (4G/5G) Monitoring Services Wireless Condition Monitoring Services Market Revenue, By Region, 2024 – 2032 (USD Million) 65
8.6. Others 66
8.6.1. Global Others Wireless Condition Monitoring Services Market Revenue, By Region, 2018 – 2023 (USD Million) 67
8.6.2. Global Others Wireless Condition Monitoring Services Market Revenue, By Region, 2024 – 2032 (USD Million) 67
CHAPTER NO. 9 : WIRELESS CONDITION MONITORING SERVICES MARKET – BY END-USE INDUSTRY SEGMENT ANALYSIS 68
9.1. Wireless Condition Monitoring Services Market Overview, by End-Use Industry Segment 68
9.1.1. Wireless Condition Monitoring Services Market Revenue Share, By End-Use Industry, 2023 & 2032 69
9.1.2. Wireless Condition Monitoring Services Market Attractiveness Analysis, By End-Use Industry 70
9.1.3. Incremental Revenue Growth Opportunity, by End-Use Industry, 2024 – 2032 70
9.1.4. Wireless Condition Monitoring Services Market Revenue, By End-Use Industry, 2018, 2023, 2027 & 2032 71
9.2. Oil & Gas 72
9.2.1. Global Oil & Gas Wireless Condition Monitoring Services Market Revenue, By Region, 2018 – 2023 (USD Million) 73
9.2.2. Global Oil & Gas Wireless Condition Monitoring Services Market Revenue, By Region, 2024 – 2032 (USD Million) 73
9.3. Power Generation & Utilities 74
9.3.1. Global Power Generation & Utilities Wireless Condition Monitoring Services Market Revenue, By Region, 2018 – 2023 (USD Million) 75
9.3.2. Global Power Generation & Utilities Wireless Condition Monitoring Services Market Revenue, By Region, 2024 – 2032 (USD Million) 75
9.4. Manufacturing 76
9.4.1. Global Manufacturing Wireless Condition Monitoring Services Market Revenue, By Region, 2018 – 2023 (USD Million) 77
9.4.2. Global Manufacturing Wireless Condition Monitoring Services Market Revenue, By Region, 2024 – 2032 (USD Million) 77
9.5. Automotive 78
9.5.1. Global Automotive Wireless Condition Monitoring Services Market Revenue, By Region, 2018 – 2023 (USD Million) 79
9.5.2. Global Automotive Wireless Condition Monitoring Services Market Revenue, By Region, 2024 – 2032 (USD Million) 79
9.6. Mining & Metals 80
9.6.1. Global Mining & Metals Wireless Condition Monitoring Services Market Revenue, By Region, 2018 – 2023 (USD Million) 81
9.6.2. Global Mining & Metals Wireless Condition Monitoring Services Market Revenue, By Region, 2024 – 2032 (USD Million) 81
9.7. Others 82
9.7.1. Global Others Wireless Condition Monitoring Services Market Revenue, By Region, 2018 – 2023 (USD Million) 83
9.7.2. Global Others Wireless Condition Monitoring Services Market Revenue, By Region, 2024 – 2032 (USD Million) 83
CHAPTER NO. 10 : WIRELESS CONDITION MONITORING SERVICES MARKET – REGIONAL ANALYSIS 84
10.1. Wireless Condition Monitoring Services Market Overview, by Regional Segments 84
10.2. Region 85
10.2.1. Global Wireless Condition Monitoring Services Market Revenue Share, By Region, 2023 & 2032 85
10.2.2. Wireless Condition Monitoring Services Market Attractiveness Analysis, By Region 86
10.2.3. Incremental Revenue Growth Opportunity, by Region, 2024 – 2032 86
10.2.4. Wireless Condition Monitoring Services Market Revenue, By Region, 2018, 2023, 2027 & 2032 87
10.2.5. Global Wireless Condition Monitoring Services Market Revenue, By Region, 2018 – 2023 (USD Million) 88
10.2.6. Global Wireless Condition Monitoring Services Market Revenue, By Region, 2024 – 2032 (USD Million) 88
10.3. Monitoring Parameter 89
10.3.1. Global Wireless Condition Monitoring Services Market Revenue, By Monitoring Parameter, 2018 – 2023 (USD Million) 89
10.3.2. Global Wireless Condition Monitoring Services Market Revenue, By Monitoring Parameter, 2024 – 2032 (USD Million) 89
10.4. Connectivity Technology 90
10.4.1. Global Wireless Condition Monitoring Services Market Revenue, By Connectivity Technology, 2018 – 2023 (USD Million) 90
10.4.2. Global Wireless Condition Monitoring Services Market Revenue, By Connectivity Technology, 2024 – 2032 (USD Million) 91
10.5. End-Use Industry 92
10.5.1. Global Wireless Condition Monitoring Services Market Revenue, By End-Use Industry, 2018 – 2023 (USD Million) 92
10.5.2. Global Wireless Condition Monitoring Services Market Revenue, By End-Use Industry, 2024 – 2032 (USD Million) 92
CHAPTER NO. 11 : WIRELESS CONDITION MONITORING SERVICES MARKET – NORTH AMERICA 93
11.1. North America 93
11.1.1. Key Highlights 93
11.1.2. North America Wireless Condition Monitoring Services Market Revenue, By Country, 2018 – 2023 (USD Million) 94
11.1.3. North America Wireless Condition Monitoring Services Market Revenue, By Monitoring Parameter, 2018 – 2023 (USD Million) 95
11.1.4. North America Wireless Condition Monitoring Services Market Revenue, By Connectivity Technology, 2018 – 2023 (USD Million) 96
11.1.5. North America Wireless Condition Monitoring Services Market Revenue, By End-Use Industry, 2018 – 2023 (USD Million) 97
11.2. U.S. 98
11.3. Canada 98
11.4. Mexico 98
CHAPTER NO. 12 : WIRELESS CONDITION MONITORING SERVICES MARKET – EUROPE 99
12.1. Europe 99
12.1.1. Key Highlights 99
12.1.2. Europe Wireless Condition Monitoring Services Market Revenue, By Country, 2018 – 2023 (USD Million) 100
12.1.3. Europe Wireless Condition Monitoring Services Market Revenue, By Monitoring Parameter, 2018 – 2023 (USD Million) 101
12.1.4. Europe Wireless Condition Monitoring Services Market Revenue, By Connectivity Technology, 2018 – 2023 (USD Million) 102
12.1.5. Europe Wireless Condition Monitoring Services Market Revenue, By End-Use Industry, 2018 – 2023 (USD Million) 103
12.2. UK 104
12.3. France 104
12.4. Germany 104
12.5. Italy 104
12.6. Spain 104
12.7. Russia 104
12.8. Belgium 104
12.9. Netherland 104
12.10. Austria 104
12.11. Sweden 104
12.12. Poland 104
12.13. Denmark 104
12.14. Switzerland 104
12.15. Rest of Europe 104
CHAPTER NO. 13 : WIRELESS CONDITION MONITORING SERVICES MARKET – ASIA PACIFIC 105
13.1. Asia Pacific 105
13.1.1. Key Highlights 105
13.1.2. Asia Pacific Wireless Condition Monitoring Services Market Revenue, By Country, 2018 – 2023 (USD Million) 106
13.1.3. Asia Pacific Wireless Condition Monitoring Services Market Revenue, By Monitoring Parameter, 2018 – 2023 (USD Million) 107
13.1.4. Asia Pacific Wireless Condition Monitoring Services Market Revenue, By Connectivity Technology, 2018 – 2023 (USD Million) 108
13.1.5. Asia Pacific Wireless Condition Monitoring Services Market Revenue, By End-Use Industry, 2018 – 2023 (USD Million) 109
13.2. China 110
13.3. Japan 110
13.4. South Korea 110
13.5. India 110
13.6. Australia 110
13.7. Thailand 110
13.8. Indonesia 110
13.9. Vietnam 110
13.10. Malaysia 110
13.11. Philippines 110
13.12. Taiwan 110
13.13. Rest of Asia Pacific 110
CHAPTER NO. 14 : WIRELESS CONDITION MONITORING SERVICES MARKET – LATIN AMERICA 111
14.1. Latin America 111
14.1.1. Key Highlights 111
14.1.2. Latin America Wireless Condition Monitoring Services Market Revenue, By Country, 2018 – 2023 (USD Million) 112
14.1.3. Latin America Wireless Condition Monitoring Services Market Revenue, By Monitoring Parameter, 2018 – 2023 (USD Million) 113
14.1.4. Latin America Wireless Condition Monitoring Services Market Revenue, By Connectivity Technology, 2018 – 2023 (USD Million) 114
14.1.5. Latin America Wireless Condition Monitoring Services Market Revenue, By End-Use Industry, 2018 – 2023 (USD Million) 115
14.2. Brazil 116
14.3. Argentina 116
14.4. Peru 116
14.5. Chile 116
14.6. Colombia 116
14.7. Rest of Latin America 116
CHAPTER NO. 15 : WIRELESS CONDITION MONITORING SERVICES MARKET – MIDDLE EAST 117
15.1. Middle East 117
15.1.1. Key Highlights 117
15.1.2. Middle East Wireless Condition Monitoring Services Market Revenue, By Country, 2018 – 2023 (USD Million) 118
15.1.3. Middle East Wireless Condition Monitoring Services Market Revenue, By Monitoring Parameter, 2018 – 2023 (USD Million) 119
15.1.4. Middle East Wireless Condition Monitoring Services Market Revenue, By Connectivity Technology, 2018 – 2023 (USD Million) 120
15.1.5. Middle East Wireless Condition Monitoring Services Market Revenue, By End-Use Industry, 2018 – 2023 (USD Million) 121
15.2. UAE 122
15.3. KSA 122
15.4. Israel 122
15.5. Turkey 122
15.6. Iran 122
15.7. Rest of Middle East 122
CHAPTER NO. 16 : WIRELESS CONDITION MONITORING SERVICES MARKET – AFRICA 123
16.1. Africa 123
16.1.1. Key Highlights 123
16.1.2. Africa Wireless Condition Monitoring Services Market Revenue, By Country, 2018 – 2023 (USD Million) 124
16.1.3. Africa Wireless Condition Monitoring Services Market Revenue, By Monitoring Parameter, 2018 – 2023 (USD Million) 125
16.1.4. Africa Wireless Condition Monitoring Services Market Revenue, By Connectivity Technology, 2018 – 2023 (USD Million) 126
16.1.5. Africa Wireless Condition Monitoring Services Market Revenue, By End-Use Industry, 2018 – 2023 (USD Million) 127
16.2. Egypt 128
16.3. Nigeria 128
16.4. Algeria 128
16.5. Morocco 128
16.6. Rest of Africa 128
CHAPTER NO. 17 : COMPANY PROFILES 129
17.1. Emerson Electric Co. 129
17.1.1. Company Overview 129
17.1.2. Connectivity Technology Food Portfolio 129
17.1.3. Swot Analysis 129
17.1.4. Business Strategy 130
17.1.5. Financial Overview 130
17.2. SKF Group 131
17.3. Honeywell International Inc. 131
17.4. Siemens AG 131
17.5. Schneider Electric SE 131
17.6. ABB Ltd. 131
17.7. General Electric (GE Vernova) 131
17.8. Company 8 131
17.9. Company 9 131
17.10. Company 10 131
17.11. Company 11 131
17.12. Company 12 131
17.13. Company 13 131
17.14. Company 14 131
List of Figures
FIG NO. 1. Global Wireless Condition Monitoring Services Market Revenue, 2018 – 2032 (USD Million) 29
FIG NO. 2. Porter’s Five Forces Analysis for Global Wireless Condition Monitoring Services Market 36
FIG NO. 3. Company Share Analysis, 2024 37
FIG NO. 4. Company Share Analysis, 2024 37
FIG NO. 5. Company Share Analysis, 2024 38
FIG NO. 6. Wireless Condition Monitoring Services Market – Company Revenue Market Share, 2024 39
FIG NO. 7. Wireless Condition Monitoring Services Market Revenue Share, By Monitoring Parameter, 2023 & 2032 45
FIG NO. 8. Market Attractiveness Analysis, By Monitoring Parameter 46
FIG NO. 9. Incremental Revenue Growth Opportunity by Monitoring Parameter, 2024 – 2032 46
FIG NO. 10. Wireless Condition Monitoring Services Market Revenue, By Monitoring Parameter, 2018, 2023, 2027 & 2032 47
FIG NO. 11. Global Wireless Condition Monitoring Services Market for Wireless Vibration Monitoring Services, Revenue (USD Million) 2018 – 2032 48
FIG NO. 12. Global Wireless Condition Monitoring Services Market for Wireless Temperature Monitoring Services, Revenue (USD Million) 2018 – 2032 50
FIG NO. 13. Global Wireless Condition Monitoring Services Market for Wireless Lubrication / Oil Condition Monitoring Services, Revenue (USD Million) 2018 – 2032 52
FIG NO. 14. Wireless Condition Monitoring Services Market Revenue Share, By Connectivity Technology, 2023 & 2032 55
FIG NO. 15. Market Attractiveness Analysis, By Connectivity Technology 56
FIG NO. 16. Incremental Revenue Growth Opportunity by Connectivity Technology, 2024 – 2032 56
FIG NO. 17. Wireless Condition Monitoring Services Market Revenue, By Connectivity Technology, 2018, 2023, 2027 & 2032 57
FIG NO. 18. Global Wireless Condition Monitoring Services Market for Wi-Fi-Based Monitoring Services, Revenue (USD Million) 2018 – 2032 58
FIG NO. 19. Global Wireless Condition Monitoring Services Market for Bluetooth-Enabled Monitoring Services, Revenue (USD Million) 2018 – 2032 60
FIG NO. 20. Global Wireless Condition Monitoring Services Market for Zigbee / LoRaWAN Monitoring Services, Revenue (USD Million) 2018 – 2032 62
FIG NO. 21. Global Wireless Condition Monitoring Services Market for Cellular (4G/5G) Monitoring Services, Revenue (USD Million) 2018 – 2032 64
FIG NO. 22. Global Wireless Condition Monitoring Services Market for Others, Revenue (USD Million) 2018 – 2032 66
FIG NO. 23. Wireless Condition Monitoring Services Market Revenue Share, By End-Use Industry, 2023 & 2032 69
FIG NO. 24. Market Attractiveness Analysis, By End-Use Industry 70
FIG NO. 25. Incremental Revenue Growth Opportunity by End-Use Industry, 2024 – 2032 70
FIG NO. 26. Wireless Condition Monitoring Services Market Revenue, By End-Use Industry, 2018, 2023, 2027 & 2032 71
FIG NO. 27. Global Wireless Condition Monitoring Services Market for Oil & Gas, Revenue (USD Million) 2018 – 2032 72
FIG NO. 28. Global Wireless Condition Monitoring Services Market for Power Generation & Utilities, Revenue (USD Million) 2018 – 2032 74
FIG NO. 29. Global Wireless Condition Monitoring Services Market for Manufacturing, Revenue (USD Million) 2018 – 2032 76
FIG NO. 30. Global Wireless Condition Monitoring Services Market for Automotive, Revenue (USD Million) 2018 – 2032 78
FIG NO. 31. Global Wireless Condition Monitoring Services Market for Mining & Metals, Revenue (USD Million) 2018 – 2032 80
FIG NO. 32. Global Wireless Condition Monitoring Services Market for Others, Revenue (USD Million) 2018 – 2032 82
FIG NO. 33. Global Wireless Condition Monitoring Services Market Revenue Share, By Region, 2023 & 2032 85
FIG NO. 34. Market Attractiveness Analysis, By Region 86
FIG NO. 35. Incremental Revenue Growth Opportunity by Region, 2024 – 2032 86
FIG NO. 36. Wireless Condition Monitoring Services Market Revenue, By Region, 2018, 2023, 2027 & 2032 87
FIG NO. 37. North America Wireless Condition Monitoring Services Market Revenue, 2018 – 2032 (USD Million) 93
FIG NO. 38. Europe Wireless Condition Monitoring Services Market Revenue, 2018 – 2032 (USD Million) 99
FIG NO. 39. Asia Pacific Wireless Condition Monitoring Services Market Revenue, 2018 – 2032 (USD Million) 105
FIG NO. 40. Latin America Wireless Condition Monitoring Services Market Revenue, 2018 – 2032 (USD Million) 111
FIG NO. 41. Middle East Wireless Condition Monitoring Services Market Revenue, 2018 – 2032 (USD Million) 117
FIG NO. 42. Africa Wireless Condition Monitoring Services Market Revenue, 2018 – 2032 (USD Million) 123
List of Tables
TABLE NO. 1. : Global Wireless Condition Monitoring Services Market: Snapshot 28
TABLE NO. 2. : Drivers for the Wireless Condition Monitoring Services Market: Impact Analysis 32
TABLE NO. 3. : Restraints for the Wireless Condition Monitoring Services Market: Impact Analysis 34
TABLE NO. 4. : Global Wireless Vibration Monitoring Services Wireless Condition Monitoring Services Market Revenue, By Region, 2018 – 2023 (USD Million) 49
TABLE NO. 5. : Global Wireless Vibration Monitoring Services Wireless Condition Monitoring Services Market Revenue, By Region, 2024 – 2032 (USD Million) 49
TABLE NO. 6. : Global Wireless Temperature Monitoring Services Wireless Condition Monitoring Services Market Revenue, By Region, 2018 – 2023 (USD Million) 51
TABLE NO. 7. : Global Wireless Temperature Monitoring Services Wireless Condition Monitoring Services Market Revenue, By Region, 2024 – 2032 (USD Million) 51
TABLE NO. 8. : Global Wireless Lubrication / Oil Condition Monitoring Services Wireless Condition Monitoring Services Market Revenue, By Region, 2018 – 2023 (USD Million) 53
TABLE NO. 9. : Global Wireless Lubrication / Oil Condition Monitoring Services Wireless Condition Monitoring Services Market Revenue, By Region, 2024 – 2032 (USD Million) 53
TABLE NO. 10. : Global Wi-Fi-Based Monitoring Services Wireless Condition Monitoring Services Market Revenue, By Region, 2018 – 2023 (USD Million) 59
TABLE NO. 11. : Global Wi-Fi-Based Monitoring Services Wireless Condition Monitoring Services Market Revenue, By Region, 2024 – 2032 (USD Million) 59
TABLE NO. 12. : Global Bluetooth-Enabled Monitoring Services Wireless Condition Monitoring Services Market Revenue, By Region, 2018 – 2023 (USD Million) 61
TABLE NO. 13. : Global Bluetooth-Enabled Monitoring Services Wireless Condition Monitoring Services Market Revenue, By Region, 2024 – 2032 (USD Million) 61
TABLE NO. 14. : Global Zigbee / LoRaWAN Monitoring Services Wireless Condition Monitoring Services Market Revenue, By Region, 2018 – 2023 (USD Million) 63
TABLE NO. 15. : Global Zigbee / LoRaWAN Monitoring Services Wireless Condition Monitoring Services Market Revenue, By Region, 2024 – 2032 (USD Million) 63
TABLE NO. 16. : Global Cellular (4G/5G) Monitoring Services Wireless Condition Monitoring Services Market Revenue, By Region, 2018 – 2023 (USD Million) 65
TABLE NO. 17. : Global Cellular (4G/5G) Monitoring Services Wireless Condition Monitoring Services Market Revenue, By Region, 2024 – 2032 (USD Million) 65
TABLE NO. 18. : Global Others Wireless Condition Monitoring Services Market Revenue, By Region, 2018 – 2023 (USD Million) 67
TABLE NO. 19. : Global Others Wireless Condition Monitoring Services Market Revenue, By Region, 2024 – 2032 (USD Million) 67
TABLE NO. 20. : Global Oil & Gas Wireless Condition Monitoring Services Market Revenue, By Region, 2018 – 2023 (USD Million) 73
TABLE NO. 21. : Global Oil & Gas Wireless Condition Monitoring Services Market Revenue, By Region, 2024 – 2032 (USD Million) 73
TABLE NO. 22. : Global Power Generation & Utilities Wireless Condition Monitoring Services Market Revenue, By Region, 2018 – 2023 (USD Million) 75
TABLE NO. 23. : Global Power Generation & Utilities Wireless Condition Monitoring Services Market Revenue, By Region, 2024 – 2032 (USD Million) 75
TABLE NO. 24. : Global Manufacturing Wireless Condition Monitoring Services Market Revenue, By Region, 2018 – 2023 (USD Million) 77
TABLE NO. 25. : Global Manufacturing Wireless Condition Monitoring Services Market Revenue, By Region, 2024 – 2032 (USD Million) 77
TABLE NO. 26. : Global Automotive Wireless Condition Monitoring Services Market Revenue, By Region, 2018 – 2023 (USD Million) 79
TABLE NO. 27. : Global Automotive Wireless Condition Monitoring Services Market Revenue, By Region, 2024 – 2032 (USD Million) 79
TABLE NO. 28. : Global Mining & Metals Wireless Condition Monitoring Services Market Revenue, By Region, 2018 – 2023 (USD Million) 81
TABLE NO. 29. : Global Mining & Metals Wireless Condition Monitoring Services Market Revenue, By Region, 2024 – 2032 (USD Million) 81
TABLE NO. 30. : Global Others Wireless Condition Monitoring Services Market Revenue, By Region, 2018 – 2023 (USD Million) 83
TABLE NO. 31. : Global Others Wireless Condition Monitoring Services Market Revenue, By Region, 2024 – 2032 (USD Million) 83
TABLE NO. 32. : Global Wireless Condition Monitoring Services Market Revenue, By Region, 2018 – 2023 (USD Million) 88
TABLE NO. 33. : Global Wireless Condition Monitoring Services Market Revenue, By Region, 2024 – 2032 (USD Million) 88
TABLE NO. 34. : Global Wireless Condition Monitoring Services Market Revenue, By Monitoring Parameter, 2018 – 2023 (USD Million) 89
TABLE NO. 35. : Global Wireless Condition Monitoring Services Market Revenue, By Monitoring Parameter, 2024 – 2032 (USD Million) 89
TABLE NO. 36. : Global Wireless Condition Monitoring Services Market Revenue, By Connectivity Technology, 2018 – 2023 (USD Million) 90
TABLE NO. 37. : Global Wireless Condition Monitoring Services Market Revenue, By Connectivity Technology, 2024 – 2032 (USD Million) 91
TABLE NO. 38. : Global Wireless Condition Monitoring Services Market Revenue, By End-Use Industry, 2018 – 2023 (USD Million) 92
TABLE NO. 39. : Global Wireless Condition Monitoring Services Market Revenue, By End-Use Industry, 2024 – 2032 (USD Million) 92
TABLE NO. 40. : North America Wireless Condition Monitoring Services Market Revenue, By Country, 2018 – 2023 (USD Million) 94
TABLE NO. 41. : North America Wireless Condition Monitoring Services Market Revenue, By Country, 2024 – 2032 (USD Million) 94
TABLE NO. 42. : North America Wireless Condition Monitoring Services Market Revenue, By Monitoring Parameter, 2018 – 2023 (USD Million) 95
TABLE NO. 43. : North America Wireless Condition Monitoring Services Market Revenue, By Monitoring Parameter, 2024 – 2032 (USD Million) 95
TABLE NO. 44. : North America Wireless Condition Monitoring Services Market Revenue, By Connectivity Technology, 2018 – 2023 (USD Million) 96
TABLE NO. 45. : North America Wireless Condition Monitoring Services Market Revenue, By Connectivity Technology, 2024 – 2032 (USD Million) 96
TABLE NO. 46. : North America Wireless Condition Monitoring Services Market Revenue, By End-Use Industry, 2018 – 2023 (USD Million) 97
TABLE NO. 47. : North America Wireless Condition Monitoring Services Market Revenue, By End-Use Industry, 2024 – 2032 (USD Million) 97
TABLE NO. 48. : Europe Wireless Condition Monitoring Services Market Revenue, By Country, 2018 – 2023 (USD Million) 100
TABLE NO. 49. : Europe Wireless Condition Monitoring Services Market Revenue, By Country, 2024 – 2032 (USD Million) 100
TABLE NO. 50. : Europe Wireless Condition Monitoring Services Market Revenue, By Monitoring Parameter, 2018 – 2023 (USD Million) 101
TABLE NO. 51. : Europe Wireless Condition Monitoring Services Market Revenue, By Monitoring Parameter, 2024 – 2032 (USD Million) 101
TABLE NO. 52. : Europe Wireless Condition Monitoring Services Market Revenue, By Connectivity Technology, 2018 – 2023 (USD Million) 102
TABLE NO. 53. : Europe Wireless Condition Monitoring Services Market Revenue, By Connectivity Technology, 2024 – 2032 (USD Million) 102
TABLE NO. 54. : Europe Wireless Condition Monitoring Services Market Revenue, By End-Use Industry, 2018 – 2023 (USD Million) 103
TABLE NO. 55. : Europe Wireless Condition Monitoring Services Market Revenue, By End-Use Industry, 2024 – 2032 (USD Million) 103
TABLE NO. 56. : Asia Pacific Wireless Condition Monitoring Services Market Revenue, By Country, 2018 – 2023 (USD Million) 106
TABLE NO. 57. : Asia Pacific Wireless Condition Monitoring Services Market Revenue, By Country, 2024 – 2032 (USD Million) 106
TABLE NO. 58. : Asia Pacific Wireless Condition Monitoring Services Market Revenue, By Monitoring Parameter, 2018 – 2023 (USD Million) 107
TABLE NO. 59. : Asia Pacific Wireless Condition Monitoring Services Market Revenue, By Monitoring Parameter, 2024 – 2032 (USD Million) 107
TABLE NO. 60. : Asia Pacific Wireless Condition Monitoring Services Market Revenue, By Connectivity Technology, 2018 – 2023 (USD Million) 108
TABLE NO. 61. : Asia Pacific Wireless Condition Monitoring Services Market Revenue, By Connectivity Technology, 2024 – 2032 (USD Million) 108
TABLE NO. 62. : Asia Pacific Wireless Condition Monitoring Services Market Revenue, By End-Use Industry, 2018 – 2023 (USD Million) 109
TABLE NO. 63. : Asia Pacific Wireless Condition Monitoring Services Market Revenue, By End-Use Industry, 2024 – 2032 (USD Million) 109
TABLE NO. 64. : Latin America Wireless Condition Monitoring Services Market Revenue, By Country, 2018 – 2023 (USD Million) 112
TABLE NO. 65. : Latin America Wireless Condition Monitoring Services Market Revenue, By Country, 2024 – 2032 (USD Million) 112
TABLE NO. 66. : Latin America Wireless Condition Monitoring Services Market Revenue, By Monitoring Parameter, 2018 – 2023 (USD Million) 113
TABLE NO. 67. : Latin America Wireless Condition Monitoring Services Market Revenue, By Monitoring Parameter, 2024 – 2032 (USD Million) 113
TABLE NO. 68. : Latin America Wireless Condition Monitoring Services Market Revenue, By Connectivity Technology, 2018 – 2023 (USD Million) 114
TABLE NO. 69. : Latin America Wireless Condition Monitoring Services Market Revenue, By Connectivity Technology, 2024 – 2032 (USD Million) 114
TABLE NO. 70. : Latin America Wireless Condition Monitoring Services Market Revenue, By End-Use Industry, 2018 – 2023 (USD Million) 115
TABLE NO. 71. : Latin America Wireless Condition Monitoring Services Market Revenue, By End-Use Industry, 2024 – 2032 (USD Million) 115
TABLE NO. 72. : Middle East Wireless Condition Monitoring Services Market Revenue, By Country, 2018 – 2023 (USD Million) 118
TABLE NO. 73. : Middle East Wireless Condition Monitoring Services Market Revenue, By Country, 2024 – 2032 (USD Million) 118
TABLE NO. 74. : Middle East Wireless Condition Monitoring Services Market Revenue, By Monitoring Parameter, 2018 – 2023 (USD Million) 119
TABLE NO. 75. : Middle East Wireless Condition Monitoring Services Market Revenue, By Monitoring Parameter, 2024 – 2032 (USD Million) 119
TABLE NO. 76. : Middle East Wireless Condition Monitoring Services Market Revenue, By Connectivity Technology, 2018 – 2023 (USD Million) 120
TABLE NO. 77. : Middle East Wireless Condition Monitoring Services Market Revenue, By Connectivity Technology, 2024 – 2032 (USD Million) 120
TABLE NO. 78. : Middle East Wireless Condition Monitoring Services Market Revenue, By End-Use Industry, 2018 – 2023 (USD Million) 121
TABLE NO. 79. : Middle East Wireless Condition Monitoring Services Market Revenue, By End-Use Industry, 2024 – 2032 (USD Million) 121
TABLE NO. 80. : Africa Wireless Condition Monitoring Services Market Revenue, By Country, 2018 – 2023 (USD Million) 124
TABLE NO. 81. : Africa Wireless Condition Monitoring Services Market Revenue, By Country, 2024 – 2032 (USD Million) 124
TABLE NO. 82. : Africa Wireless Condition Monitoring Services Market Revenue, By Monitoring Parameter, 2018 – 2023 (USD Million) 125
TABLE NO. 83. : Africa Wireless Condition Monitoring Services Market Revenue, By Monitoring Parameter, 2024 – 2032 (USD Million) 125
TABLE NO. 84. : Africa Wireless Condition Monitoring Services Market Revenue, By Connectivity Technology, 2018 – 2023 (USD Million) 126
TABLE NO. 85. : Africa Wireless Condition Monitoring Services Market Revenue, By Connectivity Technology, 2024 – 2032 (USD Million) 126
TABLE NO. 86. : Africa Wireless Condition Monitoring Services Market Revenue, By End-Use Industry, 2018 – 2023 (USD Million) 127
TABLE NO. 87. : Africa Wireless Condition Monitoring Services Market Revenue, By End-Use Industry, 2024 – 2032 (USD Million) 127