
Market Overview
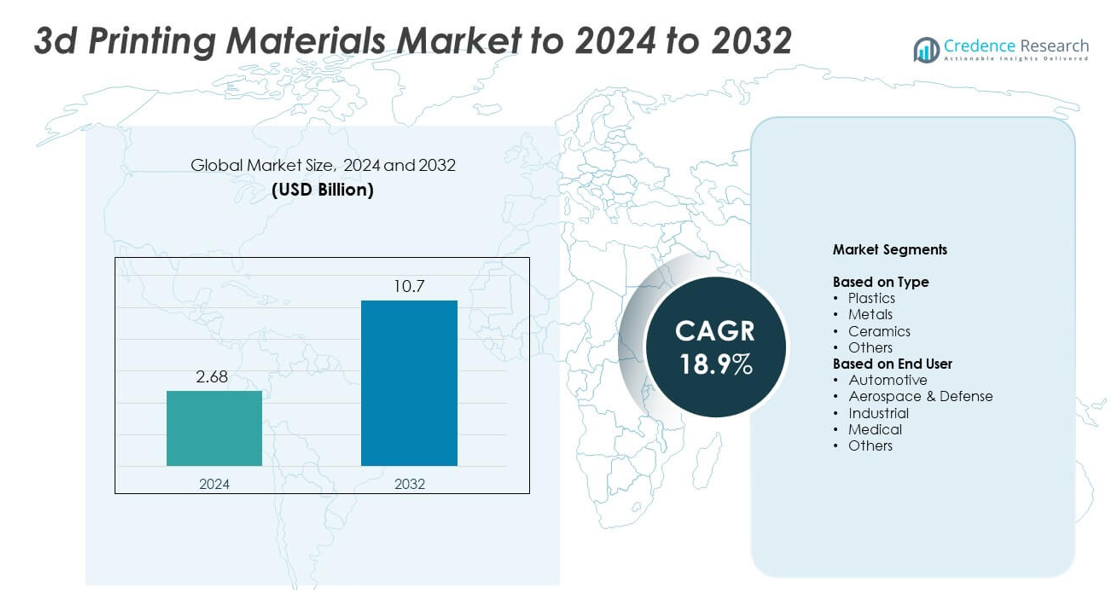
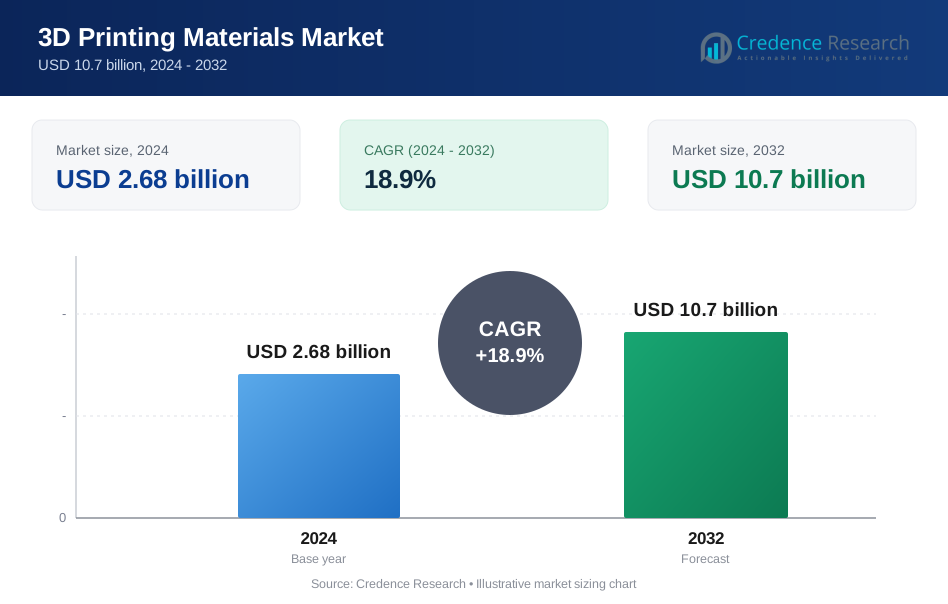
3d Printing Materials Market size was valued at USD 2.68 billion in 2024 and is anticipated to reach USD 10.7 billion by 2032, at a CAGR of 18.9% during the forecast period.
| REPORT ATTRIBUTE | DETAILS |
|---|---|
| Historical Period | 2020-2023 |
| Base Year | 2024 |
| Forecast Period | 2025-2032 |
| 3D Printing Materials MarketSize 2024 | USD 2.68 billion |
| 3D Printing Materials Market, CAGR | 18.9% |
| 3D Printing Materials Market Size 2032 | USD 10.7 billion |
The 3d Printing Materials Market is driven by leading companies including CRP Technology, Markforged, ExOne, Arkema, Stratasys Ltd., GE Additive, Materialise NV, EOS GmbH, 3D Systems, Inc., and Höganäs AB. These players strengthen the market through advanced polymers, metal powders, and composite materials designed for industrial, medical, aerospace, and automotive use. North America led the global market in 2024 with about 38% share, supported by strong R&D activity and early adoption of additive manufacturing. Europe followed with nearly 30% share, while Asia Pacific accounted for about 26% due to rapid industrial expansion and rising technological investment.
Market Insights
- The 3d Printing Materials Market was valued at USD 2.68 billion in 2024 and is projected to reach USD 10.7 billion by 2032, growing at a CAGR of 18.9%.
- Strong demand for polymers and metal powders drives growth as industries adopt additive manufacturing for faster prototyping and functional part production, with plastics holding about 52% share in 2024.
- Trends include rising use of sustainable materials, growing adoption of multi-material printing, and expanding applications in medical implants, dental devices, and aerospace components.
- Competition intensifies as global players expand material portfolios, invest in high-performance composites, and strengthen supply chains to meet industrial demand across emerging sectors.
- Regionally, North America led with about 38% share in 2024, followed by Europe at nearly 30% and Asia Pacific at around 26%, supported by rapid industrialization and strong uptake in automotive, aerospace, and healthcare applications.
Market Segmentation Analysis:
By Type
Plastics dominated the 3D Printing Materials Market in 2024 with about 52% share. Demand stayed high due to strong use in prototyping, tooling, and lightweight part production across automotive and consumer goods. Plastics such as PLA, ABS, and nylon remained popular because they deliver low cost, easy printability, and wide compatibility with desktop and industrial printers. Metal materials continued to gain traction as industries adopted high-strength alloys for functional parts, while ceramics and other specialty materials grew in niche applications that require heat resistance or precision shaping.
- For instance, HP users produced over 10,000,000 parts in one year with Multi Jet Fusion, by the year 2019
By End User
Automotive led the end-user segment in 2024 with nearly 34% share of the 3D Printing Materials Market. Carmakers used these materials widely to support rapid prototyping, custom tooling, and lightweight component production. Growth accelerated as manufacturers shifted toward shorter design cycles and higher adoption of electric vehicle platforms. Aerospace and defense expanded steadily with rising demand for high-performance metal powders, while medical applications grew due to greater use of biocompatible polymers for implants, dental parts, and patient-specific devices. Industrial applications advanced through increased adoption of additive manufacturing for small-batch parts.
- For instance, the BMW Group produced more than 400,000 3D-printed components for vehicles and production aids across its global manufacturing network in 2023.
Key Growth Drivers
Rising Adoption in Industrial Manufacturing
Growing use of additive manufacturing in industrial production supports strong demand for 3D printing materials. Manufacturers prefer polymers, metals, and composites to shorten design cycles and reduce tooling needs. Industrial firms benefit from faster prototyping, improved customization, and lower waste. Expanding use of lightweight parts in machinery and electronic equipment boosts material consumption. Broader availability of high-performance materials encourages deeper integration of 3D printing into factory workflows, strengthening overall market expansion.
- For instance, GE Aviation manufactured 100,000 additively produced fuel nozzle tips at its Auburn plant.
Expansion of Healthcare and Medical Applications
Healthcare providers increasingly rely on 3D printing for surgical guides, implants, dental products, and patient-specific models. Demand for biocompatible polymers and metal powders rises with the growth of personalized treatment. Medical device companies adopt additive manufacturing to enhance precision and reduce production time. Advancements in materials for bio-resorbable structures and prosthetics further support sector growth. Hospitals and clinics integrate 3D printing labs to improve outcomes, boosting material usage.
- For instance, Align Technology prints about 1,000,000 unique Invisalign aligner parts every single day.
Growth of Metal Additive Manufacturing
Metal 3D printing accelerates across aerospace, defense, and automotive due to the need for strong, lightweight, and complex components. Adoption expands as metal powders become more affordable and reliable. High-strength alloys such as titanium and aluminum gain traction for critical applications. Industries value improved durability and design freedom, which enhances production efficiency. Increasing certification standards and wider machine compatibility drive steady demand for advanced metal materials.
Key Trends and Opportunities
Shift Toward Sustainable and Bio-Based Materials
Producers invest in bio-based polymers and recyclable materials to meet sustainability goals. Demand grows as industries adopt greener production methods and stricter environmental rules. Research focuses on biodegradable filaments and recycled composites. Companies explore low-carbon materials for consumer goods and packaging prototypes. Rising awareness of environmental impact boosts long-term opportunities in eco-friendly 3D printing resources.
- For instance, BASF showcased a 3D-printed surfboard concept created by the French startup YUYO that utilized Ultrafuse rPET filament, a material made from 100% recycled medical waste (specifically PET from surgical trays).
Advancements in High-Performance Composites
High-performance composite materials gain momentum as industries seek greater strength-to-weight ratios. Composites that combine polymers with carbon fiber or glass fiber support advanced applications in aerospace, automotive, and sports equipment. These materials enable high precision and structural stability in demanding environments. Increased R&D investment expands options for heat-resistant and durable composites. Their rising availability boosts adoption in functional, end-use parts.
- For instance, Markforged customers have printed more than 10,000,000 parts on its Digital Forge platform.
Growing Adoption of Multi-Material Printing
Multi-material printing creates complex structures with improved performance, pushing demand for compatible materials. Industries use hybrid combinations of polymers, metals, and elastomers to design advanced prototypes and functional assemblies. This trend increases design flexibility and supports intricate geometries. Machine manufacturers expand support for multi-material capabilities. Wider industrial use opens opportunities for specialized material blends.
Key Challenges
High Material Costs
The cost of advanced filaments, powders, and resins remains a major barrier for many companies. Metal powders and engineering-grade polymers often require strict production controls, which increase prices. High material costs limit adoption among small manufacturers and educational institutions. Industries with tight budgets face difficulty scaling additive manufacturing. Reducing costs through improved supply chains and greater production volumes remains a key need.
Quality and Performance Consistency Issues
Ensuring consistent material quality creates challenges across end-use industries. Variations in powder size, polymer composition, or moisture content can affect part accuracy. Companies must invest in strict testing and certification to meet performance demands. Inconsistent material behavior reduces reliability for mission-critical applications in aerospace and healthcare. Improved standards and better material tracking systems are needed to enhance confidence in large-scale production.
Regional Analysis
North America
North America held about 38% share of the 3D Printing Materials Market in 2024 due to strong adoption across automotive, aerospace, medical, and industrial sectors. The region benefits from advanced manufacturing ecosystems, high R&D funding, and strong presence of material developers. Demand rises as companies expand use of polymers, composites, and metal powders for functional parts and prototyping. Growth accelerates with wider adoption of additive production in medical implants and aerospace components. Supportive government programs and early technology acceptance continue to strengthen the region’s leadership position.
Europe
Europe accounted for nearly 30% share of the 3D Printing Materials Market in 2024, supported by strong demand from automotive, aerospace, dental, and industrial manufacturing. Countries such as Germany, the UK, and France lead due to advanced engineering capabilities and increasing investment in additive manufacturing research. European firms focus on high-performance polymers, metal powders, and sustainable materials that align with strict regulatory standards. Expanding applications in medical devices and customized industrial parts boost regional growth. Supportive digitalization initiatives and strong innovation output reinforce Europe’s solid market position.
Asia Pacific
Asia Pacific captured around 26% share of the 3D Printing Materials Market in 2024, driven by rapid industrial expansion across China, Japan, South Korea, and India. Rising adoption in electronics, automotive, healthcare, and consumer goods fuels strong material demand. Regional manufacturers focus on cost-effective polymers, metal powders, and composite materials as production volumes increase. Government-backed digital manufacturing programs accelerate adoption across small and mid-sized enterprises. Growing aerospace investment and expanding medical device production strengthen long-term growth prospects. The region’s large manufacturing base positions Asia Pacific as the fastest-growing market.
Latin America
Latin America held roughly 4% share of the 3D Printing Materials Market in 2024, with growing adoption in automotive, healthcare, and small-scale industrial manufacturing. Countries such as Brazil and Mexico lead due to expanding production capabilities and rising interest in rapid prototyping. Demand increases for affordable polymers and basic metal materials as local firms integrate additive manufacturing for design flexibility. Growth remains steady as universities and research centers support technology development. Improved access to 3D printing systems and training programs strengthens regional uptake over the forecast period.
Middle East & Africa
Middle East & Africa accounted for about 2% share of the 3D Printing Materials Market in 2024, driven by emerging use in construction, healthcare, and industrial tooling. Growth concentrates in the UAE, Saudi Arabia, and South Africa as these nations invest in digital manufacturing. Demand rises for polymers, resins, and metal powders as sectors adopt additive production for customized parts and prototype development. Government initiatives in smart manufacturing support technology expansion. Although market size remains small, increasing industrial diversification strengthens long-term adoption across the region.
Market Segmentations:
By Type
- Plastics
- Metals
- Ceramics
- Others
By End User
- Automotive
- Aerospace & Defense
- Industrial
- Medical
- Others
By Geography
- North America
- U.S.
- Canada
- Mexico
- Europe
- Germany
- France
- U.K.
- Italy
- Spain
- Rest of Europe
- Asia Pacific
- China
- Japan
- India
- South Korea
- South-east Asia
- Rest of Asia Pacific
- Latin America
- Brazil
- Argentina
- Rest of Latin America
- Middle East & Africa
- GCC Countries
- South Africa
- Rest of the Middle East and Africa
Competitive Landscape
The 3D Printing Materials Market is shaped by major players such as CRP Technology, Markforged, ExOne, Arkema, Stratasys, GE Additive, Materialise, EOS, 3D Systems, and Höganäs AB. The competitive landscape reflects strong focus on advanced polymers, metal powders, composite blends, and high-performance resins tailored for industrial, aerospace, medical, and automotive applications. Companies invest heavily in research to improve strength, heat resistance, and reliability of materials used in both prototyping and end-use parts. Firms expand production capacity and global distribution networks to meet rising demand across emerging and developed markets. Partnerships with printer manufacturers, research institutes, and industrial clients help broaden material compatibility and accelerate adoption. Continuous innovations in recyclable materials, sustainable formulations, and multi-material capabilities strengthen overall competitiveness.
Key Player Analysis
- CRP Technology
- Markforged, Inc.
- ExOne
- Arkema
- Stratasys Ltd.
- GE Additive
- Materialise NV
- EOS GmbH
- 3D Systems, Inc.
- Höganäs AB
Recent Developments
- In 2024, Materialise announced software enhancements for its Magics software that included making its algorithms available via a Software Development Kit (SDK) to enable customer-tailored 3D printing workflows for better quality and efficiency.
- In 2024, Markforged upgraded its FX10 printer to enable 3D printing of both metal and advanced composite materials, expanding material versatility for industrial applications
- In 2023, CRP Technology Launched Windform XT 2.0 IMG, its first injection molding material made entirely from recycled Windform XT 2.0 industrial 3D printing materials to enhance sustainability.
Report Coverage
The research report offers an in-depth analysis based on Type, End-User and Geography. It details leading market players, providing an overview of their business, product offerings, investments, revenue streams, and key applications. Additionally, the report includes insights into the competitive environment, SWOT analysis, current market trends, as well as the primary drivers and constraints. Furthermore, it discusses various factors that have driven market expansion in recent years. The report also explores market dynamics, regulatory scenarios, and technological advancements that are shaping the industry. It assesses the impact of external factors and global economic changes on market growth. Lastly, it provides strategic recommendations for new entrants and established companies to navigate the complexities of the market.
Future Outlook
- The 3D printing materials market will expand with wider industrial adoption.
- Demand for metal powders will rise as aerospace and automotive increase additive production.
- Bio-based and recyclable materials will gain traction due to sustainability goals.
- Medical applications will grow with higher use of biocompatible polymers and dental materials.
- Composite materials will see strong adoption for lightweight and durable components.
- Multi-material printing will create new opportunities for complex part design.
- Advancements in material certification will support greater use in critical industries.
- Automation in additive manufacturing will boost high-volume material consumption.
- Emerging economies will adopt more 3D printing materials as manufacturing shifts grow.
- Ongoing R&D will introduce advanced polymers and alloys for next-generation applications.
Request a Free Sample
Fill in your details and we'll send you a free sample report.
- Sample data tables & charts
- Research methodology
Need a Custom Version of This Report?
Tailor the scope, geography, or segments to your exact requirements.
- Custom geography or segment scope
- Direct access to our analyst team
Frequently Asked Questions
What is the current market size for 3d Printing Materials Market, and what is its projected size in 2032?
At what Compound Annual Growth Rate is the 3d Printing Materials Market projected to grow between 2025 and 2032?
What are the most not unusual substances used in three-D printing?
What are the benefits of using metallic objects in 3D printing?
What are the constraints of 3D printing substances?
Are there appropriate 3-D printing materials for medical and healthcare applications?
What are the current tendencies in 3-d printing?
Are there any safety concerns whilst working with 3D printers?
Who are the leading companies in the 3d Printing Materials Market?
Table of Content
Chapter 1. Report Introduction
- 1.1 Report Description & Purpose
- 1.1.1 Report Title & Market Definition
- 1.1.2 Unique Selling Propositions (USP) & Key Differentiators
- 1.1.3 Value Proposition for Stakeholders
- 1.2 Research Objectives
- 1.2.1 Market Sizing Objectives (Volume & Revenue) (Volume Where Applicable)
- 1.2.2 Segmentation Objectives
- 1.2.3 Competitive Intelligence Objectives
- 1.2.4 Forecast & Scenario Objectives
- 1.3 Report Scope
- 1.3.1 3D Printing Materials Scope – Segments & Subsegments Covered
- 1.3.2 Geographic Scope – Regions & Countries Covered
- 1.3.3 Historical Period, Base Year & Forecast Period (2024; forecast to 2032)
- 1.3.4 Inclusions & Exclusions
- 1.4 Industry Classification & Applicable Codes
- 1.5 Currency, Measurement Units & Valuation Basis
- 1.6 Target Stakeholders
- 1.7 Limitations & Assumptions
Chapter 2. Executive Summary
- 2.1 Global 3D Printing Materials Market Snapshot
- 2.1.1 Market Size – Historical (2024) & Forecast (2024-2032) (2024: USD 2.68 billion → 2032: USD 10.7 billion)
- 2.1.2 Volume & Revenue – Global Totals (Volume Where Applicable)
- 2.1.3 Key Market Highlights – Top Five Facts
- 2.2 3D Printing Materials Market Segmentation Snapshot
- 2.2.1 Market Split by Region – 2024 vs. 2032
- 2.3 Competitive Snapshot
- 2.3.1 Top 10 Players by Revenue Share – 2024
- 2.3.2 Top 10 Players by Volume Share – 2024 (Volume Where Applicable)
- 2.3.3 Recent Strategic Developments (18-Month Summary)
- 2.4 Key Investment Highlights & Strategic Conclusions
Chapter 3. 3D Printing Materials Market Dynamics & Industry Analysis
- 3.1 Market Overview & Context
- 3.1.1 3D Printing Materials Market Position in the Broader Industry Value Chain
- 3.1.2 Demand Structure & Purchasing Dynamics
- 3.1.3 Market Maturity & Development Stage by Region
- 3.2 3D Printing Materials Market Drivers
- 3.3 3D Printing Materials Market Restraints & Challenges
- 3.4 3D Printing Materials Market Opportunities
- 3.5 Porter's Five Forces Analysis
- 3.5.1 Threat of New Entrants
- 3.5.2 Bargaining Power of Suppliers
- 3.5.3 Bargaining Power of Buyers
- 3.5.4 Threat of Substitutes
- 3.5.5 Competitive Rivalry – Intensity Assessment
- 3.6 3D Printing Materials Value Chain Analysis
- 3.6.1 Upstream – Key Inputs, Resources & Suppliers
- 3.6.1.1 Key Input/Resource 1
- 3.6.1.2 Key Input/Resource 2
- 3.6.1.3 Key Input/Resource 3
- 3.6.2 Midstream – Core Operations & Value Creation
- 3.6.2.1 Operating Model & Process Overview
- 3.6.2.2 Key Operating Locations & Capabilities by Company
- 3.6.3 Downstream – Market Channels & End Users
- 3.6.3.1 Direct Sales & Customer Engagement Channels
- 3.6.3.2 Indirect Sales, Intermediaries & Partner Channels
- 3.6.4 Value Chain Profitability Analysis
- 3.6.1 Upstream – Key Inputs, Resources & Suppliers
- 3.7 PESTEL Analysis
- 3.7.1 Political Factors
- 3.7.2 Economic Factors
- 3.7.3 Social Factors
- 3.7.4 Technological Factors
- 3.7.5 Environmental Factors
- 3.7.6 Legal Factors
- 3.8 3D Printing Materials Supply Chain Analysis
- 3.8.1 Critical Input & Resource Availability Risk Assessment
- 3.8.2 Supplier & Operational Concentration Risk (Geographic Exposure)
- 3.8.3 Supply & Service Disruption Impact Analysis
- 3.9 Regulatory & Policy Landscape
Note: The regulatory and policy landscape section covers regulations based on their applicability to the market, 3D Printing Materials category, geography, and scope of the study. Only regulatory frameworks with a material impact on operations, compliance, trade, sustainability, or market access are analyzed in detail.
Chapter 4. Key Investment Pockets & Opportunity Analysis
- 4.1 3D Printing Materials Market Attractiveness Analysis
- 4.1.1 By Region – Investment Attractiveness Matrix (Market Size × CAGR)
- 4.2 Absolute Revenue Growth Opportunity
- 4.2.1 By Region – Absolute Revenue Growth Through 2032
- 4.3 Incremental Demand Opportunity
- 4.3.1 By Region – Incremental Demand Through 2032
- 4.3.2 Segment – Incremental Demand
- 4.4 Emerging Submarket Opportunity Deep Dive (Subject to Applicability)
- 4.5 Priority Market Opportunity Scorecards
- 4.5.1 United States
- 4.5.2 Europe
- 4.5.3 Asia
- 4.5.4 Middle East & Africa
Note: Priority market opportunity scorecards reflect the geographic scope and strategic relevance of the study. Listed markets are indicative and may be adapted to the industry.
Chapter 5. 3D Printing Materials Cross-Border Trade & Market Access Analysis
- 5.1 International Trade & Cross-Border Activity Overview
- 5.1.1 Global Export Value by Country (2024)
- 5.1.2 Global Export Volume by Country (2024) (Volume Where Applicable)
- 5.1.3 Global Import Value by Country (2024)
- 5.1.4 Global Import Volume by Country (2024) (Volume Where Applicable)
- 5.1.5 Net Trade Balance by Country (2024)
- 5.2 Export Analysis – Segment
- 5.2.1 Category 1 (Applicable Classification Code)
- 5.2.2 Category 2 (Applicable Classification Code)
- 5.2.3 Category 3 (Applicable Classification Code)
- 5.2.4 Category 4 (Applicable Classification Code)
- 5.2.5 Category 5 (Applicable Classification Code)
- 5.3 Import Analysis – Segment
- 5.3.1 Category 1 (Applicable Classification Code)
- 5.3.2 Category 2 (Applicable Classification Code)
- 5.3.3 Category 3 (Applicable Classification Code)
- 5.3.4 Category 4 (Applicable Classification Code)
- 5.3.5 Category 5 (Applicable Classification Code)
- 5.4 Cross-Border Pricing & Transaction Benchmarks
- 5.4.1 Export Pricing – Segment & Country
- 5.4.2 Import Pricing – Segment & Source Country
- 5.4.3 Price Trends (2024)
- 5.5 Key Cross-Border Trade & Delivery Routes
- 5.5.1 Cross-Border Trade/Delivery Route 1
- 5.5.2 Cross-Border Trade/Delivery Route 2
- 5.5.3 Cross-Border Trade/Delivery Route 3
- 5.5.4 Cross-Border Trade/Delivery Route 4
- 5.5.5 Cross-Border Trade/Delivery Route 5
- 5.6 Trade Policy & Market Access Impact Assessment
- 5.6.1 Tariff & Non-Tariff Barriers
- 5.6.2 Regional Trade & Economic Integration Frameworks
- 5.6.3 Bilateral & Multilateral Trade Agreements
- 5.6.4 Cross-Border Operating, Licensing & Localization Requirements
Note: This chapter applies where cross-border trade or delivery is relevant to 3D Printing Materials. Goods, services, and digital offerings are assessed using applicable classifications and transaction measures. Import-export volumes, trade balances, and route analyses are included only where meaningful to the market.
Chapter 6. Competitive Landscape & Company Benchmarking
- 6.1 3D Printing Materials Market Concentration & Structure
- 6.1.1 Herfindahl-Hirschman Index (HHI) – vs. 2024
- 6.1.2 Leading, Mid-Sized & Emerging Player Structure
- 6.1.3 Global, Regional & Local Player Dynamics
- 6.2 3D Printing Materials Market Share Analysis – 2024
- 6.2.1 Global Revenue Share by Company
- 6.2.2 Global Volume Share by Company (Volume Where Applicable)
- 6.2.3 Regional Revenue Share
- 6.2.4 Market Share Evolution ( vs. 2024)
- 6.2.5 Company Market Share by Key Segment
- 6.2.6 Company Market Share by Customer Group
- 6.3 Operating Scale, Capacity & Infrastructure Analysis
- 6.3.1 Global Operating Scale & Supply Capacity
- 6.3.2 Resource Utilization & Operating Efficiency
- 6.3.3 Output, Service Delivery & Activity Metrics
- 6.3.4 Operating Footprint & Infrastructure Map
- 6.3.5 Planned Operational & Capacity Expansion
- 6.4 3D Printing Materials Competitive Benchmarking Matrix
- 6.4.1 Revenue, Growth, Profitability & Operating Metric Comparison
- 6.4.2 Channel Revenue Mix
- 6.4.3 Geographic Revenue Exposure
- 6.4.4 R&D Intensity
- 6.4.5 Sustainability Maturity
- 6.5 Strategic Developments in 3D Printing Materials (Last 24 Months)
- 6.5.1 Mergers, Acquisitions & Divestments
- 6.5.2 New Products, Services & Solutions in 3D Printing Materials
- 6.5.3 Operational & Infrastructure Expansions
- 6.5.4 Strategic Alliances, Joint Ventures & Partnerships
- 6.5.5 Distribution Expansion & Market Entry
- 6.5.6 Sustainability & ESG Initiatives
- 6.6 Competitive Strategy Mapping
- 6.6.1 Leader, Challenger, Follower & Niche Classification
- 6.6.2 Pricing Strategy Comparison
- 6.6.3 Channel Strategy Matrix
Note: Strategic developments are included based on their materiality and the availability of reliable information.
Chapter 7. Global 3D Printing Materials Market – By Sales & Delivery Channel
- 7.1 Segment Overview
- 7.1.1 Volume & Revenue Split by Channel (2024 & 2032) (Volume Where Applicable)
- 7.1.2 Channel Mix Evolution (2024-2032)
Chapter 8. Regional Market Analysis – Global Overview
- 8.1 Global Regional Overview
- 8.1.1 Regional Volume Share (Volume Where Applicable)
- 8.1.2 Regional Revenue Share
- 8.1.3 Regional Volume by Region (Volume Where Applicable)
- 8.1.4 Regional Revenue by Region
- 8.1.5 Regional Forecast Through 2032
- 8.2 Cross-Regional Segment Analysis
- 8.2.1 By Sales & Delivery Channel
- 8.2.2 By Competitive Positioning & Price Tier
Chapter 9. North America 3D Printing Materials Market
- 9.1 United States
- 9.2 Canada
- 9.3 Mexico
Chapter 10. Europe 3D Printing Materials Market
- 10.1 Germany
- 10.2 France
- 10.3 Italy
- 10.4 United Kingdom
- 10.5 Spain
- 10.6 Poland
- 10.7 Russia
- 10.8 Netherlands
- 10.9 Belgium
- 10.10 Sweden
- 10.11 Denmark
- 10.12 Norway
- 10.13 Rest of Europe
Chapter 11. Asia Pacific 3D Printing Materials Market
- 11.1 China
- 11.2 India
- 11.3 Japan
- 11.4 South Korea
- 11.5 Thailand
- 11.6 Indonesia
- 11.7 Vietnam
- 11.8 Malaysia
- 11.9 Australia
- 11.10 Rest of Asia Pacific
Chapter 12. Latin America 3D Printing Materials Market
- 12.1 Brazil
- 12.2 Argentina
- 12.3 Colombia
- 12.4 Chile
- 12.5 Rest of Latin America
Chapter 13. Middle East 3D Printing Materials Market
- 13.1 Saudi Arabia
- 13.2 United Arab Emirates
- 13.3 Turkey
- 13.4 Israel
- 13.5 Iran
- 13.6 Rest of the Middle East
Chapter 14. Africa 3D Printing Materials Market
- 14.1 South Africa
- 14.2 Egypt
- 14.3 Nigeria
- 14.4 Morocco
- 14.5 Rest of Africa
Chapter 15. 3D Printing Materials Company Profiles
- 15.1 [Company 01]
- 15.1.1 Company Overview
- 15.1.2 Key Management Personnel
- 15.1.3 Products & Services Portfolio
- 15.1.4 Financial Performance
- 15.1.5 Key Market Focus & Geographic Presence
- 15.1.6 Recent Developments & Strategic Initiatives
Note: The company profile list is preliminary and may change based on research findings, market developments, data availability, and client requirements.
Chapter 16. Appendices
- Appendix A – List of Abbreviations & Acronyms
- Appendix B – Industry Classification Code Reference – Full Series
- Appendix C – Supply, Output & Operating Capacity Data Tables
- Appendix D – End-Use & Demand Base Tables
- Appendix E – Demand, Adoption & Usage Assumptions
- Appendix F – Pricing & Revenue Metric Reference Tables
- Appendix G – Company Operations & Infrastructure Database
- Appendix H – Cross-Border Trade & Activity Data Tables (Where Applicable)
- Appendix I – Regulatory Summary Tables
- Appendix J – Primary Research Participant List (Anonymized)
- Appendix K – Primary Research Questionnaire Framework
- Appendix L – Data Sources & Bibliography
- Appendix M – Market Size Divergence & Source Comparison
Chapter 17. Research Methodology
- 17.1 Research Framework & Philosophy
- 17.2 Secondary Research – Sources, Hierarchy & Data Extraction
- 17.3 Data Modeling – Bottom-Up & Top-Down Market Sizing
- 17.4 Primary Research – Stakeholder Framework, LOI & Sample Sizes
- 17.5 Forecast Methodology – Regression, Scenario & Sensitivity Analysis
- 17.6 Quality Control – Four-Layer Validation Framework
- 17.7 Limitations & Standard Assumptions
- 17.8 Disclaimer
