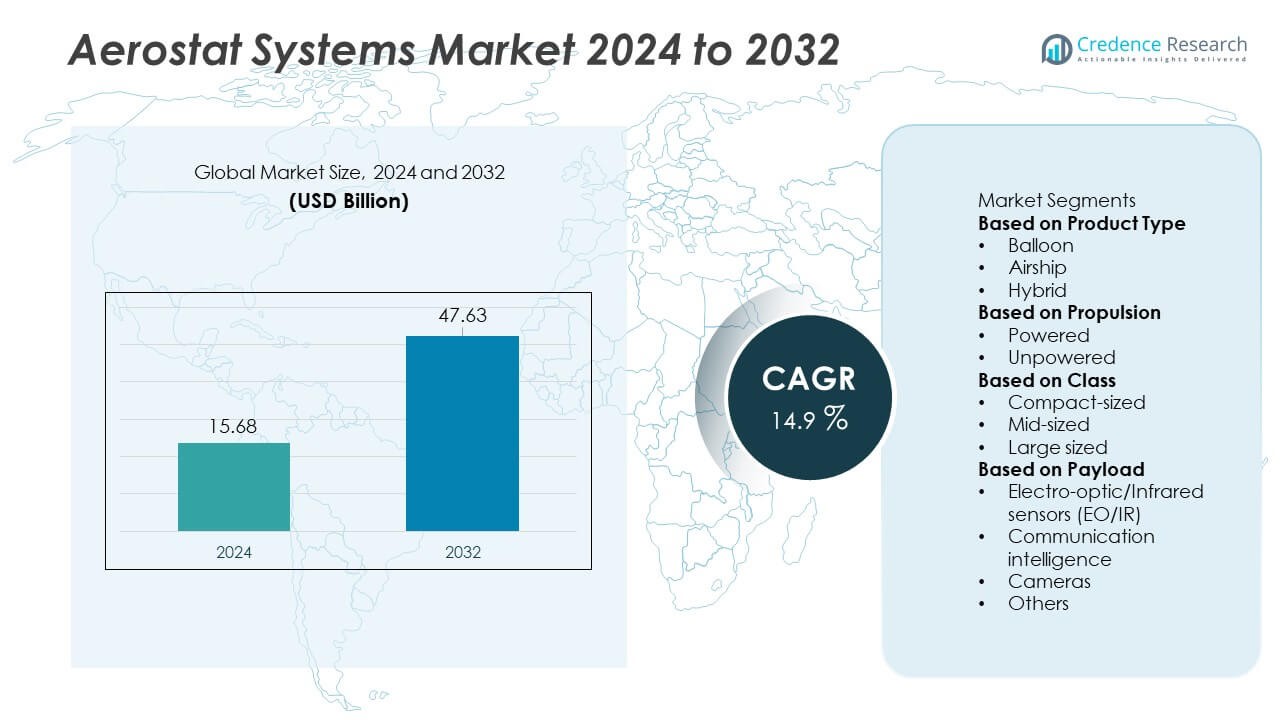
Home » Aerospace & defense » Aerostat Systems Market

Global Aerostat Systems Market By Type (Balloon, Airship, Hybrid)By Propulsion Type (Powered ,Unpowered ) Growth, Future Prospects & Competitive Analysis, 2016 – 2030

Price: $4999

Published: | Report ID: 2682 | Report Format : PDF

Key Highlights of the Report

How are the major segments performing in the Aerostat Systems market?

  • In 2022, balloon aerostat systems dominated the market due to increasing demand for surveillance and monitoring.
  • In 2022, the powered segment controlled the market, accounting for more than 60% of the total revenue. Powered aerostat systems have a better range and larger lifespan.
  • The compact-Sized segment dominated the market due to increasing demand to support intelligence activities.
  • Electro-optic/Infrared sensors (EO/IR)segment dominated the market in 2022.

How does the Market Size of Aerostat Systems regard value?

The global aerostat systems market is anticipated to grow at a substantial CAGR of 13.3% in the upcoming years. The global aerostat systems industry was estimated to be worth USD 11.5 billion in 2022 and was expected to be worth USD 27.6 million by 2028.

Design Element 2

Access crucial information at unmatched prices!

Request your free sample report today & start making informed decisions powered by Credence Research!

Download Free Sample
CTA Design Element 3

Which region dominated the aerostat systems market?

During the projection period, the Asia Pacific region is anticipated to account for a sizeable portion of the aerostat system market. This market expansion results from the increased use of aerostat systems for disaster management solutions in rising economies like China and India. Aerostat technology is primarily used in China for traffic monitoring, sensitive site surveillance, and search and rescue activities. The market expansion is also fueled by India’s rising need for aerostat systems for law enforcement and homeland security.

How is US Market Performing in the aerostat systems market?

North America was the biggest and most dominating market for aerostat systems, and it is anticipated that it will continue to dominate the market over the forecast period. The world’s biggest market for aerostat systems is the United States. The nation is concentrating on creating and acquiring these surveillance devices and employing these aerostats along the borders as a kind of border monitoring. For instance, the Programme Management Office Directorate (PMOD) of US Customs and Border Protection (CBP) built a 22-Meter Persistent Ground Surveillance System Aerostat at Nogales, Arizona, in June 2022.

How is the economy impacting the global aerostat systems market growth?

The market has been significantly impacted by the increase in inflation rates that many countries have experienced. Government agencies have cut spending on surveillance equipment and streamlined their budgets. Market liquidity may also decline. Businesses that bought products from Russia and Ukraine suffered significant losses due to the Russia-Ukraine War. Each of these elements has the potential to restrict the market growth. Covid-19’s introduction into the market severely impacted significant firms’ capital expenditures.

What is the competitive environment of the aerostat systems market?

The market for aerostat systems is only fairly fragmented, with a few key manufacturers controlling a sizable portion of it. Lockheed Martin Corporation, TCOM LP, Raven Industries, Israel Aerospace Industries Limited, and RT LTA Systems Ltd. are well-known market participants. Aerostat systems have a tonne of economic application potential, particularly in the communication sector. As a result, the relationships between aerostat makers and various commercial operators are anticipated to expand their sales and global geographic reach.

Executive Summary

What are the key trends in the Aerostat Systems market?

  • Because they have the advantage of gathering extremely accurate and real-time surveillance data at a relatively cheap total cost of ownership, aerostat systems are anticipated to be one of the viable options for purchase.
  • Aerostats are increasingly used for commercial purposes, such as internet connectivity, environmental research, and military ones. At a substantially lower cost and energy cost, aerostats are being used to extend LTE networks and 5G technology in rural places.

What is the market understanding of the Aerostat Systems Market?

An aerostat system is a high-tech, low-level, balloon-like aerial ground surveillance system that uses aerostats as radar platforms. Noncombustible helium gas is mostly utilized for lifting tethered aerostat devices. However, because it is more readily available, highly combustible, and less expensive than other gases, hydrogen gas is increasingly used in aerostat systems. Compared to unmanned aerial vehicles (UAV), the aerostat system has reduced operational costs. The market is expected to grow as aerostat systems are used more frequently to provide ongoing monitoring for homeland security.

Which are the key investments by the Aerostat Systems market players?

Major firms are adopting various inorganic growth strategies, such as joint ventures, mergers and acquisitions, and geographical expansion, to thrive in the competitive market. In May 2022, Spire Global was given a five-year, multimillion-dollar contract by TCOM, a U.S.-based intelligence, surveillance, and reconnaissance (ISR) company, to offer weather forecasts. Ten locations where TCOM operates aerostats would receive weather forecasts under the subcontract. The Israel Missile Defence Organisation (IMDO) stated in November 2021 that it was testing an aerostat equipped with a new radar that could identify long-range threats. The US business TCOM produced the High Availability Aerostat System (HAAS). The US Missile Defence Agency and Elta, a division of Israel Aerospace Industries’ main contractor, collaborated on the radar’s development.

Some major players in the aerostat systems market are Allsopp Helikites Ltd. (The UK), Exelis Inc. (The US), ILC Dover, L.P.  (The US),  Israel Aerospace Industries (Israel),  Lindstrand Technologies Limited (The UK), Lockheed Martin Corporation (The US), Raven Industries Inc. (The US), Raytheon Company (The US), Tcom L.P. (The US), among others.

What are the Major Driving Factors for the Aerostat Systems Market?

The militaries are being pushed to improve their battlefield data-sharing capabilities by factors including rising terrorism, rising territorial disputes, and border infiltrations on a global scale. Although UAVs are increasingly used for ISR missions, they cannot provide continuous wide-area observation for several days. Hence many nations have turned to aerostats as a substitute. Aerostat systems can provide ongoing observation by running continuously for days, weeks, or even months. Aerostats are increasingly used for commercial purposes, such as internet connectivity, environmental research, and military ones. At a substantially lower cost and energy cost, aerostats are being used to extend LTE networks and 5G technology in rural places.

What are the Major Risks for the Aerostat Systems Market?

However, the aerostat systems market does confront difficulties and restrictions regarding operational altitude and weather-related survival. Throughout the forecast period, these restrictions are anticipated to pose growth challenges for the market. Additionally, operational altitude restrictions are impeding market expansion.

Which is the key type in the aerostat systems market?

In 2022, the balloon segment dominated the market and accounted for the highest revenue share as balloon aerostat systems reduce fuel consumption significantly, which results in a significant difference in costs; additionally, balloon aerostat systems require fewer parts, which helps to keep the manufacturing cost low. These benefits and balloon aerostat systems’ cost-effectiveness compared to conventional surveillance aircraft systems fuel the growth of the balloon aerostat systems market.

How is the aerostat systems market performing in regions?

North America was the largest and most dominant market for aerostat systems, and it is projected to maintain its dominance during the forecast period. US is the largest market for aerostat systems in the world. The country is focusing on developing and purchasing these surveillance tools and using these aerostats as a form of border monitoring along the frontiers. For instance, the CBP Programme Management Office Directorate (PMOD) constructed a 22-Meter Persistent Ground Surveillance System Aerostat at Nogales, Arizona, in June 2022.

APAC region is predicted to dominate the aerostat system market during the projection period. The increased use of aerostat systems for disaster management strategies in developing nations like China and India has led to the growth of this industry. In China, search and rescue operations, sensitive site surveillance, and traffic monitoring are the main uses for aerostat technology. Additionally, India’s expanding need for aerostat systems for law enforcement and homeland security is fueling the market expansion.

The market is expanding significantly in Europe as well. Key firms like Allsopp Helikites Ltd. and Lindstrand Technologies Limited, among others, are said to have contributed to this rise. The growing use of aerostat systems for crowd control in the UK. It is anticipated that management, harbor monitoring, and coastal monitoring will increase the market growth. Throughout the projection period, the rest of the world experiences tremendous growth. This growth is linked to the Middle East and Africa’s and South America’s growing usage of aerostat systems for international border protection.

Shape Your Report to Specific Countries or Regions & Enjoy 30% Off!

What are the major players planning for the future of the aerostat systems market?

By integrating cutting-edge sensors, aerostat system producers are boosting their current aerostat capabilities. Unmanned aerostats, for example, are anticipated to determine the future of the aerostat sector, and participants are anticipated to include such technology in their upcoming products. Additionally, it is predicted that doing this will aid the businesses in gaining contracts from new clients and expanding their market share.

REPORT ATTRIBUTE DETAILS
Aerostat Systems Market by Volume Yes
Aerostat Systems Market by Value Yes
Aerostat Systems Market, Tornado Analysis Yes
Aerostat Systems Market, STAR Analysis Yes
Aerostat Systems Market, SRC Analysis Yes
Aerostat Systems Market, Import-Export Data Yes (On Demand)
Aerostat Systems Market Pricing Analysis Yes (On Demand)
Aerostat Systems Market Segment Analysis By Type (Balloon, Airship and Hybrid)

By Propulsion System (Powered and Unpowered)

By Class (Compact-sized, Mid-sized and Large sized)

By Payload (Electro-optic/Infrared sensors (EO/IR), Communication Intelligence, Cameras, Electronic intelligence, Surveillance radar, Inertial navigation system)

Aerostat Systems Market, Regional Analysis Europe (Germany, Spain, UK, France, Italy, and Rest of Europe)

North America (US and Canada)

Latin America (Mexico, Brazil, and Rest of Latin America)

Asia Pacific (South Korea, South East Asia, China, India, Japan, and Rest of Asia Pacific)

Middle East and Africa (South Africa, GCC Countries, and Rest of Middle East and Africa)

Aerostat Systems Market Key Companies Allsopp Helikites Ltd. (The UK), Exelis Inc. (The US), ILC Dover, L.P.  (The US),  Israel Aerospace Industries (Israel),  Lindstrand Technologies Limited (The UK), Lockheed Martin Corporation (The US), Raven Industries Inc. (The US), Raytheon Company (The US), Tcom L.P. (The US), among others.
Aerostat Systems Market Competitive Landscape Market Share Analysis

Competitive Benchmarking

Key Players Market Positioning

Geographical Presence Analysis

Major Strategies Adopted

Segmentation of Global Aerostat Systems Market-

Global Aerostat Systems Market – By Type

  • Balloon
  • Airship
  • Hybrid

Global Aerostat Systems Market – By Propulsion Type

  • Powered
  • Unpowered

Global Aerostat Systems Market – By Class

  • Compact-sized
  • Mid-sized
  • Large sized

Global Aerostat Systems Market – By Payload

  • Electro-optic/Infrared sensors (EO/IR)
  • Communication Intelligence
  • Cameras
  • Electronic intelligence
  • Surveillance radar
  • Inertial navigation system

Global Aerostat Systems Market – By Region

  • North America
    • US
    • Canada
  • Europe
    • Germany
    • France
    • U.K.
    • Italy
    • Spain
    • Rest of Europe
  • Asia Pacific
    • China
    • Japan
    • India
    • South Korea
    • South-east Asia
    • Rest of Asia Pacific
  • Latin America
    • Brazil
    • Mexico
    • Rest of Latin America
  • Middle East & Africa
    • GCC Countries
    • South Africa
    • Rest of Middle East and Africa

1. Preface
1.1. Report Description
1.1.1. Purpose of the Report
1.1.2. Target Audience
1.1.3. USP and Key Offerings
1.2. Research Scope
1.3. Research Methodology
1.3.1. Phase I – Secondary Research
1.3.2. Phase II – Primary Research
1.3.3. Phase III – Expert Panel Review
1.3.4. Approach Adopted
1.3.4.1. Top-Down Approach
1.3.4.2. Bottom-Up Approach
1.3.5. Assumptions
1.4. Market Introduction
1.5. Market Research Scope

2. Executive Summary
2.1. Market Snapshot: Aerostat Systems Market
2.2. Aerostat Systems Market, By Type
2.3. Aerostat Systems Market, By Propulsion System
2.4. Aerostat Systems Market, By Class
2.5. Aerostat Systems Market, By Payload
2.6. Aerostat Systems Market, By Region

3. Market Dynamics & Factors Analysis
3.1. Introduction
3.1.1. Aerostat Systems Market Value, 2017-2030, (US$ Bn)
3.1.2. Y-o-Y Growth Trend Analysis
3.2. Market Dynamics
3.2.1. Market Drivers
3.2.2. Market Restraints
3.2.3. Market Opportunities
3.2.4. Major Industry Challenges
3.3. Growth and Development Patterns
3.4. Investment Feasibility Analysis
3.5. Market Opportunity Analysis
3.5.1. Type
3.5.2. Propulsion System
3.5.3. Class
3.5.4. Payload
3.5.5. Geography

4. Premium Insights
4.1. STAR (Situation, Task, Action, Results) Analysis
4.2. Porter’s Five Forces Analysis
4.2.1. Threat of New Entrants
4.2.2. Bargaining Power of Buyers/Consumers
4.2.3. Bargaining Power of Suppliers
4.2.4. Threat of Substitute Types
4.2.5. Intensity of Competitive Rivalry
4.3. Key Market Trends
4.3.1. Demand Side Trends
4.3.2. Supply Side Trends
4.4. Value Chain Analysis
4.5. Technology Analysis
4.6. Analysis and Recommendations
4.7. Marketing Strategy Analysis
4.7.1. Direct Marketing
4.7.2. Indirect Marketing
4.7.3. Marketing Channel Development Trend

5. Market Positioning of Key Players, 2022
5.1. Company market share of key players, 2022
5.2. Competitive Benchmarking
5.3. Market Positioning of Key Vendors
5.4. Geographical Presence Analysis
5.5. Major Strategies Adopted by Key Players
5.5.1. Key Strategies Analysis
5.5.2. Mergers and Acquisitions
5.5.3. Partnerships
5.5.4. Product Launch
5.5.5. Geographical Expansion
5.5.6. Others

6. Economic Impact Analysis
6.1. Recession Impact
6.1.1. North America
6.1.2. Europe
6.1.3. Asia Pacific
6.1.4. Latin America
6.1.5. Middle East and Africa
6.2. Ukraine-Russia War Impact
6.2.1. North America
6.2.2. Europe
6.2.3. Asia Pacific
6.2.4. Latin America
6.2.5. Middle East and Africa
6.3. COVID-19 Impact Analysis
6.3.1. North America
6.3.2. Europe
6.3.3. Asia Pacific
6.3.4. Latin America
6.3.5. Middle East and Africa

7. Aerostat Systems Market
7.1. Aerostat Systems Market, by Type, 2017-2030(US$ Bn)
7.1.1. Overview
7.1.2. Aerostat Systems Market, By Type, 2022 vs 2030 (in%)
7.1.3. Aerostat Systems Market, By Balloon, 2017-2030 (US$ Bn)
7.1.4. Aerostat Systems Market, By Airship, 2017-2030 (US$ Bn)
7.1.5. Aerostat Systems Market, By Hybrid, 2017-2030 (US$ Bn)
7.2. Aerostat Systems Market, by Propulsion System, 2017-2030(US$ Bn)
7.2.1. Overview
7.2.2. Aerostat Systems Market, By Propulsion System, 2022 vs 2030 (in%)
7.2.3. Aerostat Systems Market, By Powered, 2017-2030 (US$ Bn)
7.2.4. Aerostat Systems Market, By Unpowered, 2017-2030 (US$ Bn)
7.3. Aerostat Systems Market, by Class, 2017-2030(US$ Bn)
7.3.1. Overview
7.3.2. Aerostat Systems Market, By Class, 2022 vs 2030 (in%)
7.3.3. Aerostat Systems Market, By Compact-sized, 2017-2030 (US$ Bn)
7.3.4. Aerostat Systems Market, By Mid-sized, 2017-2030 (US$ Bn)
7.3.5. Aerostat Systems Market, By Large sized, 2017-2030 (US$ Bn)
7.4. Aerostat Systems Market, by Payload, 2017-2030(US$ Bn)
7.4.1. Overview
7.4.2. Aerostat Systems Market, By Payload, 2022 vs 2030 (in%)
7.4.3. Aerostat Systems Market, By Electro-optic/Infrared sensors (EO/IR), 2017-2030 (US$ Bn)
7.4.4. Aerostat Systems Market, By Communication intelligence, 2017-2030 (US$ Bn)
7.4.5. Aerostat Systems Market, By Cameras, 2017-2030 (US$ Bn)
7.4.6. Aerostat Systems Market, By Electronic intelligence, 2017-2030 (US$ Bn)
7.4.7. Aerostat Systems Market, By Surveillance radar, 2017-2030 (US$ Bn)
7.4.8. Aerostat Systems Market, By Inertial navigation system, 2017-2030 (US$ Bn)

8. North America Aerostat Systems Market Analysis
8.1. North America Aerostat Systems Market, by Type, 2017-2030(US$ Bn)
8.1.1. Overview
8.1.2. SRC Analysis
8.2. North America Aerostat Systems Market, by Propulsion System, 2017-2030(US$ Bn)
8.2.1. Overview
8.2.2. SRC Analysis
8.3. North America Aerostat Systems Market, by Class, 2017-2030(US$ Bn)
8.3.1. Overview
8.3.2. SRC Analysis
8.4. North America Aerostat Systems Market, by Payload, 2017-2030(US$ Bn)
8.4.1. Overview
8.4.2. SRC Analysis
8.5. North America Aerostat Systems Market, by Country, 2017-2030 (US$ Bn)
8.5.1. U.S.
8.5.1.1. U.S. Aerostat Systems Market Estimates and Forecast, 2017-2030 (US$ Bn)
8.5.1.2. U.S. Aerostat Systems, By Type, 2017-2030 (US$ Bn)
8.5.1.3. U.S. Aerostat Systems, By Propulsion System, 2017-2030 (US$ Bn)
8.5.1.4. U.S. Aerostat Systems, By Class, 2017-2030 (US$ Bn)
8.5.1.5. U.S. Aerostat Systems, By Payload, 2017-2030 (US$ Bn)
8.5.2. Canada
8.5.2.1. Canada Aerostat Systems Market Estimates and Forecast, 2017-2030 (US$ Bn)
8.5.2.2. Canada Aerostat Systems, By Type, 2017-2030 (US$ Bn)
8.5.2.3. Canada Aerostat Systems, By Propulsion System, 2017-2030 (US$ Bn)
8.5.2.4. Canada Aerostat Systems, By Class, 2017-2030 (US$ Bn)
8.5.2.5. Canada Aerostat Systems, By Payload, 2017-2030 (US$ Bn)

9. Europe Aerostat Systems Market Analysis
9.1. Europe Aerostat Systems Market, by Type, 2017-2030(US$ Bn)
9.1.1. Overview
9.1.2. SRC Analysis
9.2. Europe Aerostat Systems Market, by Propulsion System, 2017-2030(US$ Bn)
9.2.1. Overview
9.2.2. SRC Analysis
9.3. Europe Aerostat Systems Market, by Class, 2017-2030(US$ Bn)
9.3.1. Overview
9.3.2. SRC Analysis
9.4. Europe Aerostat Systems Market, by Payload, 2017-2030(US$ Bn)
9.4.1. Overview
9.4.2. SRC Analysis
9.5. Europe Aerostat Systems Market, by Country, 2017-2030 (US$ Bn)
9.5.1. Germany
9.5.1.1. Germany Aerostat Systems Market Estimates and Forecast, 2017-2030 (US$ Bn)
9.5.1.2. Germany Aerostat Systems, By Type, 2017-2030 (US$ Bn)
9.5.1.3. Germany Aerostat Systems, By Propulsion System, 2017-2030 (US$ Bn)
9.5.1.4. Germany Aerostat Systems, By Class, 2017-2030 (US$ Bn)
9.5.1.5. Germany Aerostat Systems, By Payload, 2017-2030 (US$ Bn)
9.5.2. France
9.5.2.1. France Aerostat Systems Market Estimates and Forecast, 2017-2030 (US$ Bn)
9.5.2.2. France Aerostat Systems, By Type, 2017-2030 (US$ Bn)
9.5.2.3. France Aerostat Systems, By Propulsion System, 2017-2030 (US$ Bn)
9.5.2.4. France Aerostat Systems, By Class, 2017-2030 (US$ Bn)
9.5.2.5. France Aerostat Systems, By Payload, 2017-2030 (US$ Bn)
9.5.3. UK
9.5.3.1. UK Aerostat Systems Market Estimates and Forecast, 2017-2030 (US$ Bn)
9.5.3.2. UK Aerostat Systems, By Type, 2017-2030 (US$ Bn)
9.5.3.3. UK Aerostat Systems, By Propulsion System, 2017-2030 (US$ Bn)
9.5.3.4. UK Aerostat Systems, By Class, 2017-2030 (US$ Bn)
9.5.3.5. UK Aerostat Systems, By Payload, 2017-2030 (US$ Bn)
9.5.4. Italy
9.5.4.1. Italy Aerostat Systems Market Estimates and Forecast, 2017-2030 (US$ Bn)
9.5.4.2. Italy Aerostat Systems, By Type, 2017-2030 (US$ Bn)
9.5.4.3. Italy Aerostat Systems, By Propulsion System, 2017-2030 (US$ Bn)
9.5.4.4. Italy Aerostat Systems, By Class, 2017-2030 (US$ Bn)
9.5.4.5. Italy Aerostat Systems, By Payload, 2017-2030 (US$ Bn)
9.5.5. Spain
9.5.5.1. Spain Aerostat Systems Market Estimates and Forecast, 2017-2030 (US$ Bn)
9.5.5.2. Spain Aerostat Systems, By Type, 2017-2030 (US$ Bn)
9.5.5.3. Spain Aerostat Systems, By Propulsion System, 2017-2030 (US$ Bn)
9.5.5.4. Spain Aerostat Systems, By Class, 2017-2030 (US$ Bn)
9.5.5.5. Spain Aerostat Systems, By Payload, 2017-2030 (US$ Bn)
9.5.6. Rest of Europe
9.5.6.1. Rest of Europe Aerostat Systems Market Estimates and Forecast, 2017-2030 (US$ Bn)
9.5.6.2. Rest of Europe Aerostat Systems, By Type, 2017-2030 (US$ Bn)
9.5.6.3. Rest of Europe Aerostat Systems, By Propulsion System, 2017-2030 (US$ Bn)
9.5.6.4. Rest of Europe Aerostat Systems, By Class, 2017-2030 (US$ Bn)
9.5.6.5. Rest of Europe Aerostat Systems, By Payload, 2017-2030 (US$ Bn)

10. Asia Pacific Aerostat Systems Market Analysis
10.1. Asia Pacific Aerostat Systems Market, by Type, 2017-2030(US$ Bn)
10.1.1. Overview
10.1.2. SRC Analysis
10.2. Asia Pacific Aerostat Systems Market, by Propulsion System, 2017-2030(US$ Bn)
10.2.1. Overview
10.2.2. SRC Analysis
10.3. Asia Pacific Aerostat Systems Market, by Class, 2017-2030(US$ Bn)
10.3.1. Overview
10.3.2. SRC Analysis
10.4. Asia Pacific Aerostat Systems Market, by Payload, 2017-2030(US$ Bn)
10.4.1. Overview
10.4.2. SRC Analysis
10.5. Asia Pacific Aerostat Systems Market, by Country, 2017-2030 (US$ Bn)
10.5.1. China
10.5.1.1. China Aerostat Systems Market Estimates and Forecast, 2017-2030 (US$ Bn)
10.5.1.2. China Aerostat Systems, By Type, 2017-2030 (US$ Bn)
10.5.1.3. China Aerostat Systems, By Propulsion System, 2017-2030 (US$ Bn)
10.5.1.4. China Aerostat Systems, By Class, 2017-2030 (US$ Bn)
10.5.1.5. China Aerostat Systems, By Payload, 2017-2030 (US$ Bn)
10.5.2. Japan
10.5.2.1. Japan Aerostat Systems Market Estimates and Forecast, 2017-2030 (US$ Bn)
10.5.2.2. Japan Aerostat Systems, By Type, 2017-2030 (US$ Bn)
10.5.2.3. Japan Aerostat Systems, By Propulsion System, 2017-2030 (US$ Bn)
10.5.2.4. Japan Aerostat Systems, By Class, 2017-2030 (US$ Bn)
10.5.2.5. Japan Aerostat Systems, By Payload, 2017-2030 (US$ Bn)
10.5.3. India
10.5.3.1. India Aerostat Systems Market Estimates and Forecast, 2017-2030 (US$ Bn)
10.5.3.2. India Aerostat Systems, By Type, 2017-2030 (US$ Bn)
10.5.3.3. India Aerostat Systems, By Propulsion System, 2017-2030 (US$ Bn)
10.5.3.4. India Aerostat Systems, By Class, 2017-2030 (US$ Bn)
10.5.3.5. India Aerostat Systems, By Payload, 2017-2030 (US$ Bn)
10.5.4. South Korea
10.5.4.1. South Korea Aerostat Systems Market Estimates and Forecast, 2017-2030 (US$ Bn)
10.5.4.2. South Korea Aerostat Systems, By Type, 2017-2030 (US$ Bn)
10.5.4.3. South Korea Aerostat Systems, By Propulsion System, 2017-2030 (US$ Bn)
10.5.4.4. South Korea Aerostat Systems, By Class, 2017-2030 (US$ Bn)
10.5.4.5. South Korea Aerostat Systems, By Payload, 2017-2030 (US$ Bn)
10.5.5. South-East Asia
10.5.5.1. South-East Asia Aerostat Systems Market Estimates and Forecast, 2017-2030 (US$ Bn)
10.5.5.2. South-East Asia Aerostat Systems, By Type, 2017-2030 (US$ Bn)
10.5.5.3. South-East Asia Aerostat Systems, By Propulsion System, 2017-2030 (US$ Bn)
10.5.5.4. South-East Asia Aerostat Systems, By Class, 2017-2030 (US$ Bn)
10.5.5.5. South-East Asia Aerostat Systems, By Payload, 2017-2030 (US$ Bn)
10.5.6. Rest of Asia Pacific
10.5.6.1. Rest of Asia Pacific Aerostat Systems Market Estimates and Forecast, 2017-2030 (US$ Bn)
10.5.6.2. Rest of Asia Pacific Aerostat Systems, By Type, 2017-2030 (US$ Bn)
10.5.6.3. Rest of Asia Pacific Aerostat Systems, By Propulsion System, 2017-2030 (US$ Bn)
10.5.6.4. Rest of Asia Pacific Aerostat Systems, By Class, 2017-2030 (US$ Bn)
10.5.6.5. Rest of Asia Pacific Aerostat Systems, By Payload, 2017-2030 (US$ Bn)

11. Latin America Aerostat Systems Market Analysis
11.1. Latin America Aerostat Systems Market, by Type, 2017-2030(US$ Bn)
11.1.1. Overview
11.1.2. SRC Analysis
11.2. Latin America Aerostat Systems Market, by Propulsion System, 2017-2030(US$ Bn)
11.2.1. Overview
11.2.2. SRC Analysis
11.3. Latin America Aerostat Systems Market, by Class, 2017-2030(US$ Bn)
11.3.1. Overview
11.3.2. SRC Analysis
11.4. Latin America Aerostat Systems Market, by Payload, 2017-2030(US$ Bn)
11.4.1. Overview
11.4.2. SRC Analysis
11.5. Latin America Aerostat Systems Market, by Country, 2017-2030 (US$ Bn)
11.5.1. Brazil
11.5.1.1. Brazil Aerostat Systems Market Estimates and Forecast, 2017-2030 (US$ Bn)
11.5.1.2. Brazil Aerostat Systems, By Type, 2017-2030 (US$ Bn)
11.5.1.3. Brazil Aerostat Systems, By Propulsion System, 2017-2030 (US$ Bn)
11.5.1.4. Brazil Aerostat Systems, By Class, 2017-2030 (US$ Bn)
11.5.1.5. Brazil Aerostat Systems, By Payload, 2017-2030 (US$ Bn)
11.5.2. Mexico
11.5.2.1. Mexico Aerostat Systems Market Estimates and Forecast, 2017-2030 (US$ Bn)
11.5.2.2. Mexico Aerostat Systems, By Type, 2017-2030 (US$ Bn)
11.5.2.3. Mexico Aerostat Systems, By Propulsion System, 2017-2030 (US$ Bn)
11.5.2.4. Mexico Aerostat Systems, By Class, 2017-2030 (US$ Bn)
11.5.2.5. Mexico Aerostat Systems, By Payload, 2017-2030 (US$ Bn)
11.5.3. Rest of Latin America
11.5.3.1. Rest of Latin America Aerostat Systems Market Estimates and Forecast, 2017-2030 (US$ Bn)
11.5.3.2. Rest of Latin America Aerostat Systems, By Type, 2017-2030 (US$ Bn)
11.5.3.3. Rest of Latin America Aerostat Systems, By Propulsion System, 2017-2030 (US$ Bn)
11.5.3.4. Rest of Latin America Aerostat Systems, By Class, 2017-2030 (US$ Bn)
11.5.3.5. Rest of Latin America Aerostat Systems, By Payload, 2017-2030 (US$ Bn)

12. Middle East and Africa Aerostat Systems Market Analysis
12.1. Middle East and Africa Aerostat Systems Market, by Type, 2017-2030(US$ Bn)
12.1.1. Overview
12.1.2. SRC Analysis
12.2. Middle East and Africa Aerostat Systems Market, by Propulsion System, 2017-2030(US$ Bn)
12.2.1. Overview
12.2.2. SRC Analysis
12.3. Middle East and Africa Aerostat Systems Market, by Class, 2017-2030(US$ Bn)
12.3.1. Overview
12.3.2. SRC Analysis
12.4. Middle East and Africa Aerostat Systems Market, by Payload, 2017-2030(US$ Bn)
12.4.1. Overview
12.4.2. SRC Analysis
12.5. Middle East and Africa Aerostat Systems Market, by Country, 2017-2030 (US$ Bn)
12.5.1. GCC Countries
12.5.1.1. GCC Countries Aerostat Systems Market Estimates and Forecast, 2017-2030 (US$ Bn)
12.5.1.2. GCC Countries Aerostat Systems, By Type, 2017-2030 (US$ Bn)
12.5.1.3. GCC Countries Aerostat Systems, By Propulsion System, 2017-2030 (US$ Bn)
12.5.1.4. GCC Countries Aerostat Systems, By Class, 2017-2030 (US$ Bn)
12.5.1.5. GCC Countries Aerostat Systems, By Payload, 2017-2030 (US$ Bn)
12.5.2. South Africa
12.5.2.1. South Africa Aerostat Systems Market Estimates and Forecast, 2017-2030 (US$ Bn)
12.5.2.2. South Africa Aerostat Systems, By Type, 2017-2030 (US$ Bn)
12.5.2.3. South Africa Aerostat Systems, By Propulsion System, 2017-2030 (US$ Bn)
12.5.2.4. South Africa Aerostat Systems, By Class, 2017-2030 (US$ Bn)
12.5.2.5. South Africa Aerostat Systems, By Payload, 2017-2030 (US$ Bn)
12.5.3. Rest of Middle East and Africa
12.5.3.1. Rest of Middle East and Africa Aerostat Systems Market Estimates and Forecast, 2017-2030 (US$ Bn)
12.5.3.2. Rest of Middle East and Africa Aerostat Systems, By Type, 2017-2030 (US$ Bn)
12.5.3.3. Rest of Middle East and Africa Aerostat Systems, By Propulsion System, 2017-2030 (US$ Bn)
12.5.3.4. Rest of Middle East and Africa Aerostat Systems, By Class, 2017-2030 (US$ Bn)
12.5.3.5. Rest of Middle East and Africa Aerostat Systems, By Payload, 2017-2030 (US$ Bn)

13. Company Profiles
13.1. Allsopp Helikites Ltd. (The U.K.)
13.1.1. Company Overview
13.1.2. Products/Services Portfolio
13.1.3. Geographical Presence
13.1.4. Financial Summary
13.1.4.1. Market Revenue and Net Profit (2019-2022)
13.1.4.2. Business Segment Revenue Analysis
13.1.4.3. Geographical Revenue Analysis
13.2. Exelis Inc. (The U.S.)
13.3. ILC Dover, L.P. (The U.S.)
13.4. Israel Aerospace Industries (Israel)
13.5. Lindstrand Technologies Limited (The U.K.)
13.6. Lockheed Martin Corporation (The U.S.)
13.7. Raven Industries Inc. (The U.S.)
13.8. Raytheon Company (The U.S.)
13.9. Tcom L.P. (The U.S.)

List of Figures
FIG. 1 Aerostat Systems Market: Research Methodology
FIG. 2 Market Size Estimation – Top Down & Bottom up Approach
FIG. 3 Aerostat Systems Market Segmentation
FIG. 4 Aerostat Systems Market, by Type, 2022 (US$ Bn)
FIG. 5 Aerostat Systems Market, by Propulsion System, 2022 (US$ Bn)
FIG. 6 Aerostat Systems Market, by Class, 2022 (US$ Bn)
FIG. 7 Aerostat Systems Market, by Payload, 2022 (US$ Bn)
FIG. 8 Aerostat Systems Market, by Geography, 2022 (US$ Bn)
FIG. 9 Attractive Investment Proposition, by Type, 2022
FIG. 10 Attractive Investment Proposition, by Propulsion System, 2022
FIG. 11 Attractive Investment Proposition, by Class, 2022
FIG. 12 Attractive Investment Proposition, by Payload, 2022
FIG. 13 Attractive Investment Proposition, by Geography, 2022
FIG. 14 Global Market Share Analysis of Key Aerostat Systems Market Manufacturers, 2022
FIG. 15 Global Market Positioning of Key Aerostat Systems Market Manufacturers, 2022
FIG. 16 Aerostat Systems Market Value Contribution, By Type, 2022 & 2030 (Value %)
FIG. 17 Aerostat Systems Market, by Balloon, Value, 2017-2030 (US$ Bn)
FIG. 18 Aerostat Systems Market, by Airship, Value, 2017-2030 (US$ Bn)
FIG. 19 Aerostat Systems Market, by Hybrid, Value, 2017-2030 (US$ Bn)
FIG. 20 Aerostat Systems Market Value Contribution, By Propulsion System, 2022 & 2030 (Value %)
FIG. 21 Aerostat Systems Market, by Powered, Value, 2017-2030 (US$ Bn)
FIG. 22 Aerostat Systems Market, by Unpowered, Value, 2017-2030 (US$ Bn)
FIG. 23 Aerostat Systems Market Value Contribution, By Class, 2022 & 2030 (Value %)
FIG. 24 Aerostat Systems Market, by Compact-sized, Value, 2017-2030 (US$ Bn)
FIG. 25 Aerostat Systems Market, by Mid-sized, Value, 2017-2030 (US$ Bn)
FIG. 26 Aerostat Systems Market, by Large sized, Value, 2017-2030 (US$ Bn)
FIG. 27 Aerostat Systems Market Value Contribution, By Payload, 2022 & 2030 (Value %)
FIG. 28 Aerostat Systems Market, by Electro-optic/Infrared sensors (EO/IR), Value, 2017-2030 (US$ Bn)
FIG. 29 Aerostat Systems Market, by Communication intelligence, Value, 2017-2030 (US$ Bn)
FIG. 30 Aerostat Systems Market, by Cameras, Value, 2017-2030 (US$ Bn)
FIG. 31 Aerostat Systems Market, by Electronic intelligence, Value, 2017-2030 (US$ Bn)
FIG. 32 Aerostat Systems Market, by Surveillance radar, Value, 2017-2030 (US$ Bn)
FIG. 33 Aerostat Systems Market, by Inertial navigation system, Value, 2017-2030 (US$ Bn)
FIG. 34 U.S. Aerostat Systems Market, 2017-2030 (US$ Bn)
FIG. 35 Canada Aerostat Systems Market, 2017-2030 (US$ Bn)
FIG. 36 Germany Aerostat Systems Market, 2017-2030 (US$ Bn)
FIG. 37 France Aerostat Systems Market, 2017-2030 (US$ Bn)
FIG. 38 U.K. Aerostat Systems Market, 2017-2030 (US$ Bn)
FIG. 39 Italy Aerostat Systems Market, 2017-2030 (US$ Bn)
FIG. 40 Spain Aerostat Systems Market, 2017-2030 (US$ Bn)
FIG. 41 Rest of Europe Aerostat Systems Market, 2017-2030 (US$ Bn)
FIG. 42 China Aerostat Systems Market, 2017-2030 (US$ Bn)
FIG. 43 Japan Aerostat Systems Market, 2017-2030 (US$ Bn)
FIG. 44 India Aerostat Systems Market, 2017-2030 (US$ Bn)
FIG. 45 South Korea Aerostat Systems Market, 2017-2030 (US$ Bn)
FIG. 46 Southeast Asia Aerostat Systems Market, 2017-2030 (US$ Bn)
FIG. 47 Rest of Asia Pacific Aerostat Systems Market, 2017-2030 (US$ Bn)
FIG. 48 Latin America Aerostat Systems Market, 2017-2030 (US$ Bn)
FIG. 49 Brazil Aerostat Systems Market, 2017-2030 (US$ Bn)
FIG. 50 Mexico Aerostat Systems Market, 2017-2030 (US$ Bn)
FIG. 51 Rest of Latin America Aerostat Systems Market, 2017-2030 (US$ Bn)
FIG. 52 Middle East & Africa Aerostat Systems Market, 2017-2030 (US$ Bn)
FIG. 53 GCC Countries Aerostat Systems Market, 2017-2030 (US$ Bn)
FIG. 54 South Africa Aerostat Systems Market, 2017-2030 (US$ Bn)
FIG. 55 Rest of Middle East and Africa Aerostat Systems Market, 2017-2030 (US$ Bn)

List of Tables
TABLE 1 Market Snapshot: Aerostat Systems Market
TABLE 2 Aerostat Systems Market, by Competitive Benchmarking, 2022
TABLE 3 Aerostat Systems Market, by Geographical Presence Analysis, 2022
TABLE 4 Aerostat Systems Market, by Key Strategies Analysis, 2022
TABLE 5 Aerostat Systems Market, by Type, 2017-2030 (US$ Bn)
TABLE 6 Aerostat Systems Market, by Propulsion System, 2017-2030 (US$ Bn)
TABLE 7 Aerostat Systems Market, by Class, 2017-2030 (US$ Bn)
TABLE 8 Aerostat Systems Market, by Payload, 2017-2030 (US$ Bn)
TABLE 9 Aerostat Systems Market, by Geography, 2017-2030 (US$ Bn)
TABLE 10 North America Aerostat Systems Market, by Type, 2017-2030 (US$ Bn)
TABLE 11 North America Aerostat Systems Market, by Propulsion System, 2017-2030 (US$ Bn)
TABLE 12 North America Aerostat Systems Market, by Class, 2017-2030 (US$ Bn)
TABLE 13 North America Aerostat Systems Market, by Payload, 2017-2030 (US$ Bn)
TABLE 14 North America Aerostat Systems Market, by Country, 2017-2030 (US$ Bn)
TABLE 15 US Aerostat Systems Market, by Type, 2017-2030 (US$ Bn)
TABLE 16 US Aerostat Systems Market, by Propulsion System, 2017-2030 (US$ Bn)
TABLE 17 US Aerostat Systems Market, by Class, 2017-2030 (US$ Bn)
TABLE 18 US Aerostat Systems Market, by Payload, 2017-2030 (US$ Bn)
TABLE 19 Canada Aerostat Systems Market, by Type, 2017-2030 (US$ Bn)
TABLE 20 Canada Aerostat Systems Market, by Propulsion System, 2017-2030 (US$ Bn)
TABLE 21 Canada Aerostat Systems Market, by Class, 2017-2030 (US$ Bn)
TABLE 22 Canada Aerostat Systems Market, by Payload, 2017-2030 (US$ Bn)
TABLE 23 Europe Aerostat Systems Market, by Type, 2017-2030 (US$ Bn)
TABLE 24 Europe Aerostat Systems Market, by Propulsion System, 2017-2030 (US$ Bn)
TABLE 25 Europe Aerostat Systems Market, by Class, 2017-2030 (US$ Bn)
TABLE 26 Europe Aerostat Systems Market, by Payload, 2017-2030 (US$ Bn)
TABLE 27 Europe Aerostat Systems Market, by Country, 2017-2030 (US$ Bn)
TABLE 28 Germany Aerostat Systems Market, by Type, 2017-2030 (US$ Bn)
TABLE 29 Germany Aerostat Systems Market, by Propulsion System, 2017-2030 (US$ Bn)
TABLE 30 Germany Aerostat Systems Market, by Class, 2017-2030 (US$ Bn)
TABLE 31 Germany Aerostat Systems Market, by Payload, 2017-2030 (US$ Bn)
TABLE 32 France Aerostat Systems Market, by Type, 2017-2030 (US$ Bn)
TABLE 33 France Aerostat Systems Market, by Propulsion System, 2017-2030 (US$ Bn)
TABLE 34 France Aerostat Systems Market, by Class, 2017-2030 (US$ Bn)
TABLE 35 France Aerostat Systems Market, by Payload, 2017-2030 (US$ Bn)
TABLE 36 UK Aerostat Systems Market, by Type, 2017-2030 (US$ Bn)
TABLE 37 UK Aerostat Systems Market, by Propulsion System, 2017-2030 (US$ Bn)
TABLE 38 UK Aerostat Systems Market, by Class, 2017-2030 (US$ Bn)
TABLE 39 UK Aerostat Systems Market, by Payload, 2017-2030 (US$ Bn)
TABLE 40 Italy Aerostat Systems Market, by Type, 2017-2030 (US$ Bn)
TABLE 41 Italy Aerostat Systems Market, by Propulsion System, 2017-2030 (US$ Bn)
TABLE 42 Italy Aerostat Systems Market, by Class, 2017-2030 (US$ Bn)
TABLE 43 Italy Aerostat Systems Market, by Payload, 2017-2030 (US$ Bn)
TABLE 44 Spain Aerostat Systems Market, by Type, 2017-2030 (US$ Bn)
TABLE 45 Spain Aerostat Systems Market, by Propulsion System, 2017-2030 (US$ Bn)
TABLE 46 Spain Aerostat Systems Market, by Class, 2017-2030 (US$ Bn)
TABLE 47 Spain Aerostat Systems Market, by Payload, 2017-2030 (US$ Bn)
TABLE 48 Rest of Europe Aerostat Systems Market, by Type, 2017-2030 (US$ Bn)
TABLE 49 Rest of Europe Aerostat Systems Market, by Propulsion System, 2017-2030 (US$ Bn)
TABLE 50 Rest of Europe Aerostat Systems Market, by Class, 2017-2030 (US$ Bn)
TABLE 51 Rest of Europe Aerostat Systems Market, by Payload, 2017-2030 (US$ Bn)
TABLE 52 Asia Pacific Aerostat Systems Market, by Type, 2017-2030 (US$ Bn)
TABLE 53 Asia Pacific Aerostat Systems Market, by Propulsion System, 2017-2030 (US$ Bn)
TABLE 54 Asia Pacific Aerostat Systems Market, by Class, 2017-2030 (US$ Bn)
TABLE 55 Asia Pacific Aerostat Systems Market, by Payload, 2017-2030 (US$ Bn)
TABLE 56 Asia Pacific Aerostat Systems Market, by Country, 2017-2030 (US$ Bn)
TABLE 57 China Aerostat Systems Market, by Type, 2017-2030 (US$ Bn)
TABLE 58 China Aerostat Systems Market, by Propulsion System, 2017-2030 (US$ Bn)
TABLE 59 China Aerostat Systems Market, by Class, 2017-2030 (US$ Bn)
TABLE 60 China Aerostat Systems Market, by Payload, 2017-2030 (US$ Bn)
TABLE 61 Japan Aerostat Systems Market, by Type, 2017-2030 (US$ Bn)
TABLE 62 Japan Aerostat Systems Market, by Propulsion System, 2017-2030 (US$ Bn)
TABLE 63 Japan Aerostat Systems Market, by Class, 2017-2030 (US$ Bn)
TABLE 64 Japan Aerostat Systems Market, by Payload, 2017-2030 (US$ Bn)
TABLE 65 India Aerostat Systems Market, by Type, 2017-2030 (US$ Bn)
TABLE 66 India Aerostat Systems Market, by Propulsion System, 2017-2030 (US$ Bn)
TABLE 67 India Aerostat Systems Market, by Class, 2017-2030 (US$ Bn)
TABLE 68 India Aerostat Systems Market, by Payload, 2017-2030 (US$ Bn)
TABLE 69 South Korea Aerostat Systems Market, by Type, 2017-2030 (US$ Bn)
TABLE 70 South Korea Aerostat Systems Market, by Propulsion System, 2017-2030 (US$ Bn)
TABLE 71 South Korea Aerostat Systems Market, by Class, 2017-2030 (US$ Bn)
TABLE 72 South Korea Aerostat Systems Market, by Payload, 2017-2030 (US$ Bn)
TABLE 73 South East Asia Aerostat Systems Market, by Type, 2017-2030 (US$ Bn)
TABLE 74 South East Asia Aerostat Systems Market, by Propulsion System, 2017-2030 (US$ Bn)
TABLE 75 South East Asia Aerostat Systems Market, by Class, 2017-2030 (US$ Bn)
TABLE 76 South East Asia Aerostat Systems Market, by Payload, 2017-2030 (US$ Bn)
TABLE 77 Rest of Asia Pacific Aerostat Systems Market, by Type, 2017-2030 (US$ Bn)
TABLE 78 Rest of Asia Pacific Aerostat Systems Market, by Propulsion System, 2017-2030 (US$ Bn)
TABLE 79 Rest of Asia Pacific Aerostat Systems Market, by Class, 2017-2030 (US$ Bn)
TABLE 80 Rest of Asia Pacific Aerostat Systems Market, by Payload, 2017-2030 (US$ Bn)
TABLE 81 Latin America Aerostat Systems Market, by Type, 2017-2030 (US$ Bn)
TABLE 82 Latin America Aerostat Systems Market, by Propulsion System, 2017-2030 (US$ Bn)
TABLE 83 Latin America Aerostat Systems Market, by Class, 2017-2030 (US$ Bn)
TABLE 84 Latin America Aerostat Systems Market, by Payload, 2017-2030 (US$ Bn)
TABLE 85 Latin America Aerostat Systems Market, by Country, 2017-2030 (US$ Bn)
TABLE 86 Brazil Aerostat Systems Market, by Type, 2017-2030 (US$ Bn)
TABLE 87 Brazil Aerostat Systems Market, by Propulsion System, 2017-2030 (US$ Bn)
TABLE 88 Brazil Aerostat Systems Market, by Class, 2017-2030 (US$ Bn)
TABLE 89 Brazil Aerostat Systems Market, by Payload, 2017-2030 (US$ Bn)
TABLE 90 Mexico Aerostat Systems Market, by Type, 2017-2030 (US$ Bn)
TABLE 91 Mexico Aerostat Systems Market, by Propulsion System, 2017-2030 (US$ Bn)
TABLE 92 Mexico Aerostat Systems Market, by Class, 2017-2030 (US$ Bn)
TABLE 93 Mexico Aerostat Systems Market, by Payload, 2017-2030 (US$ Bn)
TABLE 94 Rest of Latin America Aerostat Systems Market, by Type, 2017-2030 (US$ Bn)
TABLE 95 Rest of Latin America Aerostat Systems Market, by Propulsion System, 2017-2030 (US$ Bn)
TABLE 96 Rest of Latin America Aerostat Systems Market, by Class, 2017-2030 (US$ Bn)
TABLE 97 Rest of Latin America Aerostat Systems Market, by Payload, 2017-2030 (US$ Bn)
TABLE 98 Middle East and Africa Aerostat Systems Market, by Type, 2017-2030 (US$ Bn)
TABLE 99 Middle East and Africa Aerostat Systems Market, by Propulsion System, 2017-2030 (US$ Bn)
TABLE 100 Middle East and Africa Aerostat Systems Market, by Class, 2017-2030 (US$ Bn)
TABLE 101 Middle East and Africa Aerostat Systems Market, by Payload, 2017-2030 (US$ Bn)
TABLE 102 Middle East and Africa Aerostat Systems Market, by Country, 2017-2030 (US$ Bn)
TABLE 103 GCC Countries Aerostat Systems Market, by Type, 2017-2030 (US$ Bn)
TABLE 104 GCC Countries Aerostat Systems Market, by Propulsion System, 2017-2030 (US$ Bn)
TABLE 105 GCC Countries Aerostat Systems Market, by Class, 2017-2030 (US$ Bn)
TABLE 106 GCC Countries Aerostat Systems Market, by Payload, 2017-2030 (US$ Bn)
TABLE 107 South Africa Aerostat Systems Market, by Type, 2017-2030 (US$ Bn)
TABLE 108 South Africa Aerostat Systems Market, by Propulsion System, 2017-2030 (US$ Bn)
TABLE 109 South Africa Aerostat Systems Market, by Class, 2017-2030 (US$ Bn)
TABLE 110 South Africa Aerostat Systems Market, by Payload, 2017-2030 (US$ Bn)
TABLE 111 Rest of Middle East and Africa Aerostat Systems Market, by Type, 2017-2030 (US$ Bn)
TABLE 112 Rest of Middle East and Africa Aerostat Systems Market, by Propulsion System, 2017-2030 (US$ Bn)
TABLE 113 Rest of Middle East and Africa Aerostat Systems Market, by Class, 2017-2030 (US$ Bn)
TABLE 114 Rest of Middle East and Africa Aerostat Systems Market, by Payload, 2017-2030 (US$ Bn)

Frequently Asked Questions

How does COVID-19 Impact the global aerostat systems market?

COVID-19 has had a substantial impact on the market due to the outbreak of the COVID-19 pandemic, which impacted the demand for aerostat systems.

Which is the leading region of the market for aerostat systems?

North America accounted for the most heightened global aerostat systems market share.

What are the key drivers for the growth of the aerostat systems market?

Growing demand from military organizations to drive the aerostat systems market.2028.

Which is the major aerostat systems market segment by type?

The balloon segment had a major global market share in 2022.

Which is the major aerostat systems market segment by propulsion system?

The powered segment had a major global market share in 2022.

Solar-Powered Drone Market

Published:
Report ID: 33586

Aerial Imaging Market

Published:
Report ID: 2597

Commercial Aircraft Passenger Service Unit (PSU) Market

Published:
Report ID: 32095

Aviation Fuel Market

Published:
Report ID: 23337

Defense Cyber Security Market

Published:
Report ID: 23353

Aerospace Valves Market

Published:
Report ID: 22847

Intelligent Marine Navigation Systems Market

Published:
Report ID: 6903

Flight Management Systems (FMS) Market

Published:
Report ID: 18832

Aerospace Antimicrobial Coating Market

Published:
Report ID: 18580

Ground and Cargo Handling Services Market

Published:
Report ID: 17986

High Altitude Platforms (HAPs) Market

Published:
Report ID: 6809

Purchase Options

$2999
Delivery Format: Excel.
$4999
Designed for the individual purchaser.
$6999
Users located at a single corporate site or regional office.
$7999
Allowed for unlimited sharing globally within one company.
Smallform of Sample request

Have a question?

User Profile

Don’t settle for less – trust Mitul to help you find the best solution.

Report delivery within 24 to 48 hours

– Other Info –

What people say?-

User Review

I am very impressed with the information in this report. The author clearly did their research when they came up with this product and it has already given me a lot of ideas.

Jana Schmidt
CEDAR CX Technologies

– Connect with us –

Phone

+91 6232 49 3207


support

24/7 Research Support


sales@credenceresearch.com

– Research Methodology –

Going beyond the basics: advanced techniques in research methodology

– Trusted By –

Pepshi, LG, Nestle
Motorola, Honeywell, Johnson and johnson
LG Chem, SIEMENS, Pfizer
Unilever, Samsonite, QIAGEN