
Biostimulants Market Overview:
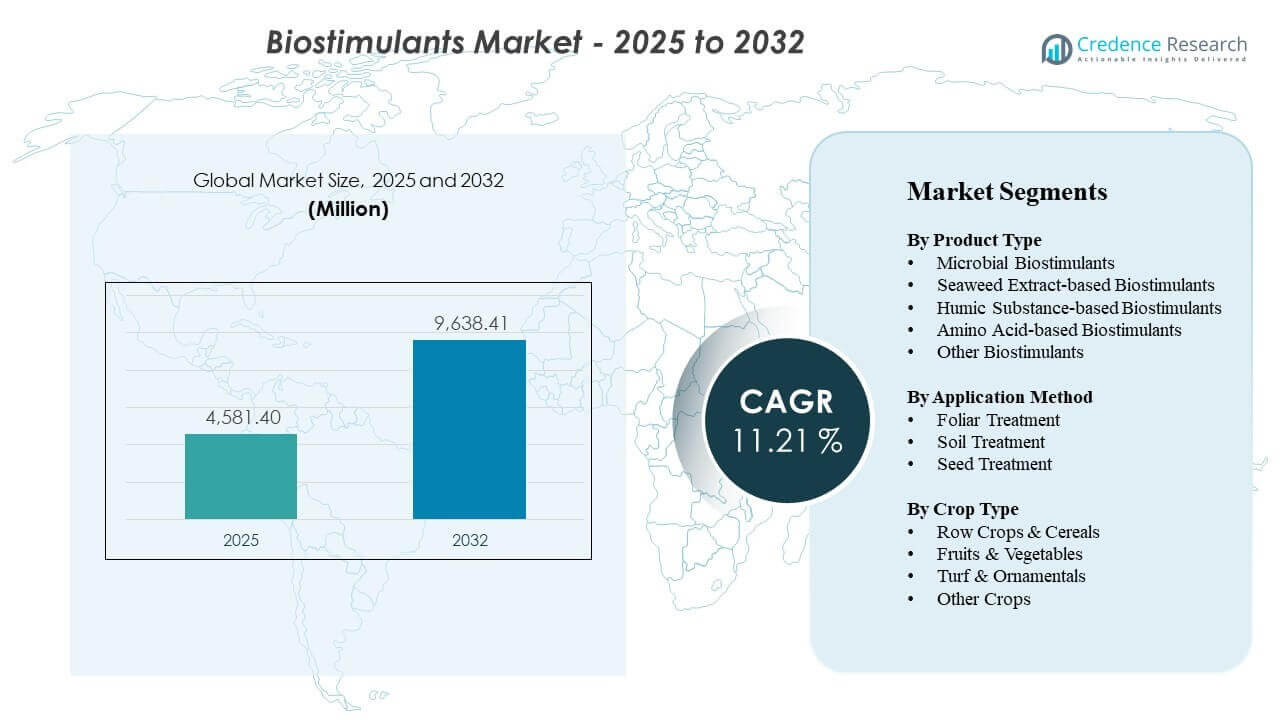
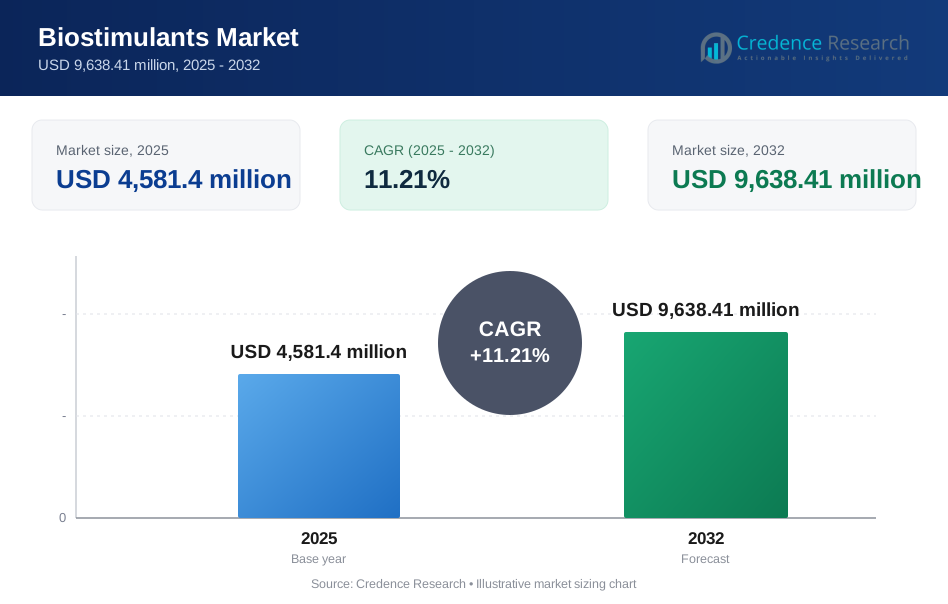
The global Biostimulants Market size was estimated at USD 4,581.4 million in 2025 and is expected to reach USD 9,638.41 million by 2032, growing at a CAGR of 11.21% from 2025 to 2032. Biostimulants Market growth is primarily driven by rising demand for input-efficiency solutions that improve nutrient uptake and stress tolerance as growers respond to weather variability, tighter residue expectations, and escalating fertilizer cost volatility. Biostimulants Market demand is further supported by faster adoption in high-value horticulture and accelerating commercialization of biological crop input portfolios across major agricultural regions.
| REPORT ATTRIBUTE | DETAILS |
|---|---|
| Historical Period | 2020-2024 |
| Base Year | 2025 |
| Forecast Period | 2026-2032 |
| Biostimulants Market Size 2025 | USD 4,581.4 million |
| Biostimulants Market, CAGR | 11.21% |
| Biostimulants Market Size 2032 | USD 9,638.41 million |
Key Market Trends & Insights
- Europe accounted for 34.5% of Biostimulants Market revenue in 2025, reflecting strong adoption momentum in sustainability-led agronomy programs.
- Asia Pacific represented 26.7% of Biostimulants Market revenue in 2025, supported by expanding acreage under improved crop management practices.
- North America contributed 20.4% of Biostimulants Market revenue in 2025, underpinned by broad integration into established crop input distribution channels.
- Foliar Treatment accounted for the largest application share of 77.9% in 2025, reflecting grower preference for rapid uptake and in-season response.
- Row Crops & Cereals represented the largest crop-type share of 60.8% in 2025, supported by scale economics and yield-stability priorities.
Segment Analysis
Biostimulants Market adoption is shaped by a strong preference for solutions that fit existing farm operations and deliver visible agronomic outcomes within a single season. Foliar delivery remains widely favored because foliar programs integrate smoothly into routine spraying schedules, enabling fast physiological response during heat, drought, and nutrient stress periods. Seed treatment expansion is supported by the demand for early vigor and uniform emergence, particularly in commercial seed systems where treatments scale efficiently across planted hectares. Soil treatment remains important in programs that prioritize long-run root-zone performance and soil conditioning, especially when biostimulants are paired with micronutrients and fertility plans.
Biostimulants Market product selection is increasingly influenced by compatibility, stability, and repeatability across crops and geographies. Amino acid-based formulations are widely adopted where rapid stress-mitigation positioning and fertigation compatibility are valued, supporting repeat use in intensive cropping systems. Microbial biostimulants and humic-based inputs gain traction when growers prioritize root development and nutrient mobilization, but adoption depends heavily on local agronomy support and consistent field performance. Product differentiation continues to expand through blended formulations that combine microbial and biochemical actives to widen use-cases across row crops and horticulture.
By Product Type Insights
Amino Acid-based Biostimulants accounted for the largest share of 29.8% in 2025. Amino Acid-based Biostimulants lead because formulations are commonly positioned for rapid stress response and are frequently compatible with foliar and fertigation programs used in intensive crop management. Amino Acid-based Biostimulants benefit from simple integration into existing nutrient schedules, supporting repeat purchases when growers target visible recovery after stress events. Amino Acid-based Biostimulants also align with distributor-led bundling strategies that package biological inputs alongside core crop nutrition and crop protection programs.
By Application Method Insights
Foliar Treatment accounted for the largest share of 77.9% in 2025. Foliar Treatment leads because foliar programs provide fast uptake and are applied at decision points when growers actively manage stress, canopy development, and yield formation. Foliar Treatment fits established sprayer workflows and reduces operational friction compared with adding new delivery infrastructure. Foliar Treatment also benefits from clearer performance attribution in-season, which supports faster adoption and repeat use when visible crop response is achieved.
By Crop Type Insights
Row Crops & Cereals accounted for the largest share of 60.8% in 2025. Row Crops & Cereals lead because planted acreage is large and growers prioritize yield stability and input efficiency across extensive hectares. Row Crops & Cereals adoption accelerates when agronomy programs demonstrate consistent return on investment under variable weather and soil conditions. Row Crops & Cereals also benefit from broad distributor coverage and high compatibility with mainstream fertility programs, enabling scalable deployment across large farming operations.
Biostimulants Market Drivers
Rising focus on input-efficiency and nutrient optimization
Biostimulants Market demand is supported by grower need to improve nutrient uptake efficiency and reduce yield variability under rising fertilizer and energy cost pressure. Biostimulants Market adoption increases when products demonstrate measurable improvements in nutrient assimilation, root vigor, or stress tolerance under field conditions. Biostimulants Market growth is reinforced by the ability to integrate biostimulants into existing fertility programs rather than replacing core inputs. Biostimulants Market purchasing decisions are increasingly shaped by farm-level economics that favor incremental yield or quality gains with manageable application complexity.
Climate variability and abiotic stress mitigation needs
Biostimulants Market expansion is reinforced by increasing frequency of heat, drought, salinity stress, and irregular rainfall patterns that raise yield risk. Biostimulants Market positioning frequently emphasizes resilience benefits such as improved water-use efficiency, enhanced root development, and faster recovery from stress events. Biostimulants Market adoption rises when agronomic advisors align timing and dosage with stress windows across crop growth stages. Biostimulants Market performance validation through local trials remains critical for scaling use beyond early adopters.
- For instance, Brandon Bioscience reported that ISKAMAR, developed with PSI 433 Precision Technology, delivered a 16.1% increase in marketable potato yield in severe-drought field trials versus untreated crops.
Shift toward sustainable and biological crop input portfolios
Biostimulants Market growth is accelerated by sustainability-linked farming initiatives that encourage reduced chemical load and improved soil health outcomes. Biostimulants Market demand benefits from expanded biological portfolios by large input suppliers, improving product availability, technical support, and distribution reach. Biostimulants Market commercialization is supported by stronger branding and clearer use-case segmentation across crops and application windows. Biostimulants Market growth also reflects increasing compatibility of biostimulants with integrated pest management and precision nutrition strategies.
Expansion of high-value horticulture and quality-driven production
Biostimulants Market demand is strengthened by growth in fruits and vegetables, where quality attributes and shelf-life outcomes influence pricing and grower profitability. Biostimulants Market adoption rises when products support uniformity, flowering, fruit set, or stress resilience in high-value production systems. Biostimulants Market usage intensity tends to be higher in protected cultivation and intensive horticulture due to higher input budgets and closer crop monitoring. Biostimulants Market growth also benefits from premiumization trends that reward improvements in crop appearance, size, and post-harvest performance.
- For instance, Valagro’s 2021 UC Davis processing tomato trial showed that TALETE increased red fruit output by three tons at 100% ET and six tons at 75% ET, while deficit-irrigated plots at 75% ET recorded yield gains of four tons per acre over untreated plots.
Biostimulants Market Challenges
Biostimulants Market growth is constrained by variability in field performance across geographies, soil types, and climate conditions. Biostimulants Market buyers often require localized trial evidence, which increases sales cycles and raises technical support costs for manufacturers and distributors. Biostimulants Market adoption can stall when product claims are perceived as inconsistent or when outcomes are difficult to attribute versus fertility, irrigation, and weather variability. Biostimulants Market also faces formulation stability challenges for certain biological actives, influencing shelf life and logistics handling requirements.
Biostimulants Market expansion is also limited by regulatory complexity and evolving definitions that influence product registration, labeling, and marketing claims. Biostimulants Market players must invest in compliance, documentation, and efficacy substantiation to sustain credibility in professional farming channels. Biostimulants Market education gaps persist among smaller growers and fragmented distribution networks, which can reduce correct application practices and weaken results. Biostimulants Market pricing sensitivity in commodity crops can further slow adoption when yield benefits are not consistently demonstrated.
- For instance, Brandon Bioscience reports that it invests 15% of annual turnover into research and development for its PSI Technology platform, underscoring the scale of scientific validation and documentation required to support product claims and maintain confidence in regulated farming channels.
Biostimulants Market Trends and Opportunities
Biostimulants Market innovation is increasingly oriented toward blended formulations and consortia strategies that combine microbial and biochemical actives for broader crop fit. Biostimulants Market suppliers are expanding product portfolios to address multiple objectives such as root enhancement, nutrient mobilization, and stress response within a single program. Biostimulants Market opportunity is strengthened by improved formulation technologies that stabilize living organisms and increase compatibility with common tank mixes. Biostimulants Market differentiation is increasingly driven by proof-of-performance programs, digital agronomy tools, and advisor-led prescription models.
- For instance, Corteva reported that its Utrisha N biostimulant can be mixed with many crop inputs, was validated through close to 100 small trials and farm demonstrations in Australia, delivered a response equivalent to about 30 kilograms of nitrogen per hectare in replicated wheat work, and increased average wheat yield from 3.11 t/ha to 3.27 t/ha across 16 replications, a statistically significant gain of about 5%.
Biostimulants Market opportunity is also expanding through seed-applied and early-stage vigor programs that scale efficiently across commercial seed systems. Biostimulants Market growth in seed treatment is supported by uniform coverage, low-dose economics, and easier adoption through seed suppliers. Biostimulants Market demand may increase as farm operations adopt more data-driven decision-making that links biostimulant timing to stress forecasts and crop phenology. Biostimulants Market players that invest in localized agronomy networks and outcome tracking are positioned to accelerate repeat purchases and expand acreage penetration.
Regional Insights
North America
North America accounted for 20.4% of Biostimulants Market revenue in 2025. Biostimulants Market demand in North America is supported by strong distributor networks, widespread adoption of performance-based inputs, and high prevalence of integrated crop management programs. Biostimulants Market growth is reinforced by large-scale row crop acreage that benefits from yield-stability positioning and stress-mitigation use cases. Biostimulants Market adoption increases when agronomy recommendations are standardized across retail advisory channels and when products demonstrate consistent return on investment across seasons.
Europe
Europe accounted for 34.5% of Biostimulants Market revenue in 2025. Biostimulants Market leadership in Europe is supported by broad adoption of sustainability-led agronomy, strong technical advisory ecosystems, and frequent use in high-value crops where quality outcomes matter. Biostimulants Market demand also benefits from high awareness of biological crop inputs and a mature supplier landscape offering diverse product portfolios. Biostimulants Market growth is reinforced by structured field validation programs that help translate claims into repeatable farm outcomes.
Asia Pacific
Asia Pacific accounted for 26.7% of Biostimulants Market revenue in 2025. Biostimulants Market growth in Asia Pacific is supported by expanding intensification of agriculture, rising adoption of modern crop inputs, and the need to improve productivity under weather variability. Biostimulants Market demand benefits from increasing use in horticulture and export-oriented production where crop quality and uniformity are emphasized. Biostimulants Market adoption is strengthened when distribution networks expand technical training and when products are tailored to local cropping systems and nutrient management practices.
Latin America
Latin America accounted for 14.9% of Biostimulants Market revenue in 2025. Biostimulants Market adoption in Latin America is supported by large commercial farming operations that are receptive to yield-enhancing technologies when performance is validated at scale. Biostimulants Market demand benefits from strong agronomy influence in large-acreage crops and from growing use in plantation and horticulture systems. Biostimulants Market expansion depends on consistent product performance across diverse soil and climate conditions and on efficient distributor-led technical support.
Middle East & Africa
Middle East & Africa accounted for 3.5% of Biostimulants Market revenue in 2025. Biostimulants Market growth in Middle East & Africa is shaped by uneven adoption across countries and by differences in access to modern inputs and advisory services. Biostimulants Market demand is supported by stress-driven agronomy needs, including water scarcity and heat exposure that increase interest in resilience-oriented products. Biostimulants Market penetration improves when suppliers invest in local trials, strengthen distribution reach, and support correct application practices for consistent results.
Competitive Landscape
Biostimulants Market competition is characterized by portfolio expansion, formulation differentiation, and intensified field validation efforts to build credibility with agronomy advisors and growers. Biostimulants Market suppliers compete through product positioning around stress tolerance, nutrient use efficiency, and root-zone performance, supported by localized trials and demonstration plots. Biostimulants Market consolidation and partnership activity continues as companies seek access to novel biological actives, stronger manufacturing capability, and wider distribution channels. Biostimulants Market differentiation increasingly depends on technical service depth, compatibility with existing crop programs, and evidence-backed performance claims across diverse conditions.
BASF SE is positioned to compete through broad biological portfolio development and integration of biostimulants into established crop solutions programs. BASF SE benefits from global reach, distributor relationships, and the ability to scale commercialization through bundled offerings that align biostimulants with nutrition and crop protection schedules. BASF SE strategy is supported by partnerships and product development that expand access to key actives and strengthen crop-specific solution design. BASF SE progress is reinforced by investment capacity for field trials, regulatory readiness, and technical advisory enablement to accelerate adoption.
The industry research and growth report includes detailed analyses of the competitive landscape of the market and information about key companies, including:
- BASF SE
- Syngenta Group
- UPL Limited
- Koppert Biological Systems
- Valagro
- Biolchim S.p.A.
- Isagro S.p.A.
- Rallis India Limited
- Novozymes A/S
- FMC Corporation
- Adama Agricultural Solutions
- Gowan Group
Qualitative and quantitative analysis of companies has been conducted to help clients understand the wider business environment as well as the strengths and weaknesses of key industry players. Data is qualitatively analyzed to categorize companies as pure play, category-focused, industry-focused, and diversified; it is quantitatively analyzed to categorize companies as dominant, leading, strong, tentative, and weak.
Recent Developments
- In January 2026, SAS Group acquired Ceres Biotics, a Madrid-based company focused on microbial biofertilizers and biostimulants, as part of its expansion into microbial biosolutions.
- In November 2025, Valent BioSciences and Seipasa formed a strategic partnership to launch Sweetsei in the U.S., a biostimulant aimed at improving crop quality for specialty crop growers.
- In August, 2025, Ocean Rainforest announced the launch of SEAWEED and KELPSHIELD in California, two seaweed-based biostimulants that the company said are registered by the California Department of Food and Agriculture and OMRI Listed for certified organic farming.
- In May 2025, ICL Group acquired Lavie Bio for an undisclosed amount to expand its position in agricultural biologicals and strengthen its microbial-based biostimulants and biopesticides pipeline.
Report Scope
| Report Attribute | Details |
| Market size value in 2025 | USD 4581.4 million |
| Revenue forecast in 2032 | USD 9638.41 million |
| Growth rate (CAGR) | 11.21% (2025–2032) |
| Base year | 2025 |
| Forecast period | 2026-2032 |
| Quantitative units | USD million |
| Segments covered | By Product Type; By Application Method; By Crop Type |
| Regional scope | North America, Europe, Asia Pacific, Latin America, Middle East & Africa |
| Key companies profiled | BASF SE; Syngenta Group; UPL Limited; Koppert Biological Systems; Valagro; Biolchim S.p.A.; Isagro S.p.A.; Rallis India Limited; Novozymes A/S; FMC Corporation; Adama Agricultural Solutions; Gowan Group |
| No.of Pages | 328 |
Segmentation
By Product Type
- Microbial Biostimulants
- Seaweed Extract-based Biostimulants
- Humic Substance-based Biostimulants
- Amino Acid-based Biostimulants
- Other Biostimulants
By Application Method
- Foliar Treatment
- Soil Treatment
- Seed Treatment
By Crop Type
- Row Crops & Cereals
- Fruits & Vegetables
- Turf & Ornamentals
- Other Crops
By Region
- North America
- U.S.
- Canada
- Mexico
- Europe
- Germany
- France
- U.K.
- Italy
- Spain
- Rest of Europe
- Asia Pacific
- China
- Japan
- India
- South Korea
- South-east Asia
- Rest of Asia Pacific
- Latin America
- Brazil
- Argentina
- Rest of Latin America
- Middle East & Africa
- GCC Countries
- South Africa
- Rest of the Middle East and Africa
Request a Free Sample
Fill in your details and we'll send you a free sample report.
- Sample data tables & charts
- Research methodology
Need a Custom Version of This Report?
Tailor the scope, geography, or segments to your exact requirements.
- Custom geography or segment scope
- Direct access to our analyst team
Frequently Asked Questions
What is the Biostimulants Market size in 2025?
What is the Biostimulants Market forecast for 2032?
What is the Biostimulants Market CAGR for 2025–2032?
What is the largest segment in the Biostimulants Market?
Which companies are leading in the Biostimulants Market?
Which region leads the Biostimulants Market?
Table of Content
Chapter 1. Report Introduction
- 1.1 Report Description & Purpose
- 1.1.1 Report Title & Market Definition
- 1.1.2 Unique Selling Propositions (USP) & Key Differentiators
- 1.1.3 Value Proposition for Stakeholders
- 1.2 Research Objectives
- 1.2.1 Market Sizing Objectives (Volume & Revenue)
- 1.2.2 Segmentation Objectives
- 1.2.3 Competitive Intelligence Objectives
- 1.2.4 Forecast & Scenario Objectives
- 1.3 Report Scope
- 1.3.1 Biostimulants Scope – Types & Subtypes Covered
- 1.3.2 Geographic Scope – Regions & Countries Covered
- 1.3.3 Historical Period, Base Year & Forecast Period (2025; forecast to 2032)
- 1.3.4 Inclusions & Exclusions
- 1.4 HS Code & Classification Framework
- 1.5 Currency, Units & Pricing Basis
- 1.6 Target Stakeholders
- 1.7 Limitations & Assumptions
Chapter 2. Executive Summary
- 2.1 Global Biostimulants Market Snapshot
- 2.1.1 Market Size – Historical (2025) & Forecast (2025-2032) (2025: USD 4,581.4 million → 2032: USD 9,638.41 million)
- 2.1.2 Volume & Revenue – Global Totals
- 2.1.3 Key Market Highlights – Top Five Facts
- 2.2 Biostimulants Market Segmentation Snapshot
- 2.2.1 Market Split by Region – 2025 vs. 2032
- 2.3 Competitive Snapshot
- 2.3.1 Top 10 Players by Revenue Share – 2025
- 2.3.2 Top 10 Players by Volume Share – 2025
- 2.3.3 Recent Strategic Developments (18-Month Summary)
- 2.4 Key Investment Highlights & Strategic Conclusions
Chapter 3. Biostimulants Market Dynamics & Industry Analysis
- 3.1 Market Overview & Context
- 3.1.1 Biostimulants Market Position in the Broader Automotive Value Chain
- 3.1.2 OEM vs. Replacement Market Dynamics
- 3.1.3 Market Maturity & Development Stage by Region
- 3.2 Biostimulants Market Drivers
- 3.3 Biostimulants Market Restraints & Challenges
- 3.4 Biostimulants Market Opportunities
- 3.5 Porter's Five Forces Analysis
- 3.5.1 Threat of New Entrants
- 3.5.2 Bargaining Power of Suppliers
- 3.5.3 Bargaining Power of Buyers
- 3.5.4 Threat of Substitutes
- 3.5.5 Competitive Rivalry – Intensity Assessment
- 3.6 Biostimulants Value Chain Analysis
- 3.6.1 Upstream – Raw Material/Input Suppliers
- 3.6.1.1 Raw Material/Input 1
- 3.6.1.2 Raw Material/Input 2
- 3.6.1.3 Raw Material/Input 3
- 3.6.2 Midstream – Production/Manufacturing/Service Delivery
- 3.6.2.1 Production/Process Overview
- 3.6.2.2 Key Facility Locations & Capacity by Manufacturer
- 3.6.3 Downstream – Distribution & End Consumer
- 3.6.3.1 Primary Channel – B2B/OEM
- 3.6.3.2 Secondary Channels – Dealer, Retail, Online, Direct
- 3.6.4 Value Chain Profitability Analysis
- 3.6.1 Upstream – Raw Material/Input Suppliers
- 3.7 PESTEL Analysis
- 3.7.1 Political Factors
- 3.7.2 Economic Factors
- 3.7.3 Social Factors
- 3.7.4 Technological Factors
- 3.7.5 Environmental Factors
- 3.7.6 Legal Factors
- 3.8 Biostimulants Supply Chain Analysis
- 3.8.1 Raw Material/Input Supply Risk Assessment
- 3.8.2 Manufacturing Concentration Risk (Geographic Exposure)
- 3.8.3 Trade Disruption Impact Analysis
- 3.9 Regulatory & Policy Landscape
Note: The regulatory and policy landscape section covers regulations based on their applicability to the market, Biostimulants category, geography, and scope of the study. Only regulatory frameworks with a material impact on operations, compliance, trade, sustainability, or market access are analyzed in detail.
Chapter 4. Key Investment Pockets & Opportunity Analysis
- 4.1 Biostimulants Market Attractiveness Analysis
- 4.1.1 By Region – Investment Attractiveness Matrix (Volume × CAGR)
- 4.2 Absolute Revenue Growth Opportunity
- 4.2.1 By Region – Absolute USD Growth Through 2032
- 4.3 Incremental Volume Opportunity
- 4.3.1 By Region – Incremental Volume Through 2032
- 4.3.2 Segment – Incremental Volume
- 4.4 Emerging Submarket Opportunity Deep Dive (Subject to Applicability)
- 4.5 Emerging Market Opportunity Scorecards
- 4.5.1 United States
- 4.5.2 Europe
- 4.5.3 Asia
- 4.5.4 Middle East & Africa
Note: Emerging Market Opportunity Scorecards will be included based on relevance and strategic importance. Regions listed are indicative and may vary depending on data availability and market dynamics.
Chapter 5. Biostimulants Import-Export Analysis & Trade Flows
- 5.1 Global Trade Overview
- 5.1.1 Global Export Value by Country (2025)
- 5.1.2 Global Export Volume by Country (2025)
- 5.1.3 Global Import Value by Country (2025)
- 5.1.4 Global Import Volume by Country (2025)
- 5.1.5 Net Trade Balance by Country (2025)
- 5.2 Export Analysis – Segment
- 5.2.1 Type 1 (HS Code)
- 5.2.2 Type 2 (HS Code)
- 5.2.3 Type 3 (HS Code)
- 5.2.4 Type 4 (HS Code)
- 5.2.5 Type 5 (HS Code)
- 5.3 Import Analysis – Segment
- 5.3.1 Type 1 (HS Code)
- 5.3.2 Type 2 (HS Code)
- 5.3.3 Type 3 (HS Code)
- 5.3.4 Type 4 (HS Code)
- 5.3.5 Type 5 (HS Code)
- 5.4 Average Unit Trade Prices
- 5.4.1 Average Export Price – Segment & Country
- 5.4.2 Average Import Price – Segment & Source Country
- 5.4.3 Price Trends (2025)
- 5.5 Key Trade Route Analysis
- 5.5.1 Trade Route 1
- 5.5.2 Trade Route 2
- 5.5.3 Trade Route 3
- 5.5.4 Trade Route 4
- 5.5.5 Trade Route 5
- 5.6 Trade Policy Impact Assessment
- 5.6.1 US Anti-Dumping & Section 301 Tariffs
- 5.6.2 EU Customs Union Impact
- 5.6.3 Major Free Trade Agreements
- 5.6.4 USMCA Rules of Origin
Note: Trade policy analysis will be included only where relevant to the Biostimulants market.
Chapter 6. Competitive Landscape & Company Benchmarking
- 6.1 Biostimulants Market Concentration & Structure
- 6.1.1 Herfindahl-Hirschman Index (HHI) – vs. 2025
- 6.1.2 Tier 1, Tier 2 & Tier 3 Market Structure
- 6.1.3 Global, Regional & Local Player Dynamics
- 6.2 Biostimulants Market Share Analysis – 2025
- 6.2.1 Global Revenue Share by Company
- 6.2.2 Global Volume Share by Company
- 6.2.3 Regional Revenue Share
- 6.2.4 Market Share Evolution ( vs. 2025)
- 6.2.5 OEM Segment Share by Company
- 6.2.6 Replacement Segment Share by Company
- 6.3 Production/Delivery Capacity & Facility Analysis
- 6.3.1 Global Installed Capacity
- 6.3.2 Capacity Utilization Rates
- 6.3.3 Production/Output Volume
- 6.3.4 Facility Locations & Capacity Map
- 6.3.5 Planned Capacity Additions
- 6.4 Biostimulants Competitive Benchmarking Matrix
- 6.4.1 Revenue, Volume, CAGR & Profitability Comparison
- 6.4.2 Channel Revenue Mix
- 6.4.3 Geographic Revenue Exposure
- 6.4.4 R&D Intensity
- 6.4.5 Sustainability Maturity
- 6.5 Strategic Developments in Biostimulants (Last 24 Months)
- 6.5.1 Mergers, Acquisitions & Divestments
- 6.5.2 New Biostimulants Launches
- 6.5.3 Facility Expansions
- 6.5.4 Strategic Alliances, Joint Ventures & Partnerships
- 6.5.5 Distribution Expansion & Market Entry
- 6.5.6 Sustainability & ESG Initiatives
- 6.6 Competitive Strategy Mapping
- 6.6.1 Leader, Challenger, Follower & Niche Classification
- 6.6.2 Pricing Strategy Comparison
- 6.6.3 Channel Strategy Matrix
Note: Strategic developments are included based on their materiality and the availability of reliable information.
Chapter 7. Global Biostimulants Market – By Distribution Channel
- 7.1 Segment Overview
- 7.1.1 Volume & Revenue Split by Channel (2025 & 2032)
- 7.1.2 Channel Mix Evolution (2025-2032)
Chapter 8. Regional Market Analysis – Global Overview
- 8.1 Global Regional Overview
- 8.1.1 Regional Volume Share
- 8.1.2 Regional Revenue Share
- 8.1.3 Regional Volume by Region
- 8.1.4 Regional Revenue by Region
- 8.1.5 Regional Forecast Through 2032
- 8.2 Cross-Regional Segment Analysis
- 8.2.1 By Distribution Channel
- 8.2.2 By Brand/Price Tier
Chapter 9. North America Biostimulants Market
- 9.1 United States
- 9.2 Canada
- 9.3 Mexico
Chapter 10. Europe Biostimulants Market
- 10.1 Germany
- 10.2 France
- 10.3 Italy
- 10.4 United Kingdom
- 10.5 Spain
- 10.6 Poland
- 10.7 Russia
- 10.8 Netherlands
- 10.9 Belgium
- 10.10 Sweden
- 10.11 Denmark
- 10.12 Norway
- 10.13 Rest of Europe
Chapter 11. Asia Pacific Biostimulants Market
- 11.1 China
- 11.2 India
- 11.3 Japan
- 11.4 South Korea
- 11.5 Thailand
- 11.6 Indonesia
- 11.7 Vietnam
- 11.8 Malaysia
- 11.9 Australia
- 11.10 Rest of Asia Pacific
Chapter 12. Latin America Biostimulants Market
- 12.1 Brazil
- 12.2 Argentina
- 12.3 Colombia
- 12.4 Chile
- 12.5 Rest of Latin America
Chapter 13. Middle East Biostimulants Market
- 13.1 Saudi Arabia
- 13.2 United Arab Emirates
- 13.3 Turkey
- 13.4 Israel
- 13.5 Iran
- 13.6 Rest of the Middle East
Chapter 14. Africa Biostimulants Market
- 14.1 South Africa
- 14.2 Egypt
- 14.3 Nigeria
- 14.4 Morocco
- 14.5 Rest of Africa
Chapter 15. Biostimulants Company Profiles
- 15.1 [Company 01]
- 15.1.1 Company Overview
- 15.1.2 Key Management Personnel
- 15.1.3 Products & Services Portfolio
- 15.1.4 Financial Performance
- 15.1.5 Key Market Focus & Geographic Presence
- 15.1.6 Recent Developments & Strategic Initiatives
Note: The company profile list is preliminary and may change based on research findings, market developments, data availability, and client requirements.
Chapter 16. Appendices
- Appendix A – List of Abbreviations & Acronyms
- Appendix B – Industry Classification Code Reference – Full Series
- Appendix C – Production & Capacity Data Tables
- Appendix D – End-Use & Demand Base Tables
- Appendix E – Consumption & Replacement Rate Assumptions
- Appendix F – ASP Reference Tables
- Appendix G – Manufacturing & Facility Database
- Appendix H – Import-Export Data Tables
- Appendix I – Regulatory Summary Tables
- Appendix J – Primary Research Participant List (Anonymized)
- Appendix K – Primary Research Questionnaire Framework
- Appendix L – Data Sources & Bibliography
- Appendix M – Market Size Divergence & Source Comparison
Chapter 17. Research Methodology
- 17.1 Research Framework & Philosophy
- 17.2 Secondary Research – Sources, Hierarchy & Data Extraction
- 17.3 Data Modeling – Bottom-Up & Top-Down Market Sizing
- 17.4 Primary Research – Stakeholder Framework, LOI & Sample Sizes
- 17.5 Forecast Methodology – Regression, Scenario & Sensitivity Analysis
- 17.6 Quality Control – Four-Layer Validation Framework
- 17.7 Limitations & Standard Assumptions
- 17.8 Disclaimer
