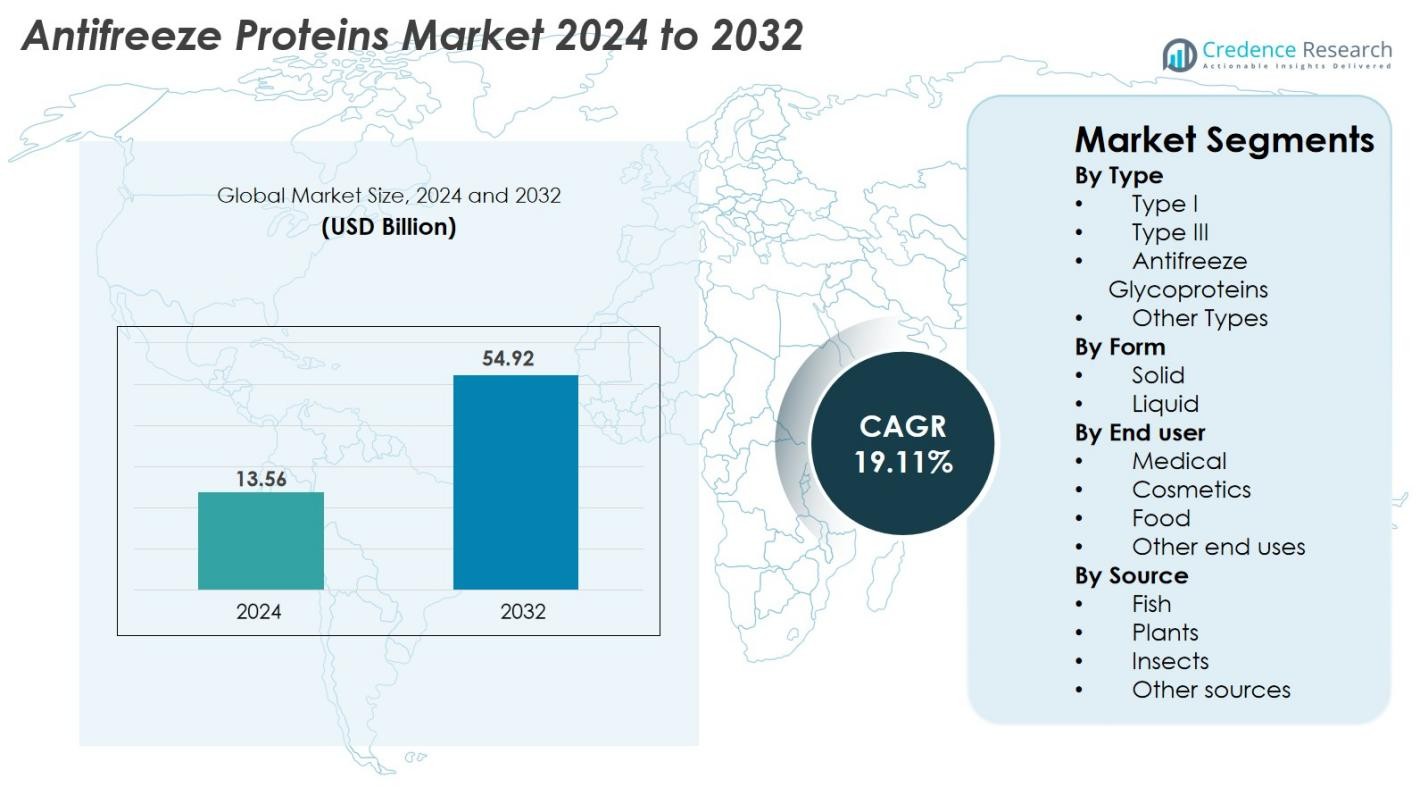
Home » Food & Beverage » Antifreeze Proteins Market

Antifreeze Proteins Market By Type (Type I, Type III, Antifreeze Glycoprotein, and Others) By Form (Solid and Liquid) By Source (Fish and Others) By End-Use (Medical, Food, Cosmetics, and Others)-Growth, Future Prospects & Competitive Analysis, 2016 – 2028

Price: $4999

Published: | Report ID: 15683 | Report Format : PDF

Key Highlights of the report

How are the major segments performing in the Antifreeze Proteins market?

  • In 2022, the solid form segment accounted for the largest revenue share of the market due to the ease of availability in solid form from the source of origin. They are frequently utilized in the food industry, including frozen foods, ice cream, frozen fish, and meats. The solid form is also better suited for frozen food applications as it has a longer shelf life than the liquid form.
  • As they are derived on a larger scale from fish, the type I segment was expected to hold a significant global antifreeze proteins market share in 2022. Additionally, the Type I antifreeze protein’s DNA sequence can be readily found for research purposes and is widely accessible.
  • In 2022, the medical end-use segment contributed the most revenue to the global antifreeze proteins market. This is due to increased R&D from biotechnology and pharmaceutical companies and ongoing global research for COVID-19 vaccinations.
  • The fish source segment had the highest revenue share in the global market in 2022. The easy availability and simplicity of the extraction process of antifreeze proteins from fish are the major drivers of the market’s growth in this segment.

What is the Market Size of Antifreeze Proteins regarding value?

The global antifreeze proteins market is projected to grow at a substantial CAGR of 28.25% over the coming years. The global Antifreeze Proteins industry was estimated to be worth USD 6.6 million in 2022 and was expected to be worth USD 37.66 million by 2028.

Design Element 2

Access crucial information at unmatched prices!

Request your free sample report today & start making informed decisions powered by Credence Research!

Download Free Sample
CTA Design Element 3

Which region dominated the antifreeze proteins market?

In 2022, the North American region was anticipated to hold a major share of the global antifreeze proteins market. North America has a well-established antifreeze proteins market with numerous players, leading to product development and technology advancements. Additionally, the region has a robust biotechnology and pharmaceutical industry with a considerable focus on research and development in this field. North America also benefits from a favorable regulatory environment that supports innovation and the creation of new products, which creates a conducive market for antifreeze proteins and stimulates investment in research and development. As further research uncovers the potential benefits of antifreeze proteins, their applications and advantages are becoming increasingly recognized, driving up demand and fueling the regional market growth.

How is US Market Performing in the antifreeze proteins market?

North America currently leads the market for global antifreeze proteins, with the United States accounting for the largest revenue share. Several prominent companies in the US market, including Unilever, DowDuPont, and Kaneka Corporation, are pushing forward with the creation and uptake of innovative new products and technologies. A rising need for antifreeze proteins in various applications, such as frozen foods and beverages, organ transplants, and biopreservation, also fuels this growth. Moreover, the regulatory environment in the US is favorable to innovation and the development of novel products, prompting increased investment in research and development for antifreeze proteins.

How is the economy impacting global antifreeze proteins growth?

The growth of the global antifreeze proteins market can be significantly affected by the state of the economy. If a recession is imminent or ongoing, companies may reduce their investment in research and development, which could lead to a slowdown in innovation and product development in the antifreeze proteins market. Additionally, consumers may become more cautious with their spending, which could decrease the demand for high-value products like antifreeze proteins. The antifreeze proteins market may also be impacted by inflation, which may increase production and transportation costs, leading to higher prices for antifreeze proteins and reduced demand. The ongoing Russia-Ukraine War could also negatively affect the antifreeze proteins market. Many key players are located in Europe, and disruptions in the supply chain and transportation networks may impact the availability and pricing of antifreeze proteins. The extent to which the economy will affect the antifreeze proteins market depends on the magnitude and duration of the economic challenges that businesses and consumers face.

What is the competitive environment of the antifreeze proteins market?

The antifreeze proteins market is characterized by intense competition among key players striving to capture a larger global market share. These market players are implementing various strategic initiatives, such as partnerships, collaborations, product launches, and acquisitions, to strengthen their market position. Leading players in the market include Unilever, AquaBounty Technologies, Kaneka Corporation, Sirona Biochem, and Protokinetix. These companies are actively investing in research and development to create novel and environmentally friendly antifreeze protein products to fulfill the changing demands of their customers. For instance, Kaneka Corporation recently unveiled its latest plant-based antifreeze protein product, Kaneka Antifreeze ABP, to meet the growing demand for sustainable and green antifreeze products.

Executive Summary

What are the key trends in the Antifreeze Proteins market?

  • Rising global adoption in various industries: The need for antifreeze proteins is increasing in various industries like frozen food and drinks, organ transplantation, biopreservation, and medicine and cosmetics. This is driven by the unique properties of antifreeze proteins that help protect cells and tissues from freezing damage, extending their viability and shelf life. Moreover, the market growth is expected to be driven in the upcoming years by the increasing utilization of antifreeze proteins in ice creams and yogurts.

What are all the technical developments in the Antifreeze Proteins Market?

The global antifreeze proteins market has witnessed several technological advancements in recent years. Biotechnology has emerged as a significant development, allowing for producing more efficient and sustainable antifreeze proteins using genetically modified organisms. Antifreeze proteins have been increasingly used in cryopreservation, which involves freezing biological samples for long-term storage. This application of antifreeze proteins has the potential to revolutionize biobanking by improving the efficiency and effectiveness of cryopreservation techniques. In 2021, AquaBounty Technologies achieved a significant milestone by successfully cryopreserving genetically modified salmon using antifreeze proteins, indicating a major advancement in using antifreeze proteins for cryopreservation.

Which are the key investments by the antifreeze proteins market players?

Major players in the antifreeze protein industry are investing heavily to expand their market share and create new products. AquaBounty Technologies, for example, recently revealed a financing agreement of USD 200 million with Intrexon Corporation in March 2021. The funds will support the company’s production of genetically modified salmon, which employs antifreeze proteins to enable the fish to grow faster in colder waters. Likewise, Sirona Biochem declared in December 2021 a financing agreement of USD 10 million with a group of institutional investors. The funds will be employed to facilitate the creation and commercialization of the company’s lineup of innovative antifreeze protein products, including a new product designed for the cryopreservation of stem cells.

Some major global antifreeze proteins market players are Rishon Biochem Co. Ltd, Unilever, Kaneka Corporation, Nichirei Corporation, Sirona Biochem, ProtoKinetix Inc, Shanghai Yu Tao Industrial Co. Ltd, Kodera Herb Garden Co. Ltd, and Beijing Huacheng Jinke Technology Co. Ltd.

Antifreeze Proteins Market

What are the Major Driving Factors for the Antifreeze Proteins Market?

The antifreeze proteins market is driven by several key factors, including increasing demand from various end-use industries such as food, cosmetics, and medicine, constantly looking for innovative and efficient ways to preserve their products. Moreover, the growing popularity of bio-based antifreeze proteins, which are eco-friendly and non-toxic, over conventional petroleum-based antifreeze products, is also propelling the market growth. The increasing awareness and adoption of antifreeze proteins in various applications, such as cold storage and transportation, frozen food, and cryosurgery, further expand the global market. Another significant factor driving the market growth is the rise in research and development activities undertaken by key players to create new and advanced antifreeze proteins that cater to the evolving needs of end-use industries. The increasing demand for antifreeze proteins in emerging economies, particularly in Asia, also drives the market growth. Furthermore, the rise in government initiatives and funding to promote sustainable and environmentally friendly products is expected to provide significant growth opportunities for the antifreeze proteins market over the upcoming years.

What are the Major Risks for the Antifreeze Proteins Market?

One of the key restraints is the high cost of production, which makes antifreeze proteins relatively expensive compared to conventional antifreeze products. This can limit their adoption in some applications, particularly in price-sensitive markets. Another major restraint is the limited availability of raw materials to produce antifreeze proteins. The isolation and extraction of these proteins from natural sources can be challenging and expensive, leading to supply constraints and potentially higher costs. Additionally, the regulatory landscape for antifreeze proteins can also act as a restraint, as companies need to comply with various regulations and standards to ensure the efficacy and safety of their products. The lack of standardized testing methods and validation protocols for antifreeze proteins can also hinder their commercialization and adoption.

Which is the key form in the antifreeze proteins market?

The solid segment will hold a major share of the global antifreeze proteins market over the forecasted period. Antifreeze proteins (AFPs) in their solid form have multiple uses in different industries, including medical, food, and agriculture. AFPs are natural substances that can function as antifreeze agents, enabling organisms to survive in frigid environments. The demand for AFPs is increasing because of the escalating necessity for natural antifreeze agents across various sectors. The market for AFPs is expanding due to recent advancements in research and development of antifreeze proteins, which have unveiled new applications for AFPs.

How is the antifreeze proteins market performing in regions?

During the forecast period, the Asia Pacific region is anticipated to witness the fastest growth in the global antifreeze proteins market. The primary reason for the industry’s growth is that a significant amount of marine capture and aquaculture production is taking place in the region. Moreover, the industry is experiencing growth due to increasing demand from the medicine and cosmetic sectors for antifreeze proteins. The market expansion is also supported by top vaccine manufacturers in the region, utilizing antifreeze proteins to produce vaccines. The trend in China toward consuming sashimi-smoked products is also driving the market’s growth.

What is the regulatory landscape for the antifreeze proteins market?

The regulatory framework for the antifreeze proteins market consists of a range of laws and regulations that govern the manufacturing, marketing, and distribution of antifreeze proteins to ensure their safety and effectiveness for use in both human and animal applications. These regulations differ by country and region; in the United States, the FDA regulates the use of antifreeze proteins in food and drugs, while the Environmental Protection Agency (EPA) regulates their use in pesticides and other industrial applications. In the European Union, the Food Safety Authority (EFSA) is responsible for assessing the safety and effectiveness of antifreeze proteins for use in food and animal feed. Other countries and regions have their regulatory agencies overseeing antifreeze proteins. Companies operating in the antifreeze proteins market must comply with these regulations to ensure their products are safe and comply with the law.

Shape Your Report to Specific Countries or Regions & Enjoy 30% Off!

What are the major players planning for the future of the antifreeze proteins market?

As the antifreeze proteins market continues to grow, major players are implementing different strategies to expand their market share and strengthen their position in the industry. These strategies include expanding their product offerings, investing in research and development, and forming strategic partnerships and collaborations. For instance, Unilever, a key player in the antifreeze proteins market, plans to enhance its plant-based antifreeze product line. The company has pledged to invest €1 billion in a new initiative to create sustainable alternatives and replace petroleum-based components in its home care and personal care products. Another example is Ageria, a Danish biotech company recently partnered with Novo Nordisk, a pharmaceutical company. This partnership aims to develop innovative antifreeze proteins for pharmaceutical use, such as in the cryopreservation of tissues and cells. These and other significant players are actively investing in developing new and advanced antifreeze protein products to cater to the changing demands of customers and expand their market share.

REPORT ATTRIBUTE DETAILS
Antifreeze Proteins Market by Volume Yes
Antifreeze Proteins Market by Value Yes
Antifreeze Proteins Market, Tornado Analysis Yes
Antifreeze Proteins Market, STAR Analysis Yes
Antifreeze Proteins Market, SRC Analysis Yes
Antifreeze Proteins Market, Import-Export Data Yes (On Demand)
Antifreeze Proteins Market Pricing Analysis Yes (On Demand)
Antifreeze Proteins Market Segment Analysis By Type (Type I, Type III, Antifreeze Glycoprotein, and Others)

By Form (Solid and Liquid)

By Source (Fish and Others)

By End-Use (Medical, Food, Cosmetics, and Others)

Antifreeze Proteins Market, Regional Analysis North America (US and Canada)

Europe (Spain, Germany, UK, France, Italy, and the Rest of Europe)

Asia Pacific (Japan, India, South Korea, China, South East Asia, and the Rest of Asia Pacific)

Latin America (Brazil, Mexico, and the Rest of Latin America)

Middle East and Africa (GCC Countries, South Africa, and the Rest of the Middle East and Africa)

Antifreeze Proteins Market Key Companies Rishon Biochem Co. Ltd, Unilever, Kaneka Corporation, Nichirei Corporation, Sirona Biochem, ProtoKinetix Inc, Shanghai Yu Tao Industrial Co. Ltd, Kodera Herb Garden Co. Ltd, Beijing Huacheng Jinke Technology Co. Ltd
Antifreeze Proteins Market Competitive Landscape Market Share Analysis

Competitive Benchmarking

Key Players Market Positioning

Geographical Presence Analysis

Major Strategies Adopted

Segmentation of Global Antifreeze Proteins Market-

Global Antifreeze Proteins Market – By Type

  • Type I
  • Type III
  • Antifreeze Glycoprotein
  • Others

Global Antifreeze Proteins Market – By Form

  • Solid
  • Liquid

Global Antifreeze Proteins Market – By End-Use

  • Medical
  • Food
  • Cosmetics
  • Others

Global Antifreeze Proteins Market – By Source

  • Fish
  • Others

Global Antifreeze Proteins Market – By Region

  • North America
    • U.S.
    • Canada
  • Europe
    • Germany
    • France
    • U.K.
    • Italy
    • Spain
    • Rest of Europe
  • Asia Pacific
    • China
    • Japan
    • India
    • South Korea
    • South-east Asia
    • Rest of Asia Pacific
  • Latin America
    • Brazil
    • Mexico
    • Rest of Latin America
  • Middle East & Africa
    • GCC Countries
    • South Africa
    • Rest of the Middle East and Africa

1. Preface
1.1. Report Description
1.1.1. Purpose of the Report
1.1.2. Target Audience
1.1.3. USP and Key Offerings
1.2. Research Scope
1.3. Research Methodology
1.3.1. Phase I – Secondary Research
1.3.2. Phase II – Primary Research
1.3.3. Phase III – Expert Panel Review
1.3.4. Approach Adopted
1.3.4.1. Top-Down Approach
1.3.4.2. Bottom-Up Approach
1.3.5. Assumptions
1.4. Market Introduction
1.5. Market Research Scope

2. Executive Summary
2.1. Market Snapshot: Global Antifreeze Proteins Market
2.2. Global Antifreeze Proteins Market, By Form
2.3. Global Antifreeze Proteins Market, By Source
2.4. Global Antifreeze Proteins Market, By Type
2.5. Global Antifreeze Proteins Market, By End-Use
2.6. Global Antifreeze Proteins Market, By Region

3. Market Dynamics & Factors Analysis
3.1. Introduction
3.1.1. Global Antifreeze Proteins Market Value, 2017-2030, (US$ Mn)
3.1.2. Y-o-Y Growth Trend Analysis
3.2. Market Dynamics
3.2.1. Market Drivers
3.2.2. Market Restraints
3.2.3. Market Opportunities
3.2.4. Major Industry Challenges
3.3. Growth and Development Patterns
3.4. Investment Feasibility Analysis
3.5. Market Opportunity Analysis
3.5.1. Form
3.5.2. Source
3.5.3. Type
3.5.4. End-Use
3.5.5. Geography

4. Premium Insights
4.1. STAR (Situation, Task, Action, Results) Analysis
4.2. Porter’s Five Forces Analysis
4.2.1. Threat of New Entrants
4.2.2. Bargaining Power of Buyers/Consumers
4.2.3. Bargaining Power of Suppliers
4.2.4. Threat of Substitute Types
4.2.5. Intensity of Competitive Rivalry
4.3. Key Market Trends
4.3.1. Demand Side Trends
4.3.2. Supply Side Trends
4.4. Value Chain Analysis
4.5. Technology Analysis
4.6. Analysis and Recommendations
4.7. Marketing Strategy Analysis
4.7.1. Direct Marketing
4.7.2. Indirect Marketing
4.7.3. Marketing Channel Development Trend

5. Market Positioning of Key Players, 2022
5.1. Company Market Share of Key Players, 2022
5.2. Competitive Benchmarking
5.3. Market Positioning of Key Vendors
5.4. Geographical Presence Analysis
5.5. Major Strategies Adopted by Key Players
5.5.1. Key Strategies Analysis
5.5.2. Mergers and Acquisitions
5.5.3. Partnerships
5.5.4. Product Launch
5.5.5. Geographical Expansion
5.5.6. Others

6. Economic Impact Analysis
6.1. Recession Impact
6.1.1. North America
6.1.2. Europe
6.1.3. Asia Pacific
6.1.4. Latin America
6.1.5. Middle East and Africa
6.2. Ukraine-Russia War Impact
6.2.1. North America
6.2.2. Europe
6.2.3. Asia Pacific
6.2.4. Latin America
6.2.5. Middle East and Africa
6.3. COVID-19 Impact Analysis
6.3.1. North America
6.3.2. Europe
6.3.3. Asia Pacific
6.3.4. Latin America
6.3.5. Middle East and Africa

7. Global Antifreeze Proteins Market
7.1. Global Antifreeze Proteins Market, by Form, 2017-2030(US$ Mn)
7.1.1. Overview
7.1.2. Global Antifreeze Proteins Market, By Form, 2022 vs 2030 (in%)
7.1.3. Global Antifreeze Proteins Market, By Solid, 2017-2030 (US$ Mn)
7.1.4. Global Antifreeze Proteins Market, By Liquid, 2017-2030 (US$ Mn)
7.2. Global Antifreeze Proteins Market, by Source, 2017-2030(US$ Mn)
7.2.1. Overview
7.2.2. Global Antifreeze Proteins Market, By Source, 2022 vs 2030 (in%)
7.2.3. Global Antifreeze Proteins Market, By Fish, 2017-2030 (US$ Mn)
7.2.4. Global Antifreeze Proteins Market, By Others, 2017-2030 (US$ Mn)
7.3. Global Antifreeze Proteins Market, by Type, 2017-2030(US$ Mn)
7.3.1. Overview
7.3.2. Global Antifreeze Proteins Market, By Type, 2022 vs 2030 (in%)
7.3.3. Global Antifreeze Proteins Market, By Type I, 2017-2030 (US$ Mn)
7.3.4. Global Antifreeze Proteins Market, By Type III, 2017-2030 (US$ Mn)
7.3.5. Global Antifreeze Proteins Market, By Antifreeze Glycoprotein, 2017-2030 (US$ Mn)
7.3.6. Global Antifreeze Proteins Market, By Others, 2017-2030 (US$ Mn)
7.4. Global Antifreeze Proteins Market, by End-Use, 2017-2030(US$ Mn)
7.4.1. Overview
7.4.2. Global Antifreeze Proteins Market, By End-Use, 2022 vs 2030 (in%)
7.4.3. Global Antifreeze Proteins Market, By Medical, 2017-2030 (US$ Mn)
7.4.4. Global Antifreeze Proteins Market, By Food, 2017-2030 (US$ Mn)
7.4.5. Global Antifreeze Proteins Market, By Cosmetics, 2017-2030 (US$ Mn)
7.4.6. Global Antifreeze Proteins Market, By Others, 2017-2030 (US$ Mn)

8. North America Antifreeze Proteins Market Analysis
8.1. North America Antifreeze Proteins Market, by Form, 2017-2030(US$ Mn)
8.1.1. Overview
8.1.2. SRC Analysis
8.2. North America Antifreeze Proteins Market, by Source, 2017-2030(US$ Mn)
8.2.1. Overview
8.2.2. SRC Analysis
8.3. North America Antifreeze Proteins Market, by Type, 2017-2030(US$ Mn)
8.3.1. Overview
8.3.2. SRC Analysis
8.4. North America Antifreeze Proteins Market, by End-Use, 2017-2030(US$ Mn)
8.4.1. Overview
8.4.2. SRC Analysis
8.5. North America Antifreeze Proteins Market, by Country, 2017-2030 (US$ Mn)
8.5.1. U.S.
8.5.1.1. U.S. Antifreeze Proteins Market Estimates and Forecast, 2017-2030 (US$ Mn)
8.5.1.2. U.S. Antifreeze Proteins, By Form, 2017-2030 (US$ Mn)
8.5.1.3. U.S. Antifreeze Proteins, By Source, 2017-2030 (US$ Mn)
8.5.1.4. U.S. Antifreeze Proteins, By Type, 2017-2030 (US$ Mn)
8.5.1.5. U.S. Antifreeze Proteins, By End-Use, 2017-2030 (US$ Mn)
8.5.2. Canada
8.5.2.1. Canada Antifreeze Proteins Market Estimates and Forecast, 2017-2030 (US$ Mn)
8.5.2.2. Canada Antifreeze Proteins, By Form, 2017-2030 (US$ Mn)
8.5.2.3. Canada Antifreeze Proteins, By Source, 2017-2030 (US$ Mn)
8.5.2.4. Canada Antifreeze Proteins, By Type, 2017-2030 (US$ Mn)
8.5.2.5. Canada Antifreeze Proteins, By End-Use, 2017-2030 (US$ Mn)

9. Europe Antifreeze Proteins Market Analysis
9.1. Europe Antifreeze Proteins Market, by Form, 2017-2030(US$ Mn)
9.1.1. Overview
9.1.2. SRC Analysis
9.2. Europe Antifreeze Proteins Market, by Source, 2017-2030(US$ Mn)
9.2.1. Overview
9.2.2. SRC Analysis
9.3. Europe Antifreeze Proteins Market, by Type, 2017-2030(US$ Mn)
9.3.1. Overview
9.3.2. SRC Analysis
9.4. Europe Antifreeze Proteins Market, by End-Use, 2017-2030(US$ Mn)
9.4.1. Overview
9.4.2. SRC Analysis
9.5. Europe Antifreeze Proteins Market, by Country, 2017-2030 (US$ Mn)
9.5.1. Germany
9.5.1.1. Germany Antifreeze Proteins Market Estimates and Forecast, 2017-2030 (US$ Mn)
9.5.1.2. Germany Antifreeze Proteins, By Form, 2017-2030 (US$ Mn)
9.5.1.3. Germany Antifreeze Proteins, By Source, 2017-2030 (US$ Mn)
9.5.1.4. Germany Antifreeze Proteins, By Type, 2017-2030 (US$ Mn)
9.5.1.5. Germany Antifreeze Proteins, By End-Use, 2017-2030 (US$ Mn)
9.5.2. France
9.5.2.1. France Antifreeze Proteins Market Estimates and Forecast, 2017-2030 (US$ Mn)
9.5.2.2. France Antifreeze Proteins, By Form, 2017-2030 (US$ Mn)
9.5.2.3. France Antifreeze Proteins, By Source, 2017-2030 (US$ Mn)
9.5.2.4. France Antifreeze Proteins, By Type, 2017-2030 (US$ Mn)
9.5.2.5. France Antifreeze Proteins, By End-Use, 2017-2030 (US$ Mn)
9.5.3. UK
9.5.3.1. UK Antifreeze Proteins Market Estimates and Forecast, 2017-2030 (US$ Mn)
9.5.3.2. UK Antifreeze Proteins, By Form, 2017-2030 (US$ Mn)
9.5.3.3. UK Antifreeze Proteins, By Source, 2017-2030 (US$ Mn)
9.5.3.4. UK Antifreeze Proteins, By Type, 2017-2030 (US$ Mn)
9.5.3.5. UK Antifreeze Proteins, By End-Use, 2017-2030 (US$ Mn)
9.5.4. Italy
9.5.4.1. Italy Antifreeze Proteins Market Estimates and Forecast, 2017-2030 (US$ Mn)
9.5.4.2. Italy Antifreeze Proteins, By Form, 2017-2030 (US$ Mn)
9.5.4.3. Italy Antifreeze Proteins, By Source, 2017-2030 (US$ Mn)
9.5.4.4. Italy Antifreeze Proteins, By Type, 2017-2030 (US$ Mn)
9.5.4.5. Italy Antifreeze Proteins, By End-Use, 2017-2030 (US$ Mn)
9.5.5. Spain
9.5.5.1. Spain Antifreeze Proteins Market Estimates and Forecast, 2017-2030 (US$ Mn)
9.5.5.2. Spain Antifreeze Proteins, By Form, 2017-2030 (US$ Mn)
9.5.5.3. Spain Antifreeze Proteins, By Source, 2017-2030 (US$ Mn)
9.5.5.4. Spain Antifreeze Proteins, By Type, 2017-2030 (US$ Mn)
9.5.5.5. Spain Antifreeze Proteins, By End-Use, 2017-2030 (US$ Mn)
9.5.6. Rest of Europe
9.5.6.1. Rest of Europe Antifreeze Proteins Market Estimates and Forecast, 2017-2030 (US$ Mn)
9.5.6.2. Rest of Europe Antifreeze Proteins, By Form, 2017-2030 (US$ Mn)
9.5.6.3. Rest of Europe Antifreeze Proteins, By Source, 2017-2030 (US$ Mn)
9.5.6.4. Rest of Europe Antifreeze Proteins, By Type, 2017-2030 (US$ Mn)
9.5.6.5. Rest of Europe Antifreeze Proteins, By End-Use, 2017-2030 (US$ Mn)

10. Asia Pacific Antifreeze Proteins Market Analysis
10.1. Asia Pacific Antifreeze Proteins Market, by Form, 2017-2030(US$ Mn)
10.1.1. Overview
10.1.2. SRC Analysis
10.2. Asia Pacific Antifreeze Proteins Market, by Source, 2017-2030(US$ Mn)
10.2.1. Overview
10.2.2. SRC Analysis
10.3. Asia Pacific Antifreeze Proteins Market, by Type, 2017-2030(US$ Mn)
10.3.1. Overview
10.3.2. SRC Analysis
10.4. Asia Pacific Antifreeze Proteins Market, by End-Use, 2017-2030(US$ Mn)
10.4.1. Overview
10.4.2. SRC Analysis
10.5. Asia Pacific Antifreeze Proteins Market, by Country, 2017-2030 (US$ Mn)
10.5.1. China
10.5.1.1. China Antifreeze Proteins Market Estimates and Forecast, 2017-2030 (US$ Mn)
10.5.1.2. China Antifreeze Proteins, By Form, 2017-2030 (US$ Mn)
10.5.1.3. China Antifreeze Proteins, By Source, 2017-2030 (US$ Mn)
10.5.1.4. China Antifreeze Proteins, By Type, 2017-2030 (US$ Mn)
10.5.1.5. China Antifreeze Proteins, By End-Use, 2017-2030 (US$ Mn)
10.5.2. Japan
10.5.2.1. Japan Antifreeze Proteins Market Estimates and Forecast, 2017-2030 (US$ Mn)
10.5.2.2. Japan Antifreeze Proteins, By Form, 2017-2030 (US$ Mn)
10.5.2.3. Japan Antifreeze Proteins, By Source, 2017-2030 (US$ Mn)
10.5.2.4. Japan Antifreeze Proteins, By Type, 2017-2030 (US$ Mn)
10.5.2.5. Japan Antifreeze Proteins, By End-Use, 2017-2030 (US$ Mn)
10.5.3. India
10.5.3.1. India Antifreeze Proteins Market Estimates and Forecast, 2017-2030 (US$ Mn)
10.5.3.2. India Antifreeze Proteins, By Form, 2017-2030 (US$ Mn)
10.5.3.3. India Antifreeze Proteins, By Source, 2017-2030 (US$ Mn)
10.5.3.4. India Antifreeze Proteins, By Type, 2017-2030 (US$ Mn)
10.5.3.5. India Antifreeze Proteins, By End-Use, 2017-2030 (US$ Mn)
10.5.4. South Korea
10.5.4.1. South Korea Antifreeze Proteins Market Estimates and Forecast, 2017-2030 (US$ Mn)
10.5.4.2. South Korea Antifreeze Proteins, By Form, 2017-2030 (US$ Mn)
10.5.4.3. South Korea Antifreeze Proteins, By Source, 2017-2030 (US$ Mn)
10.5.4.4. South Korea Antifreeze Proteins, By Type, 2017-2030 (US$ Mn)
10.5.4.5. South Korea Antifreeze Proteins, By End-Use, 2017-2030 (US$ Mn)
10.5.5. South-East Asia
10.5.5.1. South-East Asia Antifreeze Proteins Market Estimates and Forecast, 2017-2030 (US$ Mn)
10.5.5.2. South-East Asia Antifreeze Proteins, By Form, 2017-2030 (US$ Mn)
10.5.5.3. South-East Asia Antifreeze Proteins, By Source, 2017-2030 (US$ Mn)
10.5.5.4. South-East Asia Antifreeze Proteins, By Type, 2017-2030 (US$ Mn)
10.5.5.5. South-East Asia Antifreeze Proteins, By End-Use, 2017-2030 (US$ Mn)
10.5.6. Rest of Asia Pacific
10.5.6.1. Rest of Asia Pacific Antifreeze Proteins Market Estimates and Forecast, 2017-2030 (US$ Mn)
10.5.6.2. Rest of Asia Pacific Antifreeze Proteins, By Form, 2017-2030 (US$ Mn)
10.5.6.3. Rest of Asia Pacific Antifreeze Proteins, By Source, 2017-2030 (US$ Mn)
10.5.6.4. Rest of Asia Pacific Antifreeze Proteins, By Type, 2017-2030 (US$ Mn)
10.5.6.5. Rest of Asia Pacific Antifreeze Proteins, By End-Use, 2017-2030 (US$ Mn)

11. Latin America Antifreeze Proteins Market Analysis
11.1. Latin America Antifreeze Proteins Market, by Form, 2017-2030(US$ Mn)
11.1.1. Overview
11.1.2. SRC Analysis
11.2. Latin America Antifreeze Proteins Market, by Source, 2017-2030(US$ Mn)
11.2.1. Overview
11.2.2. SRC Analysis
11.3. Latin America Antifreeze Proteins Market, by Type, 2017-2030(US$ Mn)
11.3.1. Overview
11.3.2. SRC Analysis
11.4. Latin America Antifreeze Proteins Market, by End-Use, 2017-2030(US$ Mn)
11.4.1. Overview
11.4.2. SRC Analysis
11.5. Latin America Antifreeze Proteins Market, by Country, 2017-2030 (US$ Mn)
11.5.1. Brazil
11.5.1.1. Brazil Antifreeze Proteins Market Estimates and Forecast, 2017-2030 (US$ Mn)
11.5.1.2. Brazil Antifreeze Proteins, By Form, 2017-2030 (US$ Mn)
11.5.1.3. Brazil Antifreeze Proteins, By Source, 2017-2030 (US$ Mn)
11.5.1.4. Brazil Antifreeze Proteins, By Type, 2017-2030 (US$ Mn)
11.5.1.5. Brazil Antifreeze Proteins, By End-Use, 2017-2030 (US$ Mn)
11.5.2. Mexico
11.5.2.1. Mexico Antifreeze Proteins Market Estimates and Forecast, 2017-2030 (US$ Mn)
11.5.2.2. Mexico Antifreeze Proteins, By Form, 2017-2030 (US$ Mn)
11.5.2.3. Mexico Antifreeze Proteins, By Source, 2017-2030 (US$ Mn)
11.5.2.4. Mexico Antifreeze Proteins, By Type, 2017-2030 (US$ Mn)
11.5.2.5. Mexico Antifreeze Proteins, By End-Use, 2017-2030 (US$ Mn)
11.5.3. Rest of Latin America
11.5.3.1. Rest of Latin America Antifreeze Proteins Market Estimates and Forecast, 2017-2030 (US$ Mn)
11.5.3.2. Rest of Latin America Antifreeze Proteins, By Form, 2017-2030 (US$ Mn)
11.5.3.3. Rest of Latin America Antifreeze Proteins, By Source, 2017-2030 (US$ Mn)
11.5.3.4. Rest of Latin America Antifreeze Proteins, By Type, 2017-2030 (US$ Mn)
11.5.3.5. Rest of Latin America Antifreeze Proteins, By End-Use, 2017-2030 (US$ Mn)

12. Middle East and Africa Antifreeze Proteins Market Analysis
12.1. Middle East and Africa Antifreeze Proteins Market, by Form, 2017-2030(US$ Mn)
12.1.1. Overview
12.1.2. SRC Analysis
12.2. Middle East and Africa Antifreeze Proteins Market, by Source, 2017-2030(US$ Mn)
12.2.1. Overview
12.2.2. SRC Analysis
12.3. Middle East and Africa Antifreeze Proteins Market, by Type, 2017-2030(US$ Mn)
12.3.1. Overview
12.3.2. SRC Analysis
12.4. Middle East and Africa Antifreeze Proteins Market, by End-Use, 2017-2030(US$ Mn)
12.4.1. Overview
12.4.2. SRC Analysis
12.5. Middle East and Africa Antifreeze Proteins Market, by Country, 2017-2030 (US$ Mn)
12.5.1. GCC Countries
12.5.1.1. GCC Countries Antifreeze Proteins Market Estimates and Forecast, 2017-2030 (US$ Mn)
12.5.1.2. GCC Countries Antifreeze Proteins, By Form, 2017-2030 (US$ Mn)
12.5.1.3. GCC Countries Antifreeze Proteins, By Source, 2017-2030 (US$ Mn)
12.5.1.4. GCC Countries Antifreeze Proteins, By Type, 2017-2030 (US$ Mn)
12.5.1.5. GCC Countries Antifreeze Proteins, By End-Use, 2017-2030 (US$ Mn)
12.5.2. South Africa
12.5.2.1. South Africa Antifreeze Proteins Market Estimates and Forecast, 2017-2030 (US$ Mn)
12.5.2.2. South Africa Antifreeze Proteins, By Form, 2017-2030 (US$ Mn)
12.5.2.3. South Africa Antifreeze Proteins, By Source, 2017-2030 (US$ Mn)
12.5.2.4. South Africa Antifreeze Proteins, By Type, 2017-2030 (US$ Mn)
12.5.2.5. South Africa Antifreeze Proteins, By End-Use, 2017-2030 (US$ Mn)
12.5.3. Rest of Middle East and Africa
12.5.3.1. Rest of Middle East and Africa Antifreeze Proteins Market Estimates and Forecast, 2017-2030 (US$ Mn)
12.5.3.2. Rest of Middle East and Africa Antifreeze Proteins, By Form, 2017-2030 (US$ Mn)
12.5.3.3. Rest of Middle East and Africa Antifreeze Proteins, By Source, 2017-2030 (US$ Mn)
12.5.3.4. Rest of Middle East and Africa Antifreeze Proteins, By Type, 2017-2030 (US$ Mn)
12.5.3.5. Rest of Middle East and Africa Antifreeze Proteins, By End-Use, 2017-2030 (US$ Mn)

13. Company Profiles
13.1. Unilever
13.1.1. Company Overview
13.1.2. Products/Services Portfolio
13.1.3. Geographical Presence
13.1.4. Financial Summary
13.1.4.1. Market Revenue and Net Profit (2019-2022)
13.1.4.2. Business Segment Revenue Analysis
13.1.4.3. Geographical Revenue Analysis
13.2. Kaneka Corporation
13.3. Nichirei Corporation
13.4. Rishon Biochem Co. Ltd
13.5. Sirona Biochem
13.6. ProtoKinetix Inc
13.7. Shanghai Yu Tao Industrial Co. Ltd
13.8. Kodera Herb Garden Co. Ltd
13.9. Beijing Huacheng Jinke Technology Co. Ltd
13.10. Others

List of Figures
FIG. 1 Global Antifreeze Proteins Market: Research Methodology
FIG. 2 Market Size Estimation – Top Down & Bottom up Approach
FIG. 3 Global Antifreeze Proteins Market Segmentation
FIG. 4 Global Antifreeze Proteins Market, by Form, 2022 (US$ Mn)
FIG. 5 Global Antifreeze Proteins Market, by Source, 2022 (US$ Mn)
FIG. 6 Global Antifreeze Proteins Market, by Type, 2022 (US$ Mn)
FIG. 7 Global Antifreeze Proteins Market, by End-Use, 2022 (US$ Mn)
FIG. 8 Global Antifreeze Proteins Market, by Geography, 2022 (US$ Mn)
FIG. 9 Attractive Investment Proposition, by Form, 2022
FIG. 10 Attractive Investment Proposition, by Source, 2022
FIG. 11 Attractive Investment Proposition, by Type, 2022
FIG. 12 Attractive Investment Proposition, by End-Use, 2022
FIG. 13 Attractive Investment Proposition, by Geography, 2022
FIG. 14 Global Market Share Analysis of Key Antifreeze Proteins Market Manufacturers, 2022
FIG. 15 Global Market Positioning of Key Antifreeze Proteins Market Manufacturers, 2022
FIG. 16 Global Antifreeze Proteins Market Value Contribution, By Form, 2022 & 2030 (Value %)
FIG. 17 Global Antifreeze Proteins Market, by Solid, Value, 2017-2030 (US$ Mn)
FIG. 18 Global Antifreeze Proteins Market, by Liquid, Value, 2017-2030 (US$ Mn)
FIG. 19 Global Antifreeze Proteins Market Value Contribution, By Source, 2022 & 2030 (Value %)
FIG. 20 Global Antifreeze Proteins Market, by Fish, Value, 2017-2030 (US$ Mn)
FIG. 21 Global Antifreeze Proteins Market, by Others, Value, 2017-2030 (US$ Mn)
FIG. 22 Global Antifreeze Proteins Market Value Contribution, By Type, 2022 & 2030 (Value %)
FIG. 23 Global Antifreeze Proteins Market, by Type I, Value, 2017-2030 (US$ Mn)
FIG. 24 Global Antifreeze Proteins Market, by Type III, Value, 2017-2030 (US$ Mn)
FIG. 25 Global Antifreeze Proteins Market, by Antifreeze Glycoprotein, Value, 2017-2030 (US$ Mn)
FIG. 26 Global Antifreeze Proteins Market, by Others, Value, 2017-2030 (US$ Mn)
FIG. 27 Global Antifreeze Proteins Market Value Contribution, By End-Use, 2022 & 2030 (Value %)
FIG. 28 Global Antifreeze Proteins Market, by Medical, Value, 2017-2030 (US$ Mn)
FIG. 29 Global Antifreeze Proteins Market, by Food, Value, 2017-2030 (US$ Mn)
FIG. 30 Global Antifreeze Proteins Market, by Cosmetics, Value, 2017-2030 (US$ Mn)
FIG. 31 Global Antifreeze Proteins Market, by Others, Value, 2017-2030 (US$ Mn)
FIG. 32 North America Antifreeze Proteins Market, 2017-2030 (US$ Mn)
FIG. 33 U.S. Antifreeze Proteins Market, 2017-2030 (US$ Mn)
FIG. 34 Canada Antifreeze Proteins Market, 2017-2030 (US$ Mn)
FIG. 35 Europe Antifreeze Proteins Market, 2017-2030 (US$ Mn)
FIG. 36 Germany Antifreeze Proteins Market, 2017-2030 (US$ Mn)
FIG. 37 France Antifreeze Proteins Market, 2017-2030 (US$ Mn)
FIG. 38 U.K. Antifreeze Proteins Market, 2017-2030 (US$ Mn)
FIG. 39 Italy Antifreeze Proteins Market, 2017-2030 (US$ Mn)
FIG. 40 Spain Antifreeze Proteins Market, 2017-2030 (US$ Mn)
FIG. 41 Rest of Europe Antifreeze Proteins Market, 2017-2030 (US$ Mn)
FIG. 42 Asia Pacific Antifreeze Proteins Market, 2017-2030 (US$ Mn)
FIG. 43 China Antifreeze Proteins Market, 2017-2030 (US$ Mn)
FIG. 44 Japan Antifreeze Proteins Market, 2017-2030 (US$ Mn)
FIG. 45 India Antifreeze Proteins Market, 2017-2030 (US$ Mn)
FIG. 46 South Korea Antifreeze Proteins Market, 2017-2030 (US$ Mn)
FIG. 47 Southeast Asia Antifreeze Proteins Market, 2017-2030 (US$ Mn)
FIG. 48 Rest of Asia Pacific Antifreeze Proteins Market, 2017-2030 (US$ Mn)
FIG. 49 Latin America Antifreeze Proteins Market, 2017-2030 (US$ Mn)
FIG. 50 Brazil Antifreeze Proteins Market, 2017-2030 (US$ Mn)
FIG. 51 Mexico Antifreeze Proteins Market, 2017-2030 (US$ Mn)
FIG. 52 Rest of Latin America Antifreeze Proteins Market, 2017-2030 (US$ Mn)
FIG. 53 Middle East & Africa Antifreeze Proteins Market, 2017-2030 (US$ Mn)
FIG. 54 GCC Countries Antifreeze Proteins Market, 2017-2030 (US$ Mn)
FIG. 55 South Africa Antifreeze Proteins Market, 2017-2030 (US$ Mn)
FIG. 56 Rest of Middle East and Africa Antifreeze Proteins Market, 2017-2030 (US$ Mn)

List of Tables
TABLE 1 Market Snapshot: Global Antifreeze Proteins Market
TABLE 2 Global Antifreeze Proteins Market, by Competitive Benchmarking, 2022
TABLE 3 Global Antifreeze Proteins Market, by Geographical Presence Analysis, 2022
TABLE 4 Global Antifreeze Proteins Market, by Key Strategies Analysis, 2022
TABLE 5 Global Antifreeze Proteins Market, by Form, 2017-2030 (US$ Mn)
TABLE 6 Global Antifreeze Proteins Market, by Source, 2017-2030 (US$ Mn)
TABLE 7 Global Antifreeze Proteins Market, by Type, 2017-2030 (US$ Mn)
TABLE 8 Global Antifreeze Proteins Market, by End-Use, 2017-2030 (US$ Mn)
TABLE 9 Global Antifreeze Proteins Market, by Geography, 2017-2030 (US$ Mn)
TABLE 10 North America Antifreeze Proteins Market, by Form, 2017-2030 (US$ Mn)
TABLE 11 North America Antifreeze Proteins Market, by Source, 2017-2030 (US$ Mn)
TABLE 12 North America Antifreeze Proteins Market, by Type, 2017-2030 (US$ Mn)
TABLE 13 North America Antifreeze Proteins Market, by End-Use, 2017-2030 (US$ Mn)
TABLE 14 North America Antifreeze Proteins Market, by Country, 2017-2030 (US$ Mn)
TABLE 15 US Antifreeze Proteins Market, by Form, 2017-2030 (US$ Mn)
TABLE 16 US Antifreeze Proteins Market, by Source, 2017-2030 (US$ Mn)
TABLE 17 US Antifreeze Proteins Market, by Type, 2017-2030 (US$ Mn)
TABLE 18 US Antifreeze Proteins Market, by End-Use, 2017-2030 (US$ Mn)
TABLE 19 Canada Antifreeze Proteins Market, by Form, 2017-2030 (US$ Mn)
TABLE 20 Canada Antifreeze Proteins Market, by Source, 2017-2030 (US$ Mn)
TABLE 21 Canada Antifreeze Proteins Market, by Type, 2017-2030 (US$ Mn)
TABLE 22 Canada Antifreeze Proteins Market, by End-Use, 2017-2030 (US$ Mn)
TABLE 23 Europe Antifreeze Proteins Market, by Form, 2017-2030 (US$ Mn)
TABLE 24 Europe Antifreeze Proteins Market, by Source, 2017-2030 (US$ Mn)
TABLE 25 Europe Antifreeze Proteins Market, by Type, 2017-2030 (US$ Mn)
TABLE 26 Europe Antifreeze Proteins Market, by End-Use, 2017-2030 (US$ Mn)
TABLE 27 Europe Antifreeze Proteins Market, by Country, 2017-2030 (US$ Mn)
TABLE 28 Germany Antifreeze Proteins Market, by Form, 2017-2030 (US$ Mn)
TABLE 29 Germany Antifreeze Proteins Market, by Source, 2017-2030 (US$ Mn)
TABLE 30 Germany Antifreeze Proteins Market, by Type, 2017-2030 (US$ Mn)
TABLE 31 Germany Antifreeze Proteins Market, by End-Use, 2017-2030 (US$ Mn)
TABLE 32 France Antifreeze Proteins Market, by Form, 2017-2030 (US$ Mn)
TABLE 33 France Antifreeze Proteins Market, by Source, 2017-2030 (US$ Mn)
TABLE 34 France Antifreeze Proteins Market, by Type, 2017-2030 (US$ Mn)
TABLE 35 France Antifreeze Proteins Market, by End-Use, 2017-2030 (US$ Mn)
TABLE 36 UK Antifreeze Proteins Market, by Form, 2017-2030 (US$ Mn)
TABLE 37 UK Antifreeze Proteins Market, by Source, 2017-2030 (US$ Mn)
TABLE 38 UK Antifreeze Proteins Market, by Type, 2017-2030 (US$ Mn)
TABLE 39 UK Antifreeze Proteins Market, by End-Use, 2017-2030 (US$ Mn)
TABLE 40 Italy Antifreeze Proteins Market, by Form, 2017-2030 (US$ Mn)
TABLE 41 Italy Antifreeze Proteins Market, by Source, 2017-2030 (US$ Mn)
TABLE 42 Italy Antifreeze Proteins Market, by Type, 2017-2030 (US$ Mn)
TABLE 43 Italy Antifreeze Proteins Market, by End-Use, 2017-2030 (US$ Mn)
TABLE 44 Spain Antifreeze Proteins Market, by Form, 2017-2030 (US$ Mn)
TABLE 45 Spain Antifreeze Proteins Market, by Source, 2017-2030 (US$ Mn)
TABLE 46 Spain Antifreeze Proteins Market, by Type, 2017-2030 (US$ Mn)
TABLE 47 Spain Antifreeze Proteins Market, by End-Use, 2017-2030 (US$ Mn)
TABLE 48 Rest of Europe Antifreeze Proteins Market, by Form, 2017-2030 (US$ Mn)
TABLE 49 Rest of Europe Antifreeze Proteins Market, by Source, 2017-2030 (US$ Mn)
TABLE 50 Rest of Europe Antifreeze Proteins Market, by Type, 2017-2030 (US$ Mn)
TABLE 51 Rest of Europe Antifreeze Proteins Market, by End-Use, 2017-2030 (US$ Mn)
TABLE 52 Asia Pacific Antifreeze Proteins Market, by Form, 2017-2030 (US$ Mn)
TABLE 53 Asia Pacific Antifreeze Proteins Market, by Source, 2017-2030 (US$ Mn)
TABLE 54 Asia Pacific Antifreeze Proteins Market, by Type, 2017-2030 (US$ Mn)
TABLE 55 Asia Pacific Antifreeze Proteins Market, by End-Use, 2017-2030 (US$ Mn)
TABLE 56 Asia Pacific Antifreeze Proteins Market, by Country, 2017-2030 (US$ Mn)
TABLE 57 China Antifreeze Proteins Market, by Form, 2017-2030 (US$ Mn)
TABLE 58 China Antifreeze Proteins Market, by Source, 2017-2030 (US$ Mn)
TABLE 59 China Antifreeze Proteins Market, by Type, 2017-2030 (US$ Mn)
TABLE 60 China Antifreeze Proteins Market, by End-Use, 2017-2030 (US$ Mn)
TABLE 61 Japan Antifreeze Proteins Market, by Form, 2017-2030 (US$ Mn)
TABLE 62 Japan Antifreeze Proteins Market, by Source, 2017-2030 (US$ Mn)
TABLE 63 Japan Antifreeze Proteins Market, by Type, 2017-2030 (US$ Mn)
TABLE 64 Japan Antifreeze Proteins Market, by End-Use, 2017-2030 (US$ Mn)
TABLE 65 India Antifreeze Proteins Market, by Form, 2017-2030 (US$ Mn)
TABLE 66 India Antifreeze Proteins Market, by Source, 2017-2030 (US$ Mn)
TABLE 67 India Antifreeze Proteins Market, by Type, 2017-2030 (US$ Mn)
TABLE 68 India Antifreeze Proteins Market, by End-Use, 2017-2030 (US$ Mn)
TABLE 69 South Korea Antifreeze Proteins Market, by Form, 2017-2030 (US$ Mn)
TABLE 70 South Korea Antifreeze Proteins Market, by Source, 2017-2030 (US$ Mn)
TABLE 71 South Korea Antifreeze Proteins Market, by Type, 2017-2030 (US$ Mn)
TABLE 72 South Korea Antifreeze Proteins Market, by End-Use, 2017-2030 (US$ Mn)
TABLE 73 South East Asia Antifreeze Proteins Market, by Form, 2017-2030 (US$ Mn)
TABLE 74 South East Asia Antifreeze Proteins Market, by Source, 2017-2030 (US$ Mn)
TABLE 75 South East Asia Antifreeze Proteins Market, by Type, 2017-2030 (US$ Mn)
TABLE 76 South East Asia Antifreeze Proteins Market, by End-Use, 2017-2030 (US$ Mn)
TABLE 77 Rest of Asia Pacific Antifreeze Proteins Market, by Form, 2017-2030 (US$ Mn)
TABLE 78 Rest of Asia Pacific Antifreeze Proteins Market, by Source, 2017-2030 (US$ Mn)
TABLE 79 Rest of Asia Pacific Antifreeze Proteins Market, by Type, 2017-2030 (US$ Mn)
TABLE 80 Rest of Asia Pacific Antifreeze Proteins Market, by End-Use, 2017-2030 (US$ Mn)
TABLE 81 Latin America Antifreeze Proteins Market, by Form, 2017-2030 (US$ Mn)
TABLE 82 Latin America Antifreeze Proteins Market, by Source, 2017-2030 (US$ Mn)
TABLE 83 Latin America Antifreeze Proteins Market, by Type, 2017-2030 (US$ Mn)
TABLE 84 Latin America Antifreeze Proteins Market, by End-Use, 2017-2030 (US$ Mn)
TABLE 85 Latin America Antifreeze Proteins Market, by Country, 2017-2030 (US$ Mn)
TABLE 86 Brazil Antifreeze Proteins Market, by Form, 2017-2030 (US$ Mn)
TABLE 87 Brazil Antifreeze Proteins Market, by Source, 2017-2030 (US$ Mn)
TABLE 88 Brazil Antifreeze Proteins Market, by Type, 2017-2030 (US$ Mn)
TABLE 89 Brazil Antifreeze Proteins Market, by End-Use, 2017-2030 (US$ Mn)
TABLE 90 Mexico Antifreeze Proteins Market, by Form, 2017-2030 (US$ Mn)
TABLE 91 Mexico Antifreeze Proteins Market, by Source, 2017-2030 (US$ Mn)
TABLE 92 Mexico Antifreeze Proteins Market, by Type, 2017-2030 (US$ Mn)
TABLE 93 Mexico Antifreeze Proteins Market, by End-Use, 2017-2030 (US$ Mn)
TABLE 94 Rest of Latin America Antifreeze Proteins Market, by Form, 2017-2030 (US$ Mn)
TABLE 95 Rest of Latin America Antifreeze Proteins Market, by Source, 2017-2030 (US$ Mn)
TABLE 96 Rest of Latin America Antifreeze Proteins Market, by Type, 2017-2030 (US$ Mn)
TABLE 97 Rest of Latin America Antifreeze Proteins Market, by End-Use, 2017-2030 (US$ Mn)
TABLE 98 Middle East and Africa Antifreeze Proteins Market, by Form, 2017-2030 (US$ Mn)
TABLE 99 Middle East and Africa Antifreeze Proteins Market, by Source, 2017-2030 (US$ Mn)
TABLE 100 Middle East and Africa Antifreeze Proteins Market, by Type, 2017-2030 (US$ Mn)
TABLE 101 Middle East and Africa Antifreeze Proteins Market, by End-Use, 2017-2030 (US$ Mn)
TABLE 102 Middle East and Africa Antifreeze Proteins Market, by Country, 2017-2030 (US$ Mn)
TABLE 103 GCC Countries Antifreeze Proteins Market, by Form, 2017-2030 (US$ Mn)
TABLE 104 GCC Countries Antifreeze Proteins Market, by Source, 2017-2030 (US$ Mn)
TABLE 105 GCC Countries Antifreeze Proteins Market, by Type, 2017-2030 (US$ Mn)
TABLE 106 GCC Countries Antifreeze Proteins Market, by End-Use, 2017-2030 (US$ Mn)
TABLE 107 South Africa Antifreeze Proteins Market, by Form, 2017-2030 (US$ Mn)
TABLE 108 South Africa Antifreeze Proteins Market, by Source, 2017-2030 (US$ Mn)
TABLE 109 South Africa Antifreeze Proteins Market, by Type, 2017-2030 (US$ Mn)
TABLE 110 South Africa Antifreeze Proteins Market, by End-Use, 2017-2030 (US$ Mn)
TABLE 111 Rest of the Middle East and Africa Antifreeze Proteins Market, by Form, 2017-2030 (US$ Mn)
TABLE 112 Rest of the Middle East and Africa Antifreeze Proteins Market, by Source, 2017-2030 (US$ Mn)
TABLE 113 Rest of the Middle East and Africa Antifreeze Proteins Market, by Type, 2017-2030 (US$ Mn)
TABLE 114 Rest of the Middle East and Africa Antifreeze Proteins Market, by End-Use, 2017-2030 (US$ Mn)

Frequently Asked Questions:

How does COVID-19 impact the global antifreeze proteins market?

The global antifreeze proteins market has experienced a mixed impact due to the COVID-19 pandemic. Although the market has been negatively affected by supply chain disruptions and decreased demand for certain products due to economic uncertainty, it has also benefited from an increased emphasis on the importance of preserving and storing essential medical supplies, which has led to a rise in demand for antifreeze proteins in the healthcare industry. Moreover, the pandemic has increased antifreeze protein R&D activities, particularly in developing sustainable and bio-based alternatives to traditional antifreeze products.

Which is the leading region of the market for antifreeze proteins?

North America accounted for the most heightened global antifreeze proteins market share.

What are the key drivers for the growth of the antifreeze proteins market?

Several key factors, including increased medical research, the use of antifreeze proteins in the pharmaceutical industry, and the growing demand for frozen food products, are propelling the growth of the antifreeze protein market.

Which is the major segment in the antifreeze proteins market by type?

The type I segment had a major global market share in 2022.

Which is the major segment in the antifreeze proteins market by form?

The solid segment had a major share in the global market.

Food Encapsulation Market

Published:
Report ID: 5663

Gluten-Free Bakery Products Market

Published:
Report ID: 36306

Low Calorie Food Market

Published:
Report ID: 12195

Food Preservatives Market

Published:
Report ID: 5660

Dairy Blends Market

Published:
Report ID: 4452

Sodium Benzoate Market

Published:
Report ID: 10462

Ready to Use Therapeutic Food Market

Published:
Report ID: 8866

Sunflower Oil Market

Published:
Report ID: 10108

Specialty Milk Formula Market

Published:
Report ID: 9566

UK Clean Label Starch Market

Published:
Report ID: 35481

Germany Clean Label Starch Market

Published:
Report ID: 35468

U.S. Clean Label Starch Market

Published:
Report ID: 35460

Purchase Options

$2999
Delivery Format: Excel.
$4999
Designed for the individual purchaser.
$6999
Users located at a single corporate site or regional office.
$7999
Allowed for unlimited sharing globally within one company.
Smallform of Sample request

Have a question?

User Profile

Don’t settle for less – trust Mitul to help you find the best solution.

Report delivery within 24 to 48 hours

– Other Info –

What people say?-

User Review

I am very impressed with the information in this report. The author clearly did their research when they came up with this product and it has already given me a lot of ideas.

Jana Schmidt
CEDAR CX Technologies

– Connect with us –

Phone

+91 6232 49 3207


support

24/7 Research Support


sales@credenceresearch.com

– Research Methodology –

Going beyond the basics: advanced techniques in research methodology

– Trusted By –

Pepshi, LG, Nestle
Motorola, Honeywell, Johnson and johnson
LG Chem, SIEMENS, Pfizer
Unilever, Samsonite, QIAGEN