Market Overview:
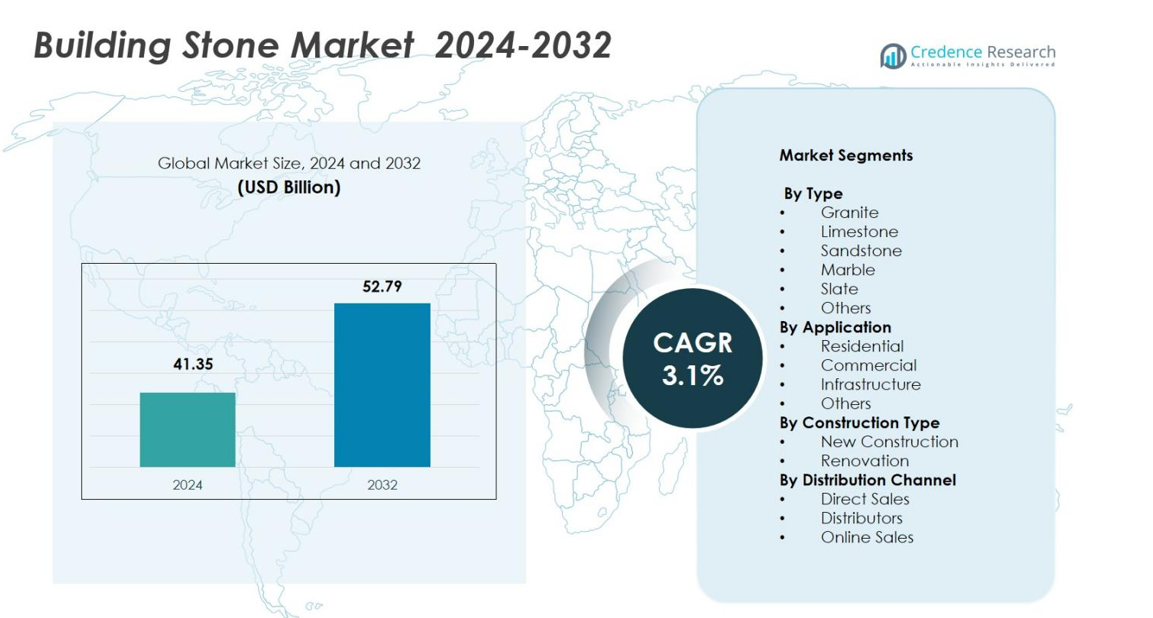
The Building Stone Market was valued at USD 41.35 billion in 2024 and is projected to reach USD 52.79 billion by 2032, growing at a CAGR of 3.1% during the forecast period.
| REPORT ATTRIBUTE |
DETAILS |
| Historical Period |
2020-2023 |
| Base Year |
2024 |
| Forecast Period |
2025-2032 |
| Building Stone Market Size 2024 |
USD 41.35 billion |
| Building Stone Market, CAGR |
3.1% |
| Building Stone Market Size 2032 |
USD 52.79 billion |
Building Stone Market has several top players, including Polycor Inc., Vulcan Materials Company, Martin Marietta Materials, Inc., LafargeHolcim Ltd., Cemex S.A.B. de C.V., HeidelbergCement AG, CRH plc, Granite Construction Inc., Luck Stone Corporation and Lehigh Hanson Inc.. These companies leverage their extensive extraction, processing and distribution capabilities to supply a wide range of natural stone materials granite, limestone, marble and more to residential, commercial and infrastructure projects globally. Meanwhile, the region leading the market is Asia‑Pacific, which held exactly 48.34% of the global natural stone market share in 2024.
Market Insights
- Building Stone Market size stood at USD 41.35 billion in 2024, and it is projected to grow at a CAGR of 3.1% to reach USD 52.79 billion by 2032.
- Rising urbanization, expanding infrastructure and housing activities drive demand for durable, aesthetic stone materials, pushing market growth across regions.
- Preference for natural stones like granite—holding about 34.2% share in 2024—and growing interest in sustainable, long‑lasting materials shape construction choices globally.
- The Asia‑Pacific region leads the market, with a regional share of 48.34% in 2024, supported by booming construction in countries like China and India.
- However, volatility in quarrying costs and stricter environmental regulations restrain market expansion by increasing input costs and complicating supply operations.
Access crucial information at unmatched prices!
Request your sample report today & start making informed decisions powered by Credence Research Inc.!
Download Sample
Market Segmentation Analysis:
By Type
The Building Stone Market is segmented by type into granite, limestone, sandstone, marble, slate, and others. Among these, granite dominates the market with a share of 34.2% in 2024, owing to its high durability, aesthetic appeal, and resistance to weathering, making it a preferred choice for both residential and commercial applications. The demand for granite is further driven by its versatility in various architectural styles and its ability to withstand harsh environmental conditions, which make it ideal for use in both interior and exterior construction.
- For instance, companies like Nakul International (P) Ltd. and Levantina are key players providing high-quality granite slabs widely used in luxury residential and commercial interiors.
By Application
The Building Stone Market is categorized into residential, commercial, infrastructure, and others. The residential segment holds the largest market share at 42.5% in 2024, driven by increasing construction of luxury homes and modern residential complexes that emphasize aesthetic finishes and durable materials. Building stones, especially granite and marble, are increasingly used in residential designs due to their visual appeal and longevity. Additionally, the growing trend of sustainable building materials is fueling the adoption of building stones in residential constructions.
- For instance, granite slabs are widely used for kitchen countertops and backsplashes, such as the Meera White granite, which offers both elegance and durability, making it a popular choice for modern residential interiors.
By Construction Type
The Building Stone Market is segmented by construction type into new construction and renovation. The new construction segment holds a dominant share of 59.6% in 2024. This dominance is driven by ongoing urbanization and the increasing number of residential, commercial, and infrastructure projects globally. New construction projects require large quantities of durable and aesthetically pleasing building stones, particularly granite and marble, which are widely used in facades, flooring, and decorative elements. The rise in construction activities, particularly in emerging economies, further supports this segment’s growth.
Key Growth Drivers
Rising Demand for Sustainable Building Materials
The increasing emphasis on sustainability in construction is driving the demand for natural building materials, such as building stones. Consumers and builders are increasingly opting for eco-friendly and durable materials, with stones like granite and limestone gaining popularity for their long lifespan and low environmental impact. These materials align with green building certifications and sustainable architecture trends, making them a preferred choice for both residential and commercial projects. As sustainability becomes a core focus in the construction industry, the building stone market is expected to see continued growth.
- For instance, Polycor, Inc., a leading natural stone producer, offers certified sustainable granite and limestone varieties such as Bethel White and Standard Gray Indiana Limestone, which support green building goals by being durable and eco-friendly.
Urbanization and Infrastructure Development
Global urbanization and infrastructure development are major growth drivers for the building stone market. As cities expand and new urban areas emerge, the demand for construction materials, including building stones, continues to rise. Stones are commonly used in infrastructure projects such as roads, bridges, and public buildings due to their durability and aesthetic appeal. In emerging economies, increased investment in infrastructure and residential developments is particularly boosting the demand for building stones, making urbanization a critical factor fueling market expansion.
- For instance, Granite Construction provides stone aggregates for major U.S. infrastructure like highways and bridges, leveraging its expertise in heavy civil projects to meet rising urban demands.
Advancements in Stone Processing Technology
Technological advancements in stone processing are enhancing the efficiency and cost-effectiveness of building stone production. Modern cutting and finishing techniques enable manufacturers to produce stones with precise dimensions, unique finishes, and greater customization, which is appealing to architects and builders. These innovations have made stone materials more versatile, reducing waste and improving overall production speed. As technology continues to evolve, it will further drive the adoption of building stones in both high-end residential and large-scale commercial projects.
Key Trends & Opportunities
Shift Towards Natural Stone in Residential Construction
There is a growing trend toward using natural stones like granite, marble, and limestone in residential construction. Homeowners are increasingly favoring these materials for their aesthetic appeal and long-lasting durability. This shift is particularly notable in luxury residential buildings, where high-quality stone is used for countertops, flooring, and facades. Additionally, the trend toward open-plan living spaces and minimalist interior designs is further boosting the demand for stone materials, creating significant opportunities for manufacturers to cater to this high-end segment.
- For instance, Levantina y Asociados de Minerales, S.A., a key player globally, which offers sophisticated natural stone solutions that support the trend of incorporating textured and patterned stones in upscale residential interiors.
Integration of Building Stones in Smart Buildings
With the rise of smart buildings, there is a growing opportunity for the use of building stones in combination with advanced technologies. Stones like marble and granite are being integrated into smart building designs to complement features such as automation systems, energy-efficient technologies, and sensor-driven environments. These materials are favored for their aesthetic qualities and ability to blend seamlessly with high-tech elements. As the smart building trend accelerates, the demand for high-quality, durable, and visually appealing stones in these projects is expected to increase.
- For instance, a facility in the UK the Caudwell International Children’s Centre used natural‑stone wall cladding (via a product called Stonepanel™ Nordic) for its exterior; the use of stone helped create a calm, stable internal environment with improved sound‑blocking and contributed to the building’s overall energy performance, showing that natural stone can harmonize with modern building design goals.
Key Challenges
Volatility in Raw Material Prices
One of the key challenges facing the building stone market is the volatility in raw material prices. The cost of quarrying and processing building stones, such as granite and marble, can fluctuate due to factors such as transportation costs, labor shortages, and fluctuations in demand from the construction industry. These price fluctuations can affect manufacturers’ profitability and may result in higher costs for end consumers, potentially dampening the demand for building stones, particularly in price-sensitive markets.
Environmental Regulations and Quarrying Restrictions
Strict environmental regulations and quarrying restrictions pose significant challenges for the building stone industry. The extraction of natural stones can have negative environmental impacts, including deforestation, water pollution, and habitat destruction. As environmental awareness grows, governments are enforcing stricter laws on quarrying practices, limiting access to raw materials. Compliance with these regulations increases operational costs and reduces the availability of high-quality building stones. Manufacturers and suppliers must find ways to mitigate these challenges by adopting more sustainable and eco-friendly practices.
Regional Analysis
Asia‑Pacific
The Asia‑Pacific region holds a commanding position in the building stone market, accounting for 48.34% of global natural stone consumption in 2024. Rapid urbanization, expanding infrastructure development, and a surge in residential and commercial construction drive this dominance. Particularly in countries such as China and India, abundant local reserves and well‑established quarrying and processing capacities ensure efficient supply chains. The strong domestic demand for durable and aesthetic stones for flooring, cladding, and structural applications underpins sustained growth in this region.
Europe
Europe represents the second-largest regional market for building stones globally, with a market share of 22.56% in 2024. Supported by robust demand for natural stone in residential renovations, commercial buildings, and historic restoration projects, the region continues to grow. Preference for sustainable architecture and stringent building regulations have elevated natural stone adoption in flooring, façades, and cladding. Additionally, renovation of older buildings and increasing retrofit activities across Western and Eastern Europe further sustain demand. The region’s mature construction industry and appreciation for aesthetics and longevity of natural stone materials contribute significantly to its stable market share.
North America
North America is witnessing considerable traction in building stone demand, particularly driven by renovation and high‑end residential and commercial construction activity, accounting for 17.72% of the global market share in 2024. The region benefits from a well‑established construction sector that increasingly favors natural stone for its durability, aesthetic appeal, and low maintenance. Use of stone in facades, landscaping, walkways, and interior finishes strengthens its relevance. Ongoing consumer preference for premium building materials and steady remodeling investments sustain the region’s growing share in the global market.
Latin America
Latin America holds a 6.15% share of the global building stone market in 2024, gradually emerging as a growing market supported by increased construction spending and modernization of infrastructure and housing sectors. Improvements in stone processing technologies and expanding applications in residential and commercial construction stimulate demand. While its share remains below those of Asia‑Pacific, Europe, and North America, rising urbanization and growing acceptance of natural building materials present tangible growth potential over the forecast period.
Middle East & Africa
The Middle East & Africa region is gaining momentum in the building stone market, with a market share of 5.23% in 2024, buoyed by rapid urban development, large‑scale infrastructure projects, and increased real estate investments, particularly in the Middle Eastern Gulf countries. Demand for stone arises from high-end residential complexes, commercial spaces, public infrastructure, and landscaping. Availability of regional stone reserves, accompanied by rising adoption of natural materials for durability and luxury finishes, supports market growth. Though currently a smaller share compared with leading regions, the region exhibits strong growth prospects.
Market Segmentations:
By Type
- Granite
- Limestone
- Sandstone
- Marble
- Slate
- Others
By Application
- Residential
- Commercial
- Infrastructure
- Others
By Construction Type
- New Construction
- Renovation
By Distribution Channel
- Direct Sales
- Distributors
- Online Sales
By Geography
- North America
- Europe
- Germany
- France
- U.K.
- Italy
- Spain
- Rest of Europe
- Asia Pacific
- China
- Japan
- India
- South Korea
- South-east Asia
- Rest of Asia Pacific
- Latin America
- Brazil
- Argentina
- Rest of Latin America
- Middle East & Africa
- GCC Countries
- South Africa
- Rest of the Middle East and Africa
Competitive Landscape
The Building Stone Market is characterized by a highly competitive landscape with key players such as Polycor Inc., Vulcan Materials Company, Martin Marietta Materials Inc., LafargeHolcim Ltd., Cemex S.A.B. de C.V., HeidelbergCement AG, CRH plc, Granite Construction Inc., Luck Stone Corporation, and Lehigh Hanson Inc. These companies dominate the market through their extensive product portfolios, robust distribution networks, and strategic expansion initiatives. Leading players are increasingly focusing on improving production capabilities, enhancing stone processing technologies, and investing in sustainable practices to cater to the growing demand for eco-friendly building materials. The market is also seeing consolidation through mergers and acquisitions, which help firms expand their geographical reach and product offerings. In addition, companies are forming strategic partnerships to leverage local expertise, optimize their supply chains, and increase market penetration. The emphasis on technological advancements and the ability to meet customer demands for high-quality, durable stones will continue to shape the competitive dynamics in this market.
Shape Your Report to Specific Countries or Regions & Enjoy 30% Off!
Key Player Analysis
Recent Developments
- In October 2025, Dwyer Marble & Stone unveiled a new “Visualizer Tool” that allows users to preview natural stone, quartz, and porcelain slab and tile materials in real‑world design settings enhancing selection and design planning for fabricators, builders, and designers.
- In July 2025, Capstone Holding Corp. signed a letter of intent to acquire a Southeast‑based distributor of thin veneer stone and hardscape materials, expanding its stone and hardscape distribution footprint in the U.S. Southeast market.
- In June 2024, SiteOne Landscape Supply completed the acquisition of Cohen & Cohen Natural Stone, a wholesale distributor of natural stone and landscape hardscape products in Ottawa, thereby strengthening SiteOne’s presence in Eastern Canada’s landscaping and stone supply sector.
- In September 2023, Polycor Inc. acquired Rocamat, a major European natural stone producer, thereby reinforcing Polycor’s global quarrying and distribution capacity across North America and Europe.
Report Coverage
The research report offers an in-depth analysis based on Type, Application, Construction Type, Distribution Channel and Geography. It details leading market players, providing an overview of their business, product offerings, investments, revenue streams, and key applications. Additionally, the report includes insights into the competitive environment, SWOT analysis, current market trends, as well as the primary drivers and constraints. Furthermore, it discusses various factors that have driven market expansion in recent years. The report also explores market dynamics, regulatory scenarios, and technological advancements that are shaping the industry. It assesses the impact of external factors and global economic changes on market growth. Lastly, it provides strategic recommendations for new entrants and established companies to navigate the complexities of the market.
Future Outlook
- The building stone market is expected to grow steadily, driven by increasing demand in residential, commercial, and infrastructure sectors.
- Urbanization in emerging economies will continue to boost demand for durable and aesthetically appealing building materials.
- Sustainability trends will significantly influence the market, with a growing preference for eco-friendly and recyclable building stones.
- Technological advancements in stone processing will enhance efficiency, enabling companies to offer customized and high-quality products.
- The rise of luxury residential developments will increase demand for premium natural stones like granite and marble.
- Renovation and restoration projects, especially in developed regions, will contribute to a strong market presence for building stones.
- The market will witness further consolidation through mergers and acquisitions, enhancing competitive dynamics and regional reach.
- Increased focus on energy-efficient buildings and green architecture will lead to greater use of natural stone in environmentally conscious projects.
- Advancements in digital technologies and automation will improve stone cutting and finishing techniques, reducing costs and waste.
- Demand from the Middle East & Africa will grow, fueled by large-scale infrastructure and real estate projects in urbanizing regions.


