
Market Overview
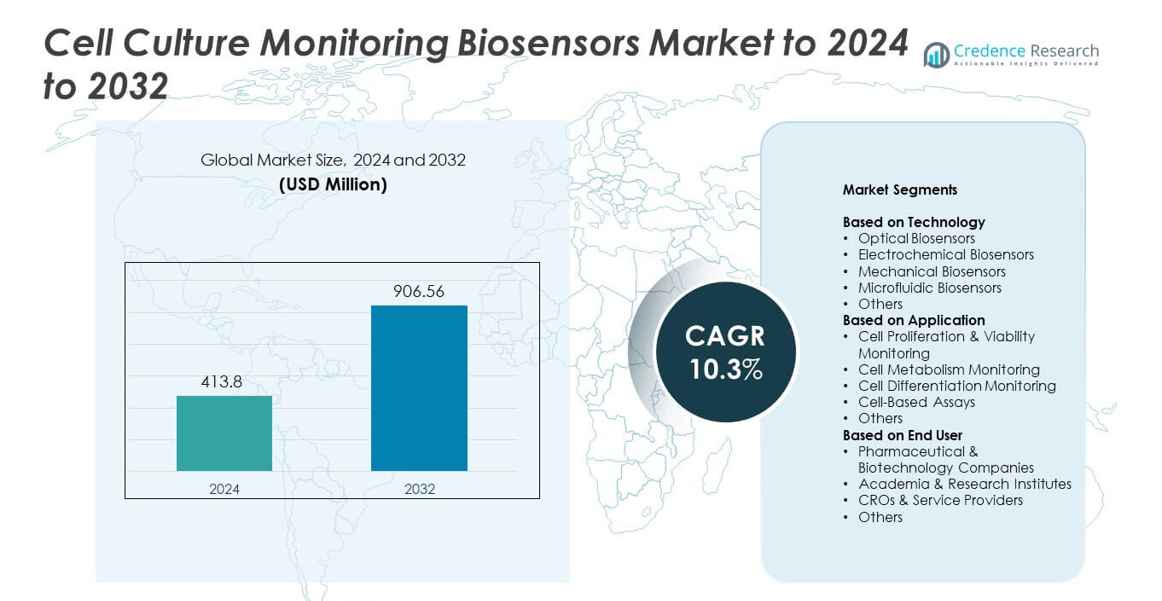
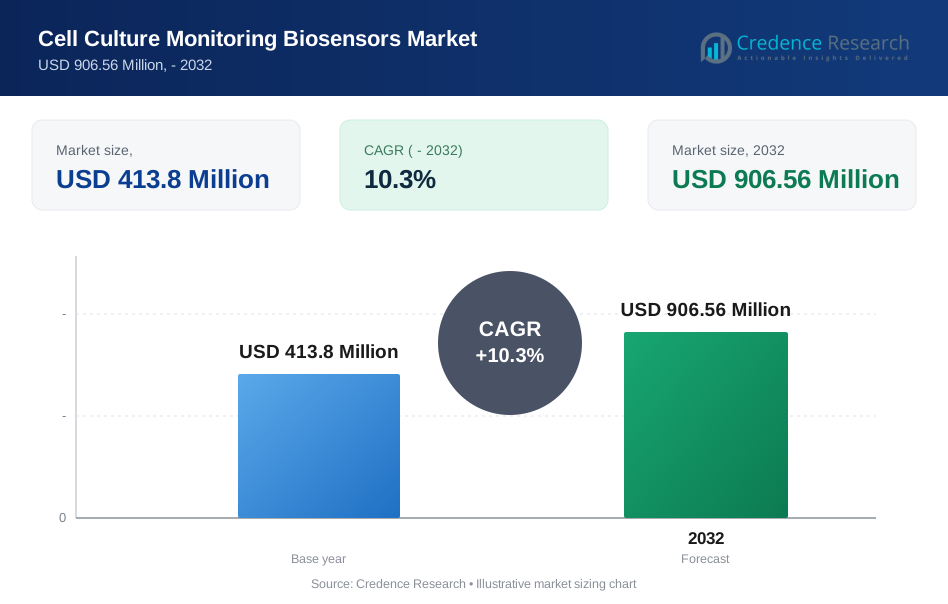
Cell Culture Monitoring Biosensors Market size was valued at USD 413.8 Million in 2024 and is anticipated to reach USD 906.56 Million by 2032, at a CAGR of 10.3% during the forecast period.
| REPORT ATTRIBUTE | DETAILS |
|---|---|
| Historical Period | 2020-2023 |
| Base Year | 2024 |
| Forecast Period | 2025-2032 |
| Cell Culture Monitoring Biosensors Market Size 2024 | USD 413.8 Million |
| Cell Culture Monitoring Biosensors Market, CAGR | 10.3% |
| Cell Culture Monitoring Biosensors Market Size 2032 | USD 906.56 Million |
The Cell Culture Monitoring Biosensors Market is shaped by leading companies such as Lifeonics Ltd., Sarissa Biomedical Ltd., Nova Biomedical, C-CIT Sensors AG, Conductive Technologies Inc., Cardea, Roche, and Lonza. These players compete through advanced optical, electrochemical, and microfluidic platforms that enable real-time, high-accuracy monitoring of cell growth and metabolism. North America leads the global landscape with about 38% share due to strong biopharma activity and early adoption of automated culture systems. Europe follows with around 29% share, supported by strict quality standards and active cell-therapy research, while Asia Pacific rapidly expands with nearly 23% share driven by rising biotechnology investment.
Market Insights
- The Cell Culture Monitoring Biosensors Market was valued at USD 413.8 Million in 2024 and is projected to reach USD 906.56 Million by 2032, growing at a CAGR of 10.3%.
- Strong demand arises from real-time, non-invasive cell analysis tools that support biologics, cell therapy, and high-throughput R&D, making optical biosensors the leading technology segment with about 39% share.
- Key trends include adoption of microfluidic miniaturized systems, AI-enabled predictive monitoring, and automated platforms that enhance accuracy and reduce culture failures.
- Competition intensifies as major players expand advanced sensing technologies, invest in data-integrated systems, and strengthen partnerships with biopharma, CROs, and research institutes.
- North America leads with about 38% share, followed by Europe at nearly 29% and Asia Pacific at around 23%, while pharmaceutical and biotechnology companies remain the dominant end-user segment with roughly 51% share.
Market Segmentation Analysis:
By Technology
Optical biosensors lead this segment with about 39% share in 2024 due to strong adoption in real-time, label-free cell analysis. Researchers prefer optical platforms because they offer high sensitivity, rapid detection, and non-invasive monitoring during culture growth. Demand rises as labs shift to high-resolution systems that measure adhesion, morphology, and metabolic shifts without disrupting samples. Electrochemical and microfluidic biosensors grow at a steady pace as companies invest in compact, integrated designs that support continuous monitoring in bioprocessing and stem-cell workflows.
- For instance, Sartorius's Incucyte Live-Cell Analysis platform was mentioned in a 2019 product announcement as being featured in over 2,500 peer-reviewed publications.
By Application
Cell proliferation and viability monitoring dominates this segment with nearly 42% share in 2024, driven by high use in drug development, toxicity testing, and biopharmaceutical production. Labs prioritize viability tools because they help detect culture health, growth kinetics, and stress responses with high accuracy. Rising biologics pipelines push companies to adopt advanced biosensors that track real-time cellular behavior. Cell metabolism and differentiation monitoring expand as regenerative medicine and immunotherapy programs demand deeper functional insights.
- For instance, Agilent Technologies reports that its Seahorse XF metabolic analyzers have been used in over 12,000 peer-reviewed scientific publications since their introduction in 2006.
By End User
Pharmaceutical and biotechnology companies hold the largest share with around 51% in 2024 due to strong integration of biosensors in bioprocess optimization, quality control, and high-throughput screening. Firms adopt these systems to improve yield prediction, reduce contamination risks, and support continuous manufacturing strategies. Research institutes show growing uptake as funding increases for cell-based studies and advanced culture platforms. CROs expand usage as outsourcing grows across drug discovery, assay development, and analytical testing services.
Key Growth Drivers
Rising Adoption of Real-Time Cell Analysis
Demand grows as labs shift from manual sampling to automated, real-time biosensor systems that track cell health, growth, and metabolic status with higher accuracy. This shift improves culture consistency, reduces contamination risk, and shortens experimentation cycles. Pharmaceutical companies rely on these systems to optimize biologics production and strengthen process control, which boosts large-scale adoption. The move toward non-invasive, continuous monitoring firmly positions real-time analytical tools as a major growth driver in this market.
- For instance, Repligen manufactures XCell ATF perfusion systems which are used to intensify upstream manufacturing processes and are available in various scales from laboratory use through full production with bioreactors as large as 5,000 liters.
Expansion of Biopharmaceutical and Cell Therapy Pipelines
Growth accelerates as biologics, gene therapies, and cell therapies require strict culture monitoring for viability, purity, and functional performance. Companies adopt advanced biosensors to handle sensitive cell lines used in CAR-T, stem-cell, and monoclonal antibody production. Regulatory pressure for tighter process validation further increases uptake. Rising R&D spending in immunotherapy and regenerative medicine strengthens the need for precise, high-frequency monitoring, making this expansion a leading market driver.
- For instance, Lonza's Cell & Gene Technologies business manufactured the viral vector, cell therapy, or gene therapy for 5 commercial cell and gene therapy products across facilities in the United States, Europe, and Asia as of the end of 2024
Increasing Shift Toward Automation and High-Throughput Workflows
Automation drives adoption as labs integrate biosensors with robotic systems, microfluidics, and high-throughput platforms to handle complex assays efficiently. These technologies reduce manual labor, lower operational errors, and support scalable bioprocessing. Companies value integrated systems that monitor multiple culture parameters simultaneously. The trend toward automated and data-rich workflows positions high-throughput biosensor platforms as a key driver for market growth.
Key Trends and Opportunities
Advancement of Microfluidic and Miniaturized Biosensor Platforms
Microfluidic innovations open new opportunities by enabling low-volume, high-precision monitoring in compact systems. Researchers favor miniaturized formats that support single-cell analysis and rapid screening. These platforms promote reduced reagent use and faster decision-making. As microfluidic technology matures, demand rises across regenerative medicine, toxicity testing, and small-scale bioprocess development, making this advancement a major trend with strong commercial potential.
- For instance, Dolomite Microfluidics provides a wide variety of standard and custom microfluidic chips for applications like single-cell analysis. These devices feature microchannels that can range in size from approximately 10 micrometers to 500 micrometers or larger, depending on the specific application requirements, enabling precise control over fluids in micrometer-sized channels
Growing Use of AI-Integrated and Predictive Monitoring Systems
AI-driven biosensor platforms create new opportunities by generating predictive insights on cell growth, nutrient levels, and metabolic behavior. These systems improve batch success rates and reduce culture failures. Machine learning tools enhance anomaly detection and enable corrective actions before deviations occur. As data-rich workflows become mainstream, AI-supported biosensors gain traction across pharma and research segments, shaping a key trend for long-term innovation.
- For instance, Cytiva's Chronicle automation software connects to various cell therapy instruments to manage manufacturing operations and collect data for comprehensive electronic batch records. It creates comprehensive electronic batch records (eBMRs) that ensure traceability and assist with GMP compliance and regulatory requirements (like 21 CFR Part 11)
Key Challenges
High Cost of Advanced Biosensor Platforms
Cost remains a major challenge as advanced optical and microfluidic biosensors require expensive hardware, specialized chips, and high-end imaging components. Smaller labs and academic centers struggle with adoption due to upfront investment and recurring consumable costs. Limited budget flexibility slows penetration in emerging markets. These financial barriers continue to restrict widespread implementation despite strong performance benefits.
Complex Integration with Existing Culture Systems
Integrating new biosensors into diverse culture formats presents technical challenges for many users. Compatibility issues arise with bioreactors, microfluidic chips, and automated workstations. Labs often require custom interfaces, validation steps, and workflow adjustments. These factors increase setup time and slow adoption. The need for specialized expertise and calibration adds further difficulty, making integration a key operational challenge in this market.
Regional Analysis
North America
North America holds the largest share of the Cell Culture Monitoring Biosensors Market with about 38% in 2024. Strong biopharmaceutical manufacturing, advanced research funding, and early adoption of real-time monitoring systems support regional leadership. Companies invest heavily in automated culture technologies and high-throughput screening tools. The United States drives most demand due to active biologics pipelines and rising cell therapy programs. Growth continues as CRO networks expand and regulatory bodies encourage higher process-control standards. Canada contributes through public research initiatives and growing biotech clusters.
Europe
Europe accounts for roughly 29% share in 2024, supported by strong pharmaceutical activity and sustained investment in precision cell-based research. Countries such as Germany, the United Kingdom, and France adopt advanced biosensors to comply with strict quality and validation guidelines. Expansion of stem-cell projects and regenerative medicine programs boosts use of real-time culture monitoring tools. Academic partnerships and EU-level funding accelerate innovation. Growing bioprocess automation in manufacturing sites further strengthens market penetration across Western and Northern Europe.
Asia Pacific
Asia Pacific represents about 23% share in 2024 and shows the fastest growth due to rising biotechnology investment and large-scale biologics manufacturing. China, Japan, South Korea, and India expand adoption as local firms build capabilities in cell therapy, vaccine production, and monoclonal antibody development. Governments increase funding for life-science infrastructure, which drives demand for sensitive monitoring platforms. Multinational companies also establish regional R&D sites, encouraging technology transfer. Growing CRO activity and lower operational costs enhance regional competitiveness.
Latin America
Latin America holds close to 6% share in 2024, driven by gradual improvements in laboratory infrastructure and expanding biopharmaceutical research capacity. Brazil and Mexico lead adoption as public and private sectors invest in advanced cell-based assays and controlled culture environments. Increasing collaborations with global biotech companies bring modern monitoring systems into regional facilities. Although budget constraints limit adoption speed, interest grows in optical and electrochemical biosensors for academic and clinical applications. Expansion of contract research services supports steady progress.
Middle East & Africa
The Middle East and Africa region accounts for around 4% share in 2024, supported by emerging biotechnology clusters in the Gulf Cooperation Council countries. The United Arab Emirates and Saudi Arabia invest in modern research centers and training programs that rely on advanced cell culture technologies. Adoption remains moderate due to limited high-end manufacturing capacity, but demand grows for biosensors that support clinical research, diagnostics, and vaccine studies. Africa shows early-stage uptake, mainly within academic institutions and donor-funded laboratories.
Market Segmentations:
By Technology
- Optical Biosensors
- Electrochemical Biosensors
- Mechanical Biosensors
- Microfluidic Biosensors
- Others
By Application
- Cell Proliferation & Viability Monitoring
- Cell Metabolism Monitoring
- Cell Differentiation Monitoring
- Cell-Based Assays
- Others
By End User
- Pharmaceutical & Biotechnology Companies
- Academia & Research Institutes
- CROs & Service Providers
- Others
By Geography
- North America
- U.S.
- Canada
- Mexico
- Europe
- Germany
- France
- U.K.
- Italy
- Spain
- Rest of Europe
- Asia Pacific
- China
- Japan
- India
- South Korea
- South-east Asia
- Rest of Asia Pacific
- Latin America
- Brazil
- Argentina
- Rest of Latin America
- Middle East & Africa
- GCC Countries
- South Africa
- Rest of the Middle East and Africa
Competitive Landscape
The Cell Culture Monitoring Biosensors Market features active competition among Lifeonics Ltd., Sarissa Biomedical Ltd., Nova Biomedical, C-CIT Sensors AG, Conductive Technologies Inc., Cardea, Roche, and Lonza. Companies expand their presence by developing real-time, non-invasive sensing platforms that improve accuracy in cell growth and metabolic tracking. Many firms focus on optical and microfluidic technologies that offer faster response times and higher sensitivity. Product development centers on automated systems that reduce manual sampling and support continuous bioprocess control. Competitors invest in digital integration, linking monitoring tools with data analytics to improve decision-making in research and manufacturing. Several players strengthen global reach through partnerships with biopharma producers, CRO networks, and academic institutes. Growth strategies include improving device portability, lowering operating costs, and enhancing compatibility with a wide range of culture systems. This competitive environment accelerates innovation and broadens the adoption of advanced monitoring solutions across regulated and research-driven workflows.
Key Player Analysis
- Lifeonics Ltd.
- Sarissa Biomedical Ltd.
- Nova Biomedical
- C-CIT Sensors AG
- Conductive Technologies Inc.
- Cardea
- Roche
- Lonza
Recent Developments
- In 2025, Roche announced a substantial investment of up to $550 million to expand its diagnostics manufacturing hub in Indianapolis, aiming to increase production capacity for its diagnostic tools, which include biosensor technology.
- In 2023, C-CIT Sensors contributed its single-use in-situ glucose sensor technology to the Liver4Life project at Wyss Zurich, aimed at extending liver tissue viability and monitoring glucose metabolism during ex vivo liver perfusion.
- In 2023, Lonza introduced TheraPEAK T-VIVO Cell Culture medium, a novel chemically defined formulation designed to optimize and accelerate CAR T cell manufacture, aiding cell therapy development.
Report Coverage
The research report offers an in-depth analysis based on Technology, Application, End-User and Geography. It details leading market players, providing an overview of their business, product offerings, investments, revenue streams, and key applications. Additionally, the report includes insights into the competitive environment, SWOT analysis, current market trends, as well as the primary drivers and constraints. Furthermore, it discusses various factors that have driven market expansion in recent years. The report also explores market dynamics, regulatory scenarios, and technological advancements that are shaping the industry. It assesses the impact of external factors and global economic changes on market growth. Lastly, it provides strategic recommendations for new entrants and established companies to navigate the complexities of the market.
Future Outlook
- The market will grow as biologics and cell therapy pipelines expand worldwide.
- Real-time, non-invasive monitoring systems will replace manual sampling in most labs.
- AI-integrated biosensors will support predictive culture management and reduce batch failures.
- Microfluidic and miniaturized platforms will accelerate single-cell and low-volume analysis.
- Automation will increase adoption in bioprocessing and high-throughput research workflows.
- Pharma companies will invest more in continuous manufacturing supported by advanced biosensors.
- Academic institutes will adopt smarter monitoring tools as research funding rises.
- CROs will strengthen demand through outsourced drug discovery and assay development services.
- Emerging markets will gain traction as infrastructure and biotech investments improve.
- Hybrid sensor platforms combining optical, electrochemical, and microfluidic technologies will become standard.
Request a Free Sample
Fill in your details and we'll send you a free sample report.
- Sample data tables & charts
- Research methodology
Need a Custom Version of This Report?
Tailor the scope, geography, or segments to your exact requirements.
- Custom geography or segment scope
- Direct access to our analyst team
Frequently Asked Questions
What is the current market size for Cell Culture Monitoring Biosensors Market, and what is its projected size in 2032?
At what Compound Annual Growth Rate is the Cell Culture Monitoring Biosensors Market projected to grow between 2025 and 2032?
Which is the leading region of the market for cell culture monitoring biosensor?
What are the key drivers for the growth of the cell culture monitoring biosensor market?
Which is the major segment in the cell culture monitoring biosensor market by end user?
Who are the leading companies in the Cell Culture Monitoring Biosensors Market?
Table of Content
Chapter 1. Report Introduction
- 1.1 Report Description & Purpose
- 1.1.1 Report Title & Market Definition
- 1.1.2 Unique Selling Propositions (USP) & Key Differentiators
- 1.1.3 Value Proposition for Stakeholders
- 1.2 Research Objectives
- 1.2.1 Market Sizing Objectives (Volume & Revenue) (Volume Where Applicable)
- 1.2.2 Segmentation Objectives
- 1.2.3 Competitive Intelligence Objectives
- 1.2.4 Forecast & Scenario Objectives
- 1.3 Report Scope
- 1.3.1 Cell Culture Monitoring Biosensors Scope – Segments & Subsegments Covered
- 1.3.2 Geographic Scope – Regions & Countries Covered
- 1.3.3 Historical Period, Base Year & Forecast Period (the historical period; forecast to 2032)
- 1.3.4 Inclusions & Exclusions
- 1.4 Industry Classification & Applicable Codes
- 1.5 Currency, Measurement Units & Valuation Basis
- 1.6 Target Stakeholders
- 1.7 Limitations & Assumptions
Chapter 2. Executive Summary
- 2.1 Global Cell Culture Monitoring Biosensors Market Snapshot
- 2.1.1 Market Size – Historical (the historical period) & Forecast (2032) (base year: USD 413.8 Million → 2032: USD 906.56 Million)
- 2.1.2 Volume & Revenue – Global Totals (Volume Where Applicable)
- 2.1.3 Key Market Highlights – Top Five Facts
- 2.2 Cell Culture Monitoring Biosensors Market Segmentation Snapshot
- 2.2.1 Market Split by Region – vs. 2032
- 2.3 Competitive Snapshot
- 2.3.1 Top 10 Players by Revenue Share –
- 2.3.2 Top 10 Players by Volume Share – (Volume Where Applicable)
- 2.3.3 Recent Strategic Developments (18-Month Summary)
- 2.4 Key Investment Highlights & Strategic Conclusions
Chapter 3. Cell Culture Monitoring Biosensors Market Dynamics & Industry Analysis
- 3.1 Market Overview & Context
- 3.1.1 Cell Culture Monitoring Biosensors Market Position in the Broader Industry Value Chain
- 3.1.2 Demand Structure & Purchasing Dynamics
- 3.1.3 Market Maturity & Development Stage by Region
- 3.2 Cell Culture Monitoring Biosensors Market Drivers
- 3.3 Cell Culture Monitoring Biosensors Market Restraints & Challenges
- 3.4 Cell Culture Monitoring Biosensors Market Opportunities
- 3.5 Porter's Five Forces Analysis
- 3.5.1 Threat of New Entrants
- 3.5.2 Bargaining Power of Suppliers
- 3.5.3 Bargaining Power of Buyers
- 3.5.4 Threat of Substitutes
- 3.5.5 Competitive Rivalry – Intensity Assessment
- 3.6 Cell Culture Monitoring Biosensors Value Chain Analysis
- 3.6.1 Upstream – Key Inputs, Resources & Suppliers
- 3.6.1.1 Key Input/Resource 1
- 3.6.1.2 Key Input/Resource 2
- 3.6.1.3 Key Input/Resource 3
- 3.6.2 Midstream – Core Operations & Value Creation
- 3.6.2.1 Operating Model & Process Overview
- 3.6.2.2 Key Operating Locations & Capabilities by Company
- 3.6.3 Downstream – Market Channels & End Users
- 3.6.3.1 Direct Sales & Customer Engagement Channels
- 3.6.3.2 Indirect Sales, Intermediaries & Partner Channels
- 3.6.4 Value Chain Profitability Analysis
- 3.6.1 Upstream – Key Inputs, Resources & Suppliers
- 3.7 PESTEL Analysis
- 3.7.1 Political Factors
- 3.7.2 Economic Factors
- 3.7.3 Social Factors
- 3.7.4 Technological Factors
- 3.7.5 Environmental Factors
- 3.7.6 Legal Factors
- 3.8 Cell Culture Monitoring Biosensors Supply Chain Analysis
- 3.8.1 Critical Input & Resource Availability Risk Assessment
- 3.8.2 Supplier & Operational Concentration Risk (Geographic Exposure)
- 3.8.3 Supply & Service Disruption Impact Analysis
- 3.9 Regulatory & Policy Landscape
Note: The regulatory and policy landscape section covers regulations based on their applicability to the market, Cell Culture Monitoring Biosensors category, geography, and scope of the study. Only regulatory frameworks with a material impact on operations, compliance, trade, sustainability, or market access are analyzed in detail.
Chapter 4. Key Investment Pockets & Opportunity Analysis
- 4.1 Cell Culture Monitoring Biosensors Market Attractiveness Analysis
- 4.1.1 By Region – Investment Attractiveness Matrix (Market Size × CAGR)
- 4.2 Absolute Revenue Growth Opportunity
- 4.2.1 By Region – Absolute Revenue Growth Through 2032
- 4.3 Incremental Demand Opportunity
- 4.3.1 By Region – Incremental Demand Through 2032
- 4.3.2 Segment – Incremental Demand
- 4.4 Emerging Submarket Opportunity Deep Dive (Subject to Applicability)
- 4.5 Priority Market Opportunity Scorecards
- 4.5.1 United States
- 4.5.2 Europe
- 4.5.3 Asia
- 4.5.4 Middle East & Africa
Note: Priority market opportunity scorecards reflect the geographic scope and strategic relevance of the study. Listed markets are indicative and may be adapted to the industry.
Chapter 5. Cell Culture Monitoring Biosensors Cross-Border Trade & Market Access Analysis
- 5.1 International Trade & Cross-Border Activity Overview
- 5.1.1 Global Export Value by Country (the historical period)
- 5.1.2 Global Export Volume by Country (the historical period) (Volume Where Applicable)
- 5.1.3 Global Import Value by Country (the historical period)
- 5.1.4 Global Import Volume by Country (the historical period) (Volume Where Applicable)
- 5.1.5 Net Trade Balance by Country (the historical period)
- 5.2 Export Analysis – Segment
- 5.2.1 Category 1 (Applicable Classification Code)
- 5.2.2 Category 2 (Applicable Classification Code)
- 5.2.3 Category 3 (Applicable Classification Code)
- 5.2.4 Category 4 (Applicable Classification Code)
- 5.2.5 Category 5 (Applicable Classification Code)
- 5.3 Import Analysis – Segment
- 5.3.1 Category 1 (Applicable Classification Code)
- 5.3.2 Category 2 (Applicable Classification Code)
- 5.3.3 Category 3 (Applicable Classification Code)
- 5.3.4 Category 4 (Applicable Classification Code)
- 5.3.5 Category 5 (Applicable Classification Code)
- 5.4 Cross-Border Pricing & Transaction Benchmarks
- 5.4.1 Export Pricing – Segment & Country
- 5.4.2 Import Pricing – Segment & Source Country
- 5.4.3 Price Trends (the historical period)
- 5.5 Key Cross-Border Trade & Delivery Routes
- 5.5.1 Cross-Border Trade/Delivery Route 1
- 5.5.2 Cross-Border Trade/Delivery Route 2
- 5.5.3 Cross-Border Trade/Delivery Route 3
- 5.5.4 Cross-Border Trade/Delivery Route 4
- 5.5.5 Cross-Border Trade/Delivery Route 5
- 5.6 Trade Policy & Market Access Impact Assessment
- 5.6.1 Tariff & Non-Tariff Barriers
- 5.6.2 Regional Trade & Economic Integration Frameworks
- 5.6.3 Bilateral & Multilateral Trade Agreements
- 5.6.4 Cross-Border Operating, Licensing & Localization Requirements
Note: This chapter applies where cross-border trade or delivery is relevant to Cell Culture Monitoring Biosensors. Goods, services, and digital offerings are assessed using applicable classifications and transaction measures. Import-export volumes, trade balances, and route analyses are included only where meaningful to the market.
Chapter 6. Competitive Landscape & Company Benchmarking
- 6.1 Cell Culture Monitoring Biosensors Market Concentration & Structure
- 6.1.1 Herfindahl-Hirschman Index (HHI) – vs.
- 6.1.2 Leading, Mid-Sized & Emerging Player Structure
- 6.1.3 Global, Regional & Local Player Dynamics
- 6.2 Cell Culture Monitoring Biosensors Market Share Analysis –
- 6.2.1 Global Revenue Share by Company
- 6.2.2 Global Volume Share by Company (Volume Where Applicable)
- 6.2.3 Regional Revenue Share
- 6.2.4 Market Share Evolution ( vs. )
- 6.2.5 Company Market Share by Key Segment
- 6.2.6 Company Market Share by Customer Group
- 6.3 Operating Scale, Capacity & Infrastructure Analysis
- 6.3.1 Global Operating Scale & Supply Capacity
- 6.3.2 Resource Utilization & Operating Efficiency
- 6.3.3 Output, Service Delivery & Activity Metrics
- 6.3.4 Operating Footprint & Infrastructure Map
- 6.3.5 Planned Operational & Capacity Expansion
- 6.4 Cell Culture Monitoring Biosensors Competitive Benchmarking Matrix
- 6.4.1 Revenue, Growth, Profitability & Operating Metric Comparison
- 6.4.2 Channel Revenue Mix
- 6.4.3 Geographic Revenue Exposure
- 6.4.4 R&D Intensity
- 6.4.5 Sustainability Maturity
- 6.5 Strategic Developments in Cell Culture Monitoring Biosensors (Last 24 Months)
- 6.5.1 Mergers, Acquisitions & Divestments
- 6.5.2 New Products, Services & Solutions in Cell Culture Monitoring Biosensors
- 6.5.3 Operational & Infrastructure Expansions
- 6.5.4 Strategic Alliances, Joint Ventures & Partnerships
- 6.5.5 Distribution Expansion & Market Entry
- 6.5.6 Sustainability & ESG Initiatives
- 6.6 Competitive Strategy Mapping
- 6.6.1 Leader, Challenger, Follower & Niche Classification
- 6.6.2 Pricing Strategy Comparison
- 6.6.3 Channel Strategy Matrix
Note: Strategic developments are included based on their materiality and the availability of reliable information.
Chapter 7. Global Cell Culture Monitoring Biosensors Market – By Sales & Delivery Channel
- 7.1 Segment Overview
- 7.1.1 Volume & Revenue Split by Channel ( & 2032) (Volume Where Applicable)
- 7.1.2 Channel Mix Evolution (2032)
Chapter 8. Regional Market Analysis – Global Overview
- 8.1 Global Regional Overview
- 8.1.1 Regional Volume Share (Volume Where Applicable)
- 8.1.2 Regional Revenue Share
- 8.1.3 Regional Volume by Region (Volume Where Applicable)
- 8.1.4 Regional Revenue by Region
- 8.1.5 Regional Forecast Through 2032
- 8.2 Cross-Regional Segment Analysis
- 8.2.1 By Sales & Delivery Channel
- 8.2.2 By Competitive Positioning & Price Tier
Chapter 9. North America Cell Culture Monitoring Biosensors Market
- 9.1 United States
- 9.2 Canada
- 9.3 Mexico
Chapter 10. Europe Cell Culture Monitoring Biosensors Market
- 10.1 Germany
- 10.2 France
- 10.3 Italy
- 10.4 United Kingdom
- 10.5 Spain
- 10.6 Poland
- 10.7 Russia
- 10.8 Netherlands
- 10.9 Belgium
- 10.10 Sweden
- 10.11 Denmark
- 10.12 Norway
- 10.13 Rest of Europe
Chapter 11. Asia Pacific Cell Culture Monitoring Biosensors Market
- 11.1 China
- 11.2 India
- 11.3 Japan
- 11.4 South Korea
- 11.5 Thailand
- 11.6 Indonesia
- 11.7 Vietnam
- 11.8 Malaysia
- 11.9 Australia
- 11.10 Rest of Asia Pacific
Chapter 12. Latin America Cell Culture Monitoring Biosensors Market
- 12.1 Brazil
- 12.2 Argentina
- 12.3 Colombia
- 12.4 Chile
- 12.5 Rest of Latin America
Chapter 13. Middle East Cell Culture Monitoring Biosensors Market
- 13.1 Saudi Arabia
- 13.2 United Arab Emirates
- 13.3 Turkey
- 13.4 Israel
- 13.5 Iran
- 13.6 Rest of the Middle East
Chapter 14. Africa Cell Culture Monitoring Biosensors Market
- 14.1 South Africa
- 14.2 Egypt
- 14.3 Nigeria
- 14.4 Morocco
- 14.5 Rest of Africa
Chapter 15. Cell Culture Monitoring Biosensors Company Profiles
- 15.1 [Company 01]
- 15.1.1 Company Overview
- 15.1.2 Key Management Personnel
- 15.1.3 Products & Services Portfolio
- 15.1.4 Financial Performance
- 15.1.5 Key Market Focus & Geographic Presence
- 15.1.6 Recent Developments & Strategic Initiatives
Note: The company profile list is preliminary and may change based on research findings, market developments, data availability, and client requirements.
Chapter 16. Appendices
- Appendix A – List of Abbreviations & Acronyms
- Appendix B – Industry Classification Code Reference – Full Series
- Appendix C – Supply, Output & Operating Capacity Data Tables
- Appendix D – End-Use & Demand Base Tables
- Appendix E – Demand, Adoption & Usage Assumptions
- Appendix F – Pricing & Revenue Metric Reference Tables
- Appendix G – Company Operations & Infrastructure Database
- Appendix H – Cross-Border Trade & Activity Data Tables (Where Applicable)
- Appendix I – Regulatory Summary Tables
- Appendix J – Primary Research Participant List (Anonymized)
- Appendix K – Primary Research Questionnaire Framework
- Appendix L – Data Sources & Bibliography
- Appendix M – Market Size Divergence & Source Comparison
Chapter 17. Research Methodology
- 17.1 Research Framework & Philosophy
- 17.2 Secondary Research – Sources, Hierarchy & Data Extraction
- 17.3 Data Modeling – Bottom-Up & Top-Down Market Sizing
- 17.4 Primary Research – Stakeholder Framework, LOI & Sample Sizes
- 17.5 Forecast Methodology – Regression, Scenario & Sensitivity Analysis
- 17.6 Quality Control – Four-Layer Validation Framework
- 17.7 Limitations & Standard Assumptions
- 17.8 Disclaimer
