
Market Overview:
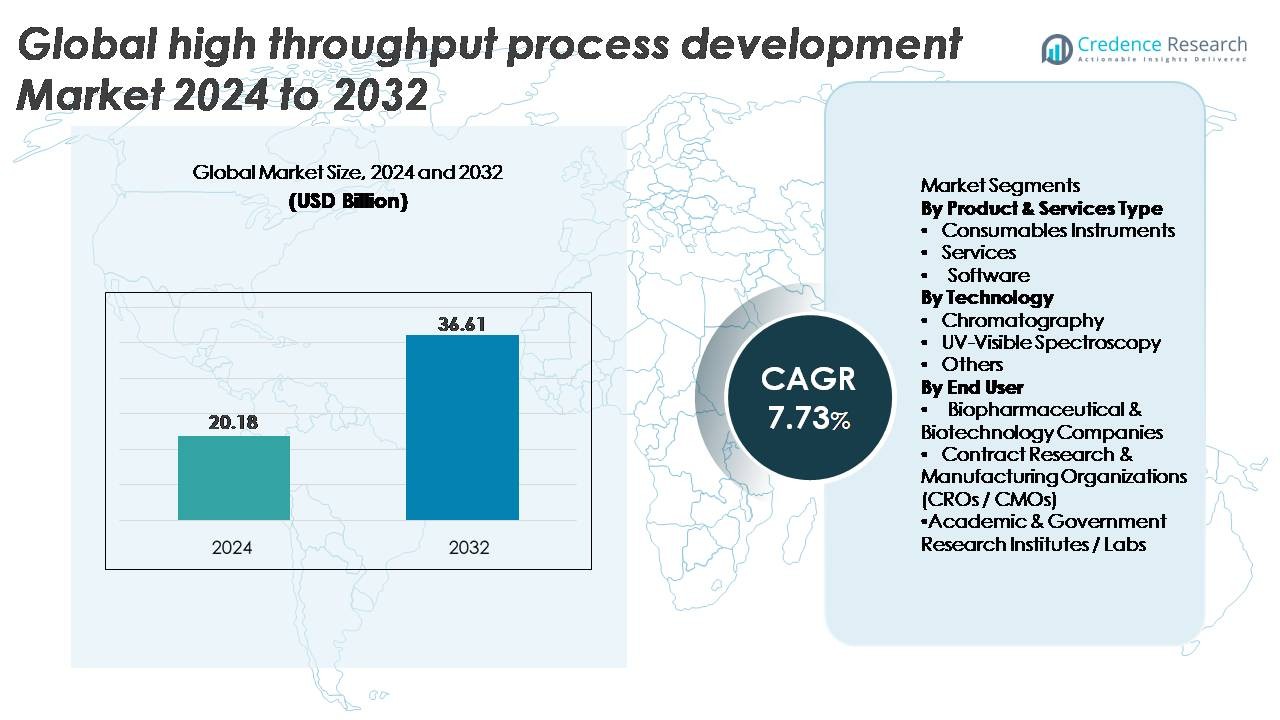
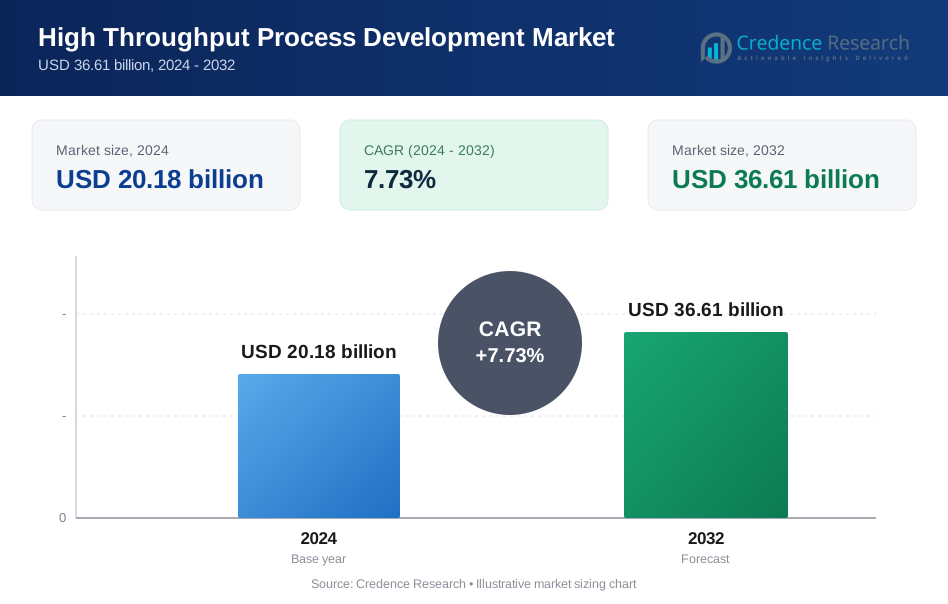
The Global High Throughput Process Development Market was valued at USD 20.18 billion in 2024 and is projected to reach USD 36.61 billion by 2032, expanding at a CAGR of 7.73% during the forecast period.
| REPORT ATTRIBUTE | DETAILS |
|---|---|
| Historical Period | 2020-2023 |
| Base Year | 2024 |
| Forecast Period | 2025-2032 |
| High Throughput Process Development Market Size 2024 | USD 20.18 Billion |
| High Throughput Process Development Market, CAGR | 7.73% |
| High Throughput Process Development Market Size 2032 | USD 36.61 Billion |
The global high throughput process development market is shaped by a strong cohort of technology leaders, including Sartorius AG, Tecan Trading AG, Thermo Fisher Scientific Inc., Agilent Technologies, Danaher Corporation, Luminex Applikon, Merck KGaA, Eppendorf AG, GE Healthcare, and Bio-Rad Laboratories Inc. These companies compete through advanced multi-parallel bioreactors, high throughput chromatography systems, automated liquid-handling platforms, and integrated analytical software that enhance process optimization speed and precision. North America leads the market with approximately 38% share, supported by mature biopharmaceutical R&D infrastructure and rapid adoption of automation and digital bioprocessing. Europe follows with around 29%, driven by strong regulatory alignment and well-established biologics manufacturing capabilities.
Market Insights:
- The global high throughput process development market was valued at USD 20.18 billion in 2024 and is projected to reach USD 36.61 billion by 2032, growing at a CAGR of 7.73%.
- Market growth is driven by rapid expansion of biologics pipelines, rising demand for faster molecule screening, and increasing adoption of automated multi-parallel bioreactors and high throughput chromatography systems across biopharmaceutical R&D.
- Key trends include integration of AI-driven predictive analytics, wider use of microfluidic screening platforms, and digital bioprocessing solutions that enhance experimental throughput, process robustness, and data intelligence.
- Competition intensifies as major players innovate in automation, consumables, and analytics, with the consumables segment holding the largest share due to continuous use in screening and purification workflows; however, high capital cost remains a restraint for emerging biotech labs.
- Regionally, North America leads with 38%, followed by Europe at 29% and Asia-Pacific at 23%, reflecting strong R&D investments and expanding biologics manufacturing ecosystems.
 Market Segmentation Analysis:
By Product & Services Type
Consumables represent the dominant segment, holding the largest market share due to their recurring use in rapid screening, assay preparation, and chromatography workflow optimization. High-throughput platforms rely heavily on microplates, resins, filtration media, and assay reagents, making consumables essential for continuous bioprocess development cycles. Their adoption is further driven by the expansion of multi-parallel bioreactor systems and automated liquid-handling workflows that require standardized, high-quality consumable sets to maintain process consistency. Growing biopharmaceutical R&D intensity and increased frequency of clone, media, and buffer screening reinforce strong demand for this segment.
- For instance, Sartorius’ ambr® 250 system uses single-use vessel consumables with working volumes of 100–250 mL across up to 24 parallel bioreactors, while Cytiva’s HiScreen columns enable up to 4 mL resin volume per column for rapid resin-screening runs, supporting high-throughput purification studies.
By Technology
Chromatography remains the dominant technology, capturing the largest market share owing to its central role in purification, resin screening, and optimization of separation parameters during bioprocess development. High-throughput chromatography systems enable hundreds of conditions to be screened simultaneously, significantly shortening purification timelines. Adoption increases as biomanufacturers accelerate monoclonal antibody, recombinant protein, and viral vector programs requiring precision separation workflows. The integration of miniature columns, multi-column chromatography platforms, and automated resin selection tools further promotes the dominance of chromatography over UV-visible spectroscopy and other analytical methods.
- For instance, Cytiva’s ÄKTA avant platform supports automated method screening with flow rates up to 25 mL/min and accommodates HiTrap and HiScale column formats ranging from 1 mL to 160 mL, while Repligen’s OPUS RoboColumn units provide pre-packed miniature columns as small as 200 µL, allowing rapid evaluation of multiple resin chemistries in a single run.
By End User
Biopharmaceutical and biotechnology companies lead the end-user segment, accounting for the largest market share as they deploy high-throughput systems to streamline molecule screening, process characterization, and scale-up activities. Demand is fueled by expanding biologics pipelines including mAbs, cell and gene therapy vectors, and recombinant proteins which require rapid, data-rich process development cycles. These companies increasingly invest in automated parallel bioreactors, microfluidic systems, and predictive process analytics to accelerate time-to-clinic. CROs/CMOs and academic institutes also adopt high-throughput workflows, but their usage intensity remains lower than fully integrated biopharma R&D environments.
Key Growth Drivers:
Expansion of Biologics Pipelines and Accelerated Molecule Screening Demand
The rapid expansion of biologics pipelines—including monoclonal antibodies, bispecific antibodies, recombinant proteins, and viral vectors—significantly increases the demand for high throughput process development (HTPD) platforms. Biopharmaceutical companies require rapid, data-rich screening of cell lines, media compositions, buffer conditions, and resin chemistries to shorten development cycles and enhance early-stage process fidelity. High throughput technologies enable parallel experimentation, reducing optimization timelines from months to weeks. Additionally, the rise of novel modalities such as mRNA therapeutics, gene-editing constructs, and cell therapy components requires complex process characterization, further strengthening demand for multi-parallel bioreactors, automated chromatography systems, and microfluidic optimization tools. As regulatory expectations for process robustness increase, companies adopt HTPD to generate comprehensive datasets that support quality-by-design (QbD) frameworks. This driver remains foundational as global R&D spending intensifies and biologics development pipelines diversify across oncology, rare diseases, and immunotherapy.
- For instance, Sartorius’ ambr® 15 system enables up to 48 parallel bioreactors operating at 10–15 mL working volume, while Berkeley Lights’ Beacon® platform can screen more than 3,000 single cells simultaneously, generating functional data in under 24 hours dramatically accelerating clone selection and early biologics screening.
Growing Adoption of Automation, Robotics, and Digital Bioprocessing
Automation serves as a critical growth catalyst as organizations shift from manual experimentation to robotic, AI-enhanced workflows. Automated liquid handlers, integrated microplate systems, and multi-parallel bioreactors significantly reduce human error, increase throughput, and standardize experimental design. Digital bioprocessing platforms now incorporate machine learning algorithms for parameter optimization, predictive modeling, and real-time adaptive control, enabling faster convergence toward optimal process conditions. Automated chromatography systems and robotic sample-preparation stations further enhance purification efficiency and analytical reproducibility. These capabilities allow development teams to evaluate thousands of conditions within compressed timelines, supporting rapid molecule triage and process intensification strategies. The proliferation of cloud-based data management, integrated electronic lab notebooks, and digital twins enables cross-site collaboration and accelerates technology transfer. Collectively, the synergy between automation and digitalization drives large-scale adoption, particularly within biopharmaceutical innovation centers and contract development organizations.
- For instance, Hamilton's Microlab STAR platform delivers high precision (e.g., typical accuracy of <1.0% and precision of <0.8% CV at 50 µL) and can process up to 384-well plates with its MultiProbe Head option, enabling high-throughput applications in genomics and clinical diagnostics.
Increasing Need for Faster Scale-Up and Process Intensification in Biomanufacturing
The industry’s movement toward intensified, continuous, and flexible biomanufacturing creates strong demand for HTPD tools that support rapid scale-up and robust process definition. As companies pursue accelerated clinical timelines and cost-efficient production models, high throughput systems provide the foundational datasets required to transition from bench to pilot scale with reduced risk. Multi-parallel mini bioreactors allow real-time exploration of critical process parameters such as pH, dissolved oxygen, agitation, and nutrient feed strategies, ensuring predictable performance across scales. Similarly, high throughput purification tools enable rapid resin selection, binding condition optimization, and elution profiling. These capabilities are essential for continuous bioprocessing, perfusion-based operations, and intensified downstream strategies. With rising pressure to deliver commercial-ready processes earlier in development, HTPD becomes indispensable in eliminating bottlenecks, enhancing process consistency, and strengthening regulatory submissions through deep, statistically rich datasets.
Key Trends and Opportunities:
Integration of AI-Driven Predictive Analytics and Advanced Data Modeling
Artificial intelligence emerges as a transformative trend, enabling deeper insights into high throughput datasets and accelerating decision-making. AI-driven models analyze multidimensional parameters, identify nonlinear interactions, and predict optimal process conditions with unprecedented accuracy. Machine learning algorithms can recommend experimental designs, flag outlier behaviors, and simulate experimental outcomes, reducing wet-lab workload. Digital twins for bioprocess development allow simulation of fermentation kinetics, chromatographic profiles, and scale-up scenarios, enabling teams to test conditions virtually before executing experiments. This trend unlocks opportunities for enhanced process robustness, reduced development timelines, and strengthened QbD documentation. As datasets grow in complexity especially for cell and gene therapy processes AI integration becomes essential for managing variability and identifying hidden performance drivers. Vendors offering software with embedded analytics, automated modelling, and visualization tools gain significant competitive advantage as data-driven bioprocessing becomes industry standard.
- For instance, Agilent’s BioTek Gen5 software processes over 10,000 data points per microplate read and integrates AI-enabled curve-fitting modules capable of generating kinetic models in under 30 seconds, while Sartorius’ Data Analytics Platform supports real-time modeling of more than 200 process parameters simultaneously during upstream development.
Rising Adoption of Multi-Parallel Mini Bioreactors and Microfluidic Screening Platforms
Multi-parallel bioreactors and microfluidic systems are transforming early-stage process development by enabling hundreds of conditions to be tested simultaneously with minimal resource consumption. These scalable technologies offer precise control over culture conditions and allow high-resolution mapping of critical parameters. Microfluidic platforms support ultra-small-volume experiments, reducing reagent use while preserving biological relevance, making them ideal for clone screening, media optimization, and viral vector production studies. As manufacturing shifts toward intensified and continuous models, the need for rapid, cost-efficient upstream evaluations grows sharply. This trend creates opportunities for system integrators, consumable suppliers, and software vendors to deliver solutions that combine parallel testing with real-time analytics. Enhanced reproducibility, reduced variability, and lower operating costs position these platforms as critical enablers of next-generation bioprocess innovation.
- For instance, Sartorius’ ambr® 250 modular system enables up to 24 parallel bioreactors with working volumes of 100–250 mL, while microfluidic platforms such as Dolomite Bio’s Nadia system can run up to 6,000 encapsulated single-cell reactions per chip in a single experiment dramatically expanding throughput and accelerating variant screening.
Key Challenges:
High Capital Investment Requirements and Integration Complexity
Despite strong benefits, high throughput systems require significant upfront investment in automated instruments, analytical equipment, robotics, and data-management infrastructure. Smaller biotechnology firms, academic labs, and emerging-market manufacturers often struggle to justify costs associated with multi-parallel bioreactors, advanced chromatography platforms, and AI-driven software. Integration challenges escalate when combining tools from different vendors, creating interoperability issues across hardware, data formats, and control systems. Implementing these technologies also requires specialized training, advanced bioinformatics capabilities, and cross-functional coordination among R&D, process development, and manufacturing teams. As biopharma organizations expand digital and automated platforms, managing change control, validation, and regulatory compliance adds further complexity. These barriers can slow adoption, especially in resource-limited settings.
Data Overload, Workflow Complexity, and Analytical Bottlenecks
High throughput platforms generate massive datasets, requiring sophisticated data-handling systems, computational power, and advanced analytics pipelines. Without appropriate infrastructure, organizations face bottlenecks in data cleaning, normalization, visualization, and interpretation. Managing this data volume can strain LIMS systems, delay decision-making, and increase risk of analytical inconsistencies. Workflow complexity increases as experimental density rises, requiring tight coordination between upstream, downstream, and analytical teams. Moreover, standardization of protocols across instruments remains a challenge, leading to variability and difficulties in cross-study comparability. Insufficient expertise in statistical modeling and ML-driven analytics further complicates adoption. These challenges highlight the need for harmonized workflows, robust digital ecosystems, and integrated analytical platforms that streamline data interpretation and support efficient, high-quality process development.
Regional Analysis:
North America
North America holds the dominant position in the global high throughput process development market, accounting for around 38% of total share, driven by strong biologics R&D pipelines and extensive adoption of automated, AI-enabled bioprocessing platforms. The region’s leadership is reinforced by advanced biomanufacturing infrastructure, significant investments in digital labs, and the early integration of multi-parallel bioreactors and high throughput chromatography systems. Major biopharmaceutical companies and CDMOs in the United States accelerate demand by prioritizing rapid molecule screening and robust process characterization. Supportive regulatory frameworks and sustained funding for innovative biologics further strengthen the region’s market advantage.
Europe
Europe captures approximately 29% of the global market, supported by a strong presence of pharmaceutical manufacturers, specialized research institutes, and established bioprocessing technology providers. The region benefits from significant investments in continuous bioprocessing, digitalization, and intensified upstream development. Countries such as Germany, the U.K., and Switzerland lead adoption due to mature biologics production ecosystems and government-funded innovation programs. High throughput systems are increasingly deployed to enhance clone selection, purification optimization, and scale-up studies, especially within therapeutic antibody and cell therapy development. Europe’s focus on regulatory compliance and quality-by-design methodologies continues to accelerate uptake across both industry and academia.
Asia-Pacific
Asia-Pacific emerges as the fastest-growing region, contributing around 23% of global market share, driven by expanding biologics manufacturing hubs in China, India, South Korea, and Singapore. Rapid growth in biosimilars, vaccine development, and cell therapy research fuels significant investments in high throughput screening, mini-bioreactors, and automated purification platforms. Regional CDMOs increasingly adopt high throughput tools to serve global clients requiring accelerated development timelines. Government-backed initiatives supporting biotech innovation—combined with expanding domestic R&D capabilities—strengthen demand across universities, biopharma firms, and technology centers. APAC’s cost-competitive manufacturing environment further accelerates large-scale adoption of modern high throughput systems.
Latin America
Latin America holds about 6% of the global market, with gradual adoption driven by increasing investments in pharmaceutical manufacturing and improvements in regional biotechnology infrastructure. Brazil, Mexico, and Argentina lead demand as research institutions and select biopharma companies incorporate high throughput tools to enhance efficiency in upstream and downstream development. Although adoption is at an early stage compared to mature markets, interest grows in automated experimentation, digital workflow systems, and advanced analytical technologies. Rising participation in global clinical research and expanding partnerships with multinational biopharma firms are expected to support continued modernization of process development capabilities.
Middle East & Africa
The Middle East & Africa (MEA) region accounts for around 4% of global market share, with adoption driven primarily by emerging biomanufacturing activities in the UAE, Saudi Arabia, and South Africa. Investments in life sciences parks, vaccine production facilities, and biotechnology research centers contribute to steady progress. While high throughput systems remain limited due to budget constraints and infrastructure gaps, government-backed diversification strategies are increasing demand for modern bioprocess development technologies. Collaborations with international technology providers and academic institutions support incremental upgrades in process analytics, automated screening, and digital lab capabilities across key MEA markets.
Market Segmentations:
By Product & Services Type
- Consumables
- Instruments
- Services
- Software
By Technology
- Chromatography
- UV-Visible Spectroscopy
- Others
By End User
- Biopharmaceutical & Biotechnology Companies
- Contract Research & Manufacturing Organizations (CROs / CMOs)
- Academic & Government Research Institutes / Labs
By Geography
- North America
- U.S.
- Canada
- Mexico
- Europe
- Germany
- France
- U.K.
- Italy
- Spain
- Rest of Europe
- Asia Pacific
- China
- Japan
- India
- South Korea
- South-east Asia
- Rest of Asia Pacific
- Latin America
- Brazil
- Argentina
- Rest of Latin America
- Middle East & Africa
- GCC Countries
- South Africa
- Rest of the Middle East and Africa
Competitive Landscape:
The competitive landscape of the global high throughput process development market is characterized by strong participation from bioprocess technology leaders, automation specialists, and software innovators focused on accelerating biologics development timelines. Companies compete by advancing multi-parallel bioreactor platforms, integrating AI-driven analytics, and enhancing high throughput chromatography and microfluidic systems that support rapid screening and purification optimization. Leading vendors increasingly offer end-to-end solutions combining instruments, consumables, and digital workflow software to strengthen customer retention and streamline process development. Strategic collaborations between biopharmaceutical companies, CDMOs, and technology suppliers are expanding, particularly in areas involving intensified and continuous bioprocessing. Mergers and acquisitions also play a key role as larger players seek to acquire niche innovators in microfluidics, miniaturized bioreactors, and autonomous laboratory technologies. Continuous investments in automation, predictive analytics, and cloud-based data management platforms are shaping a competitive environment focused on delivering greater speed, scalability, and reproducibility for next-generation biologics pipelines.
Key Player Analysis:
- Sartorius AG
- Tecan Trading AG
- Thermo Fisher Scientific Inc.
- Agilent Technologies
- Danaher Corporation
- Luminex Applikon
- Merck KGaA
- Eppendorf AG
- GE Healthcare
- Bio-Rad Laboratories Inc.
Recent Developments:
- In June 2025,Sartorius AG launched the iQue 5 HTS Cytometry Platform, enhancing high-throughput flow cytometry speed and flexibility.
- In November 2024, Sartorius AG opened a new Center for Bioprocess Innovation in Marlborough (USA) to support process development and GMP-suite manufacturing.
- In January 2024, Tecan Trading AG introduced digital lab-productivity tools at SLAS 2024, including “Next-Gen Introspect,” slated for commercial release in Q2 2024, aimed at improving high-throughput experimentation workflows.
Report Coverage:
The research report offers an in-depth analysis based on Product & Services type, Technology, End-User and Geography. It details leading market players, providing an overview of their business, product offerings, investments, revenue streams, and key applications. Additionally, the report includes insights into the competitive environment, SWOT analysis, current market trends, as well as the primary drivers and constraints. Furthermore, it discusses various factors that have driven market expansion in recent years. The report also explores market dynamics, regulatory scenarios, and technological advancements that are shaping the industry. It assesses the impact of external factors and global economic changes on market growth. Lastly, it provides strategic recommendations for new entrants and established companies to navigate the complexities of the market.
Future Outlook:
- High throughput platforms will become core to accelerated biologics, biosimilars, and advanced therapy development cycles.
- Multi-parallel mini bioreactors will increasingly replace traditional bench-scale systems for early process screening.
- AI-driven predictive analytics will further automate condition selection, reducing experimental load and enhancing process accuracy.
- Microfluidic technologies will expand, enabling ultra-low-volume screening for cell lines, media, and vector optimization.
- Continuous and intensified bioprocessing strategies will increase reliance on high throughput purification and resin-screening tools.
- Cloud-native data platforms will standardize cross-site collaboration and strengthen digital bioprocessing ecosystems.
- CDMOs will invest heavily in automated high throughput suites to support faster client timelines and scale-up readiness.
- Integration between upstream and downstream high throughput tools will create more unified, end-to-end development workflows.
- Regulatory expectations for data-rich QbD submissions will accelerate adoption of automated, high-resolution experimentation.
- Emerging markets in Asia-Pacific will drive global expansion as regional biomanufacturing capabilities rapidly modernize.
Request a Free Sample
Fill in your details and we'll send you a free sample report.
- Sample data tables & charts
- Research methodology
Need a Custom Version of This Report?
Tailor the scope, geography, or segments to your exact requirements.
- Custom geography or segment scope
- Direct access to our analyst team
Frequently Asked Questions
What is the current market size for the Global High Throughput Process Development market, and what is its projected size in 2032?
At what Compound Annual Growth Rate is the Global High Throughput Process Development market projected to grow between 2024 and 2032?
Which Global High Throughput Process Development segment held the largest share in 2024?
What are the primary factors fueling the growth of the Global High Throughput Process Development market?
Who are the leading companies in the Global High Throughput Process Development market?
Which region commanded the largest share of the Global High Throughput Process Development market in 2024?
Table of Content
Chapter 1. Report Introduction
- 1.1 Report Description & Purpose
- 1.1.1 Report Title & Market Definition
- 1.1.2 Unique Selling Propositions (USP) & Key Differentiators
- 1.1.3 Value Proposition for Stakeholders
- 1.2 Research Objectives
- 1.2.1 Market Sizing Objectives (Volume & Revenue)
- 1.2.2 Segmentation Objectives
- 1.2.3 Competitive Intelligence Objectives
- 1.2.4 Forecast & Scenario Objectives
- 1.3 Report Scope
- 1.3.1 High Throughput Process Development Scope – Types & Subtypes Covered
- 1.3.2 Geographic Scope – Regions & Countries Covered
- 1.3.3 Historical Period, Base Year & Forecast Period (2024; forecast to 2032)
- 1.3.4 Inclusions & Exclusions
- 1.4 HS Code & Classification Framework
- 1.5 Currency, Units & Pricing Basis
- 1.6 Target Stakeholders
- 1.7 Limitations & Assumptions
Chapter 2. Executive Summary
- 2.1 Global High Throughput Process Development Market Snapshot
- 2.1.1 Market Size – Historical (2024) & Forecast (2024-2032) (2024: USD 20.18 billion → 2032: USD 36.61 billion)
- 2.1.2 Volume & Revenue – Global Totals
- 2.1.3 Key Market Highlights – Top Five Facts
- 2.2 High Throughput Process Development Market Segmentation Snapshot
- 2.2.1 Market Split by Region – 2024 vs. 2032
- 2.3 Competitive Snapshot
- 2.3.1 Top 10 Players by Revenue Share – 2024
- 2.3.2 Top 10 Players by Volume Share – 2024
- 2.3.3 Recent Strategic Developments (18-Month Summary)
- 2.4 Key Investment Highlights & Strategic Conclusions
Chapter 3. High Throughput Process Development Market Dynamics & Industry Analysis
- 3.1 Market Overview & Context
- 3.1.1 High Throughput Process Development Market Position in the Broader Automotive Value Chain
- 3.1.2 OEM vs. Replacement Market Dynamics
- 3.1.3 Market Maturity & Development Stage by Region
- 3.2 High Throughput Process Development Market Drivers
- 3.3 High Throughput Process Development Market Restraints & Challenges
- 3.4 High Throughput Process Development Market Opportunities
- 3.5 Porter's Five Forces Analysis
- 3.5.1 Threat of New Entrants
- 3.5.2 Bargaining Power of Suppliers
- 3.5.3 Bargaining Power of Buyers
- 3.5.4 Threat of Substitutes
- 3.5.5 Competitive Rivalry – Intensity Assessment
- 3.6 High Throughput Process Development Value Chain Analysis
- 3.6.1 Upstream – Raw Material/Input Suppliers
- 3.6.1.1 Raw Material/Input 1
- 3.6.1.2 Raw Material/Input 2
- 3.6.1.3 Raw Material/Input 3
- 3.6.2 Midstream – Production/Manufacturing/Service Delivery
- 3.6.2.1 Production/Process Overview
- 3.6.2.2 Key Facility Locations & Capacity by Manufacturer
- 3.6.3 Downstream – Distribution & End Consumer
- 3.6.3.1 Primary Channel – B2B/OEM
- 3.6.3.2 Secondary Channels – Dealer, Retail, Online, Direct
- 3.6.4 Value Chain Profitability Analysis
- 3.6.1 Upstream – Raw Material/Input Suppliers
- 3.7 PESTEL Analysis
- 3.7.1 Political Factors
- 3.7.2 Economic Factors
- 3.7.3 Social Factors
- 3.7.4 Technological Factors
- 3.7.5 Environmental Factors
- 3.7.6 Legal Factors
- 3.8 High Throughput Process Development Supply Chain Analysis
- 3.8.1 Raw Material/Input Supply Risk Assessment
- 3.8.2 Manufacturing Concentration Risk (Geographic Exposure)
- 3.8.3 Trade Disruption Impact Analysis
- 3.9 Regulatory & Policy Landscape
Note: The regulatory and policy landscape section covers regulations based on their applicability to the market, High Throughput Process Development category, geography, and scope of the study. Only regulatory frameworks with a material impact on operations, compliance, trade, sustainability, or market access are analyzed in detail.
Chapter 4. Key Investment Pockets & Opportunity Analysis
- 4.1 High Throughput Process Development Market Attractiveness Analysis
- 4.1.1 By Region – Investment Attractiveness Matrix (Volume × CAGR)
- 4.2 Absolute Revenue Growth Opportunity
- 4.2.1 By Region – Absolute USD Growth Through 2032
- 4.3 Incremental Volume Opportunity
- 4.3.1 By Region – Incremental Volume Through 2032
- 4.3.2 Segment – Incremental Volume
- 4.4 Emerging Submarket Opportunity Deep Dive (Subject to Applicability)
- 4.5 Emerging Market Opportunity Scorecards
- 4.5.1 United States
- 4.5.2 Europe
- 4.5.3 Asia
- 4.5.4 Middle East & Africa
Note: Emerging Market Opportunity Scorecards will be included based on relevance and strategic importance. Regions listed are indicative and may vary depending on data availability and market dynamics.
Chapter 5. High Throughput Process Development Import-Export Analysis & Trade Flows
- 5.1 Global Trade Overview
- 5.1.1 Global Export Value by Country (2024)
- 5.1.2 Global Export Volume by Country (2024)
- 5.1.3 Global Import Value by Country (2024)
- 5.1.4 Global Import Volume by Country (2024)
- 5.1.5 Net Trade Balance by Country (2024)
- 5.2 Export Analysis – Segment
- 5.2.1 Type 1 (HS Code)
- 5.2.2 Type 2 (HS Code)
- 5.2.3 Type 3 (HS Code)
- 5.2.4 Type 4 (HS Code)
- 5.2.5 Type 5 (HS Code)
- 5.3 Import Analysis – Segment
- 5.3.1 Type 1 (HS Code)
- 5.3.2 Type 2 (HS Code)
- 5.3.3 Type 3 (HS Code)
- 5.3.4 Type 4 (HS Code)
- 5.3.5 Type 5 (HS Code)
- 5.4 Average Unit Trade Prices
- 5.4.1 Average Export Price – Segment & Country
- 5.4.2 Average Import Price – Segment & Source Country
- 5.4.3 Price Trends (2024)
- 5.5 Key Trade Route Analysis
- 5.5.1 Trade Route 1
- 5.5.2 Trade Route 2
- 5.5.3 Trade Route 3
- 5.5.4 Trade Route 4
- 5.5.5 Trade Route 5
- 5.6 Trade Policy Impact Assessment
- 5.6.1 US Anti-Dumping & Section 301 Tariffs
- 5.6.2 EU Customs Union Impact
- 5.6.3 Major Free Trade Agreements
- 5.6.4 USMCA Rules of Origin
Note: Trade policy analysis will be included only where relevant to the High Throughput Process Development market.
Chapter 6. Competitive Landscape & Company Benchmarking
- 6.1 High Throughput Process Development Market Concentration & Structure
- 6.1.1 Herfindahl-Hirschman Index (HHI) – vs. 2024
- 6.1.2 Tier 1, Tier 2 & Tier 3 Market Structure
- 6.1.3 Global, Regional & Local Player Dynamics
- 6.2 High Throughput Process Development Market Share Analysis – 2024
- 6.2.1 Global Revenue Share by Company
- 6.2.2 Global Volume Share by Company
- 6.2.3 Regional Revenue Share
- 6.2.4 Market Share Evolution ( vs. 2024)
- 6.2.5 OEM Segment Share by Company
- 6.2.6 Replacement Segment Share by Company
- 6.3 Production/Delivery Capacity & Facility Analysis
- 6.3.1 Global Installed Capacity
- 6.3.2 Capacity Utilization Rates
- 6.3.3 Production/Output Volume
- 6.3.4 Facility Locations & Capacity Map
- 6.3.5 Planned Capacity Additions
- 6.4 High Throughput Process Development Competitive Benchmarking Matrix
- 6.4.1 Revenue, Volume, CAGR & Profitability Comparison
- 6.4.2 Channel Revenue Mix
- 6.4.3 Geographic Revenue Exposure
- 6.4.4 R&D Intensity
- 6.4.5 Sustainability Maturity
- 6.5 Strategic Developments in High Throughput Process Development (Last 24 Months)
- 6.5.1 Mergers, Acquisitions & Divestments
- 6.5.2 New High Throughput Process Development Launches
- 6.5.3 Facility Expansions
- 6.5.4 Strategic Alliances, Joint Ventures & Partnerships
- 6.5.5 Distribution Expansion & Market Entry
- 6.5.6 Sustainability & ESG Initiatives
- 6.6 Competitive Strategy Mapping
- 6.6.1 Leader, Challenger, Follower & Niche Classification
- 6.6.2 Pricing Strategy Comparison
- 6.6.3 Channel Strategy Matrix
Note: Strategic developments are included based on their materiality and the availability of reliable information.
Chapter 7. Global High Throughput Process Development Market – By Distribution Channel
- 7.1 Segment Overview
- 7.1.1 Volume & Revenue Split by Channel (2024 & 2032)
- 7.1.2 Channel Mix Evolution (2024-2032)
Chapter 8. Regional Market Analysis – Global Overview
- 8.1 Global Regional Overview
- 8.1.1 Regional Volume Share
- 8.1.2 Regional Revenue Share
- 8.1.3 Regional Volume by Region
- 8.1.4 Regional Revenue by Region
- 8.1.5 Regional Forecast Through 2032
- 8.2 Cross-Regional Segment Analysis
- 8.2.1 By Distribution Channel
- 8.2.2 By Brand/Price Tier
Chapter 9. North America High Throughput Process Development Market
- 9.1 United States
- 9.2 Canada
- 9.3 Mexico
Chapter 10. Europe High Throughput Process Development Market
- 10.1 Germany
- 10.2 France
- 10.3 Italy
- 10.4 United Kingdom
- 10.5 Spain
- 10.6 Poland
- 10.7 Russia
- 10.8 Netherlands
- 10.9 Belgium
- 10.10 Sweden
- 10.11 Denmark
- 10.12 Norway
- 10.13 Rest of Europe
Chapter 11. Asia Pacific High Throughput Process Development Market
- 11.1 China
- 11.2 India
- 11.3 Japan
- 11.4 South Korea
- 11.5 Thailand
- 11.6 Indonesia
- 11.7 Vietnam
- 11.8 Malaysia
- 11.9 Australia
- 11.10 Rest of Asia Pacific
Chapter 12. Latin America High Throughput Process Development Market
- 12.1 Brazil
- 12.2 Argentina
- 12.3 Colombia
- 12.4 Chile
- 12.5 Rest of Latin America
Chapter 13. Middle East High Throughput Process Development Market
- 13.1 Saudi Arabia
- 13.2 United Arab Emirates
- 13.3 Turkey
- 13.4 Israel
- 13.5 Iran
- 13.6 Rest of the Middle East
Chapter 14. Africa High Throughput Process Development Market
- 14.1 South Africa
- 14.2 Egypt
- 14.3 Nigeria
- 14.4 Morocco
- 14.5 Rest of Africa
Chapter 15. High Throughput Process Development Company Profiles
- 15.1 [Company 01]
- 15.1.1 Company Overview
- 15.1.2 Key Management Personnel
- 15.1.3 Products & Services Portfolio
- 15.1.4 Financial Performance
- 15.1.5 Key Market Focus & Geographic Presence
- 15.1.6 Recent Developments & Strategic Initiatives
Note: The company profile list is preliminary and may change based on research findings, market developments, data availability, and client requirements.
Chapter 16. Appendices
- Appendix A – List of Abbreviations & Acronyms
- Appendix B – Industry Classification Code Reference – Full Series
- Appendix C – Production & Capacity Data Tables
- Appendix D – End-Use & Demand Base Tables
- Appendix E – Consumption & Replacement Rate Assumptions
- Appendix F – ASP Reference Tables
- Appendix G – Manufacturing & Facility Database
- Appendix H – Import-Export Data Tables
- Appendix I – Regulatory Summary Tables
- Appendix J – Primary Research Participant List (Anonymized)
- Appendix K – Primary Research Questionnaire Framework
- Appendix L – Data Sources & Bibliography
- Appendix M – Market Size Divergence & Source Comparison
Chapter 17. Research Methodology
- 17.1 Research Framework & Philosophy
- 17.2 Secondary Research – Sources, Hierarchy & Data Extraction
- 17.3 Data Modeling – Bottom-Up & Top-Down Market Sizing
- 17.4 Primary Research – Stakeholder Framework, LOI & Sample Sizes
- 17.5 Forecast Methodology – Regression, Scenario & Sensitivity Analysis
- 17.6 Quality Control – Four-Layer Validation Framework
- 17.7 Limitations & Standard Assumptions
- 17.8 Disclaimer
