Market Overview
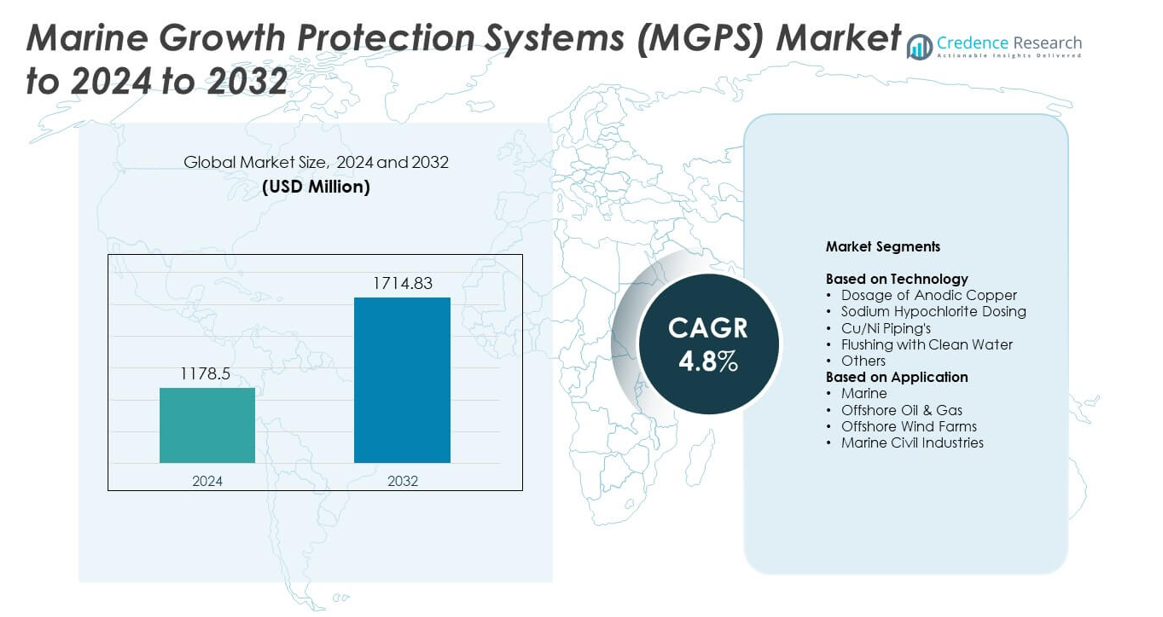
Marine Growth Protection Systems (MGPS) Market size was valued at USD 1178.5 million in 2024 and is anticipated to reach USD 1714.83 million by 2032, at a CAGR of 4.8% during the forecast period.
| REPORT ATTRIBUTE |
DETAILS |
| Historical Period |
2020-2023 |
| Base Year |
2024 |
| Forecast Period |
2025-2032 |
| Marine Growth Protection Systems (MGPS) Market Size 2024 |
USD 1178.5 million |
| Marine Growth Protection Systems (MGPS) Market, CAGR |
4.8% |
| Marine Growth Protection Systems (MGPS) Market Size 2032 |
USD 1714.83 million |
The Marine Growth Protection Systems (MGPS) Market is shaped by leading players such as Schneider Electric SE, Kongsberg Gruppen ASA, Caterpillar Inc., Flowline Inc., Pentair plc, Evac Group (Cathelco) (U.K.), Wärtsilä Corporation, Ecolab Services, and Buhler Group. These companies compete through advances in anti-fouling efficiency, environmentally compliant dosing technologies, and system durability for commercial fleets and offshore assets. Europe emerged as the leading region with nearly 32% share in 2024, supported by strong regulatory enforcement and extensive offshore activity. Asia Pacific followed with about 30% share, driven by large shipbuilding hubs and rapid maritime expansion, while North America held close to 28% share due to high retrofit demand and rising offshore wind development.
Market Insights
- The Marine Growth Protection Systems (MGPS) Market was valued at USD 1178.5 million in 2024 and is projected to reach USD 1714.83 million by 2032 at a CAGR of 4.8%.
- Market growth is driven by rising biofouling pressure across global fleets and stronger regulatory demands that require continuous protection in cooling-water systems.
- Trends include adoption of eco-friendly MGPS technologies and digital monitoring that improves dosing accuracy and lowers maintenance needs across vessels and offshore assets.
- The competitive landscape features strong innovation focus, with leading vendors improving durability, lowering chemical discharge, and expanding retrofit capabilities as dosage of anodic copper leads the technology segment with about 46% share.
- Regionally, Europe leads the market with nearly 32% share in 2024, followed by Asia Pacific at around 30% and North America at close to 28%, supported by strong fleet activity, offshore development, and rising compliance requirements.
Access crucial information at unmatched prices!
Request your sample report today & start making informed decisions powered by Credence Research Inc.!
Download Sample
Market Segmentation Analysis:
By Technology
Dosage of anodic copper held the leading share in 2024 with about 46% of the market. Shipowners favored this method due to steady ion release, long service life, and low manual upkeep. The technology helped reduce barnacle and algae buildup in seawater circuits, which improved heat-exchange efficiency across large vessels. Sodium hypochlorite dosing gained traction in ports with strict biofouling rules, while Cu/Ni piping systems saw use in high-corrosion zones. Flushing with clean water and other niche methods supported smaller or specialized fleets needing simple anti-fouling steps.
- For instance, AION-Pro’s Marine Growth Prevention Systems (MGPS) typically operate with a normal dosing rate of 2 parts per billion (\(\mathbf{2\ }\text{ppb}\)) of copper ions in seawater circuits.
By Application
Marine applications dominated the market in 2024 with nearly 54% share. Commercial ships, naval fleets, and passenger vessels relied heavily on MGPS to maintain cooling-water flow and cut maintenance downtime. Rising vessel size and longer operating cycles increased demand for systems that prevent biofouling in intakes, pumps, and heat exchangers. Offshore oil and gas platforms adopted MGPS to protect critical subsea equipment, while offshore wind farms expanded use due to growing turbine installations. Marine civil industries applied MGPS in docks, seawater pumps, and intake structures to extend asset life.
- For instance, Evac Group’s Cathelco marine growth prevention systems are found on more than 50,000 ships worldwide across various segments, including cargo vessels, yachts, cruise ships, and military craft.
Key Growth Drivers
Rising Biofouling Pressure in Global Fleets
Growth accelerated as vessel operators faced higher biofouling buildup due to warmer sea temperatures and longer sailing cycles. Ships depended on MGPS to protect cooling systems, maintain fuel efficiency, and avoid unplanned downtime. Increasing international focus on hull and seawater-system cleanliness pushed more owners to adopt continuous protection. Stronger regulatory pressure from major coastal regions further encouraged installation of reliable anti-fouling solutions across cargo ships, tankers, bulk carriers, and naval fleets.
- For instance, EMCS Industries, the original inventor of the electrolytic Marine Growth Prevention System (\(\text{MGPS}\)) in the 1950s, has deployed its MARELCO™ antifouling systems globally across thousands of vessels over several decades.
Expansion of Offshore Oil, Gas, and Wind Projects
Offshore infrastructure required strong protection for cooling circuits, subsea pumps, turbine foundations, and intake systems. MGPS adoption rose as operators sought longer equipment life and fewer maintenance shutdowns in harsh marine settings. Growing offshore wind capacity increased demand for biofouling control to support uninterrupted turbine cooling. Investments in new rigs and subsea systems continued to raise the need for high-reliability corrosion and fouling-prevention technologies.
- For instance, Evoqua’s SeaCURE system handles ballast water flows near 1,200 cubic metres per hour.
Shift Toward Energy Efficiency and Reduced Operating Costs
Fleet owners used MGPS to cut energy losses linked to blocked strainers and reduced water-flow efficiency. Cleaner systems helped maintain optimal engine cooling, which improved vessel performance over long routes. Rising fuel costs pushed operators to use MGPS to maintain stable heat-exchange efficiency and reduce manual cleaning needs. These savings supported broader adoption, especially across high-utilization commercial fleets.
Key Trends & Opportunities
Growth of Eco-Friendly and Non-Toxic MGPS Solutions
Demand increased for chlorine-free and low-metal solutions as environmental rules tightened across major ports. Suppliers invested in greener dosing systems, advanced materials, and controlled-release technologies. Ports promoting zero-discharge policies created new openings for environmentally compliant MGPS units. These systems attracted shipowners wanting long-term regulatory stability and reduced environmental impact.
- For instance, BIO-UV’s BIO-SEA reactors handle 75 to 2,000 cubic metres hourly using UV treatment.
Digital Monitoring and Smart Marine Protection Systems
Shipowners began using remote-monitoring tools to control MGPS dosage, track performance, and predict fouling risks. Data-driven systems reduced maintenance costs by optimizing ion release and system cycles. Integration with vessel-performance platforms created new opportunities for smart MGPS adoption. Digitalization improved compliance reporting and boosted operational efficiency across large fleets.
- For instance, Wilson Walton’s PRAICOMATIC panels are part of a range of Impressed Current Cathodic Protection (ICCP) systems that output various combinations of amperes and voltages(e.g., from tens of amps to hundreds of amps, typically around 12-24 volts) with continuous monitoring capabilities.
Key Challenges
High Installation and Retrofitting Costs
Many older vessels required complex retrofits to integrate MGPS into existing seawater systems. High equipment and engineering costs slowed adoption among small and mid-size fleets. Operators often delayed upgrades due to tight budgets and uncertain freight cycles. These barriers limited market penetration in cost-sensitive regions.
Environmental and Chemical-Discharge Restrictions
Tighter limits on copper release, chlorine discharge, and biocide use created compliance challenges for some MGPS technologies. Shipowners needed to adjust dosage, shift to low-toxicity options, or invest in hybrid systems. Changing regional rules increased uncertainty and raised the cost of meeting multi-port environmental standards.
Regional Analysis
North America
North America held about 28% share in 2024, supported by large commercial fleets, naval modernization, and strict biofouling compliance rules across the United States and Canada. Demand grew as shipowners prioritized MGPS to maintain cooling-water efficiency in cargo vessels, offshore support ships, and coastal infrastructure. Expanding offshore wind activity on the U.S. East Coast increased the need for reliable protection systems. Strong port regulations and higher maintenance standards encouraged operators to adopt automated and low-toxicity MGPS solutions. Regional growth also benefited from rising retrofits across older fleets requiring continuous fouling control.
Europe
Europe captured nearly 32% share in 2024, driven by dense commercial shipping routes, strong naval presence, and early adoption of environmentally compliant MGPS technologies. The region’s strict chemical-discharge limits pushed operators toward advanced copper-dosing and low-chlorine systems. Countries such as Germany, the Netherlands, Norway, and the U.K. expanded offshore oil, gas, and wind projects, boosting MGPS demand for subsea structures and cooling networks. Growing focus on vessel efficiency and sustainable marine operations supported wider system upgrades. Europe’s strong ship-repair hubs also fueled retrofit activity across aging fleets.
Asia Pacific
Asia Pacific accounted for about 30% share in 2024, driven by large shipbuilding bases in China, Japan, and South Korea. The region’s expanding merchant fleet and heavy offshore industrial activity increased the need for consistent biofouling control. Rising port traffic across Southeast Asia encouraged vessel owners to adopt MGPS to maintain reliable engine cooling and reduce unscheduled downtime. Offshore oil and gas operations in China and Malaysia also supported installations. Strong investment in coastal infrastructure and shipyard modernization made Asia Pacific a long-term growth center for MGPS adoption.
Latin America
Latin America held around 5% share in 2024, supported by offshore oil production in Brazil and coastal industrial sites requiring cleaner seawater-intake systems. Marine operators in Brazil, Mexico, and Colombia used MGPS to extend equipment life under high-fouling tropical waters. Growing maritime logistics along the Pacific and Atlantic coasts encouraged wider use of MGPS to maintain vessel reliability. Budget constraints limited adoption across smaller regional fleets, yet rising offshore projects created steady demand. Port modernization programs across Chile and Brazil added new opportunities for MGPS retrofits.
Middle East & Africa
Middle East & Africa accounted for nearly 5% share in 2024, driven by offshore oil platforms, desalination plants, and marine civil structures dependent on uninterrupted seawater flow. Operators in the UAE, Saudi Arabia, and Qatar installed MGPS to reduce fouling-related downtime across pumps, condensers, and cooling-intake networks. Rising ship repair activity in the region also supported fleet retrofits. African coastal markets remained smaller but showed gradual uptake as port operations modernized. High salinity and warmer waters increased the need for strong, corrosion-resistant MGPS technologies across key industrial hubs.
Market Segmentations:
By Technology
- Dosage of Anodic Copper
- Sodium Hypochlorite Dosing
- Cu/Ni Piping’s
- Flushing with Clean Water
- Others
By Application
- Marine
- Offshore Oil & Gas
- Offshore Wind Farms
- Marine Civil Industries
By Geography
- North America
- Europe
- Germany
- France
- U.K.
- Italy
- Spain
- Rest of Europe
- Asia Pacific
- China
- Japan
- India
- South Korea
- South-east Asia
- Rest of Asia Pacific
- Latin America
- Brazil
- Argentina
- Rest of Latin America
- Middle East & Africa
- GCC Countries
- South Africa
- Rest of the Middle East and Africa
Competitive Landscape
The competitive landscape in the Marine Growth Protection Systems (MGPS) Market includes major companies such as Schneider Electric SE, Kongsberg Gruppen ASA, Caterpillar Inc., Flowline Inc., Pentair plc, Evac Group (Cathelco) (U.K.), Wärtsilä Corporation, Ecolab Services, and Buhler Group. The market features strong competition driven by performance reliability, compliance with tightening environmental rules, and long-term operational efficiency. Vendors focus on improving system durability, reducing chemical discharge, and enhancing compatibility with diverse vessel cooling-water networks. Growing interest in digital monitoring encourages suppliers to integrate smart controls and predictive maintenance tools. Many providers also expand retrofit solutions to serve aging fleets across commercial, naval, and offshore sectors. Investments in environmentally compliant dosing systems and advanced materials shape differentiation strategies. Regional service networks and quick-response maintenance support remain critical advantages. As global regulations evolve, companies increasingly compete on sustainability, automation capabilities, and lifecycle cost reduction to strengthen their market position.
Shape Your Report to Specific Countries or Regions & Enjoy 30% Off!
Key Player Analysis
Recent Developments
- In 2024, Evac Group Launched the Cathelco USP DragGone™, a new ultrasonic antifouling technology designed to combat hull biofouling, reducing fuel consumption by up to 13%.
- In 2024, Schneider Electric joined a consortium developing the world’s first offshore charging station for cruise ships near Orkney, using renewable energy to cut emissions and support cleaner ship operations that operate together with ballast-water and marine-growth control solutions.
- In 2024, Kongsberg Maritime received DNV approval in principle for a shore-based chief engineer control centre that remotely monitors power, ballast-water, and deck-machinery systems on electric container vessels, strengthening digital supervision of systems tied to ballast-water and biofouling management
Report Coverage
The research report offers an in-depth analysis based on Technology, Application and Geography. It details leading market players, providing an overview of their business, product offerings, investments, revenue streams, and key applications. Additionally, the report includes insights into the competitive environment, SWOT analysis, current market trends, as well as the primary drivers and constraints. Furthermore, it discusses various factors that have driven market expansion in recent years. The report also explores market dynamics, regulatory scenarios, and technological advancements that are shaping the industry. It assesses the impact of external factors and global economic changes on market growth. Lastly, it provides strategic recommendations for new entrants and established companies to navigate the complexities of the market.
Future Outlook
- Demand for MGPS will rise as global fleets face stronger biofouling pressure.
- Offshore wind expansion will increase the need for long-life protection systems.
- Shipowners will adopt greener MGPS technologies to meet stricter port rules.
- Digital monitoring will grow as fleets shift toward automated fouling control.
- Retrofitting activity will expand across aging commercial and naval vessels.
- Low-maintenance MGPS designs will gain traction to cut operational downtime.
- Growth in desalination and coastal infrastructure will support wider adoption.
- Hybrid MGPS solutions will emerge to balance performance and environmental limits.
- Regional environmental policies will drive faster technology upgrades.
- Rising vessel traffic will push operators to standardize MGPS across large fleets.


