Market Overview:
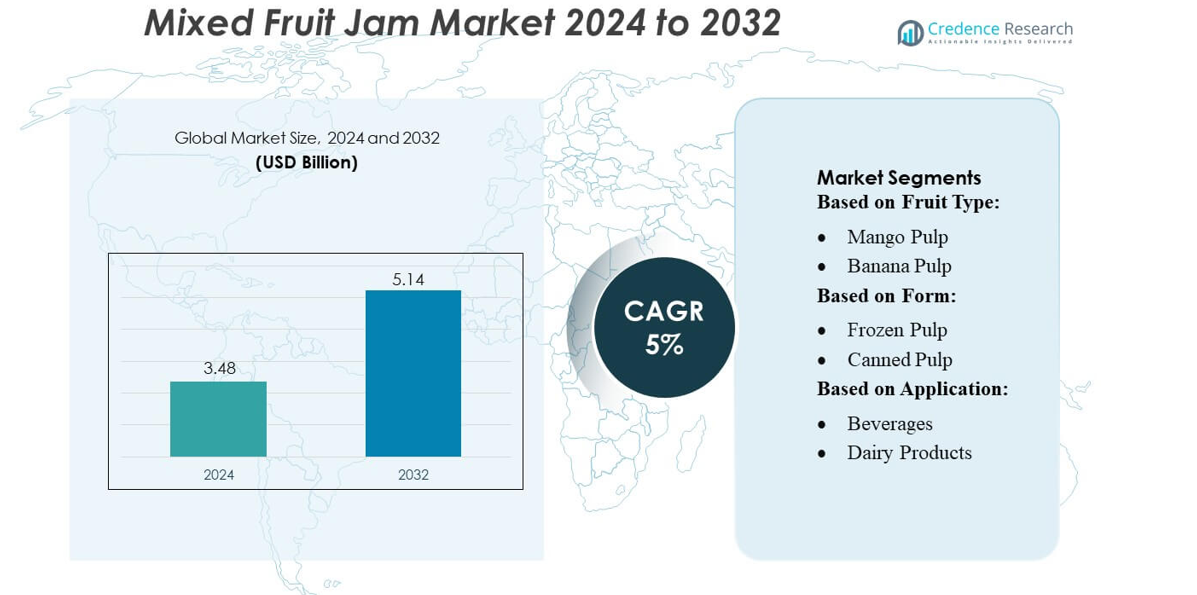
Mixed Fruit Jam Market size was valued USD 3.48 billion in 2024 and is anticipated to reach USD 5.14 billion by 2032, at a CAGR of 5% during the forecast period.
| REPORT ATTRIBUTE |
DETAILS |
| Historical Period |
2020-2023 |
| Base Year |
2024 |
| Forecast Period |
2025-2032 |
| Mixed Fruit Jam Market Size 2024 |
USD 3.48 billion |
| Mixed Fruit Jam Market, CAGR |
5% |
| Mixed Fruit Jam Market Size 2032 |
USD 5.14 billion |
The Mixed Fruit Jam Market is highly competitive, with key players such as Grimmway Farms, Dole Food Company, Inc., Naturipe Farms, LLC, Chiquita Brands International, Inc., Sunkist Growers, Inc., General Mills Inc., Tanimura & Antle Fresh Foods, Inc., Fresh Del Monte Produce, Inc., Berry Global Inc., and Sysco Corporation driving innovation and market expansion. These companies focus on product differentiation through premium and exotic fruit blends, clean-label formulations, and advanced processing technologies to enhance quality and shelf life. Strategic initiatives such as partnerships, mergers, and expanded distribution channels strengthen their market position. North America emerges as the leading region, accounting for 28% of the global market share, supported by high consumer awareness of healthy foods, widespread retail networks, and strong adoption of bakery, dairy, and beverage applications, making it a primary growth hub for mixed fruit jam consumption.
Market Insights
- The Mixed Fruit Jam Market size was valued at USD 3.48 billion in 2024 and is projected to reach USD 5.14 billion by 2032, growing at a CAGR of 5% during the forecast period.
- The market is driven by rising consumer preference for natural, healthy, and clean-label fruit products, along with increasing demand for premium and exotic fruit blends across bakery, dairy, and beverage applications.
- Key trends include the adoption of innovative flavors, preservative-free formulations, and advanced processing and packaging technologies that enhance shelf life and product quality, supported by growing e-commerce and online retail channels.
- The competitive landscape is highly dynamic, with major players focusing on strategic partnerships, mergers, and expanded distribution to strengthen market positioning. North America leads with a 28% market share, while Asia-Pacific and Europe follow as emerging growth regions.
- Challenges include seasonal fruit supply fluctuations and price volatility, requiring reliable sourcing, cold-chain logistics, and sustainable production practices to maintain consistent product quality.
Access crucial information at unmatched prices!
Request your sample report today & start making informed decisions powered by Credence Research Inc.!
Download Sample
Market Segmentation Analysis:
By Fruit Type:
The mixed fruit jam market by fruit type is dominated by Mango Pulp, accounting for the largest market share of approximately 32%, driven by mango’s year-round popularity, high natural sweetness, and versatility in jams and spreads. Berry pulps, including Strawberry and Blueberry, follow as emerging sub-segments due to rising consumer demand for antioxidant-rich, premium jams. Citrus pulps, particularly Orange, are gaining traction for their natural tang and functional benefits. Key drivers include increasing health awareness, preference for exotic and tropical fruit flavors, and the incorporation of fruit blends in premium jam offerings.
- For instance, Grimmway Farms — though primarily known for carrots — demonstrate the scale and operational capability that could support expansion into fruit‑based products, as they already manage more than 65 organic crops and over 135 seasonal and year‑round products.
By Form:
In terms of product form, Canned Pulp holds dominance with around 45% market share, attributed to its longer shelf life, convenience in storage, and consistent quality for industrial and retail use. Frozen Pulp is witnessing significant growth, particularly in premium and export segments, as it retains flavor and nutrients better than heat-processed forms. Concentrated Pulp is preferred in bakery and beverage applications for cost-effective usage. Growth is fueled by rising demand for ready-to-use jam bases, streamlined manufacturing processes, and increased adoption by foodservice industries.
- For instance, Dole operates roughly 250 global facilities, including cold‑storage, packing houses, and manufacturing plants, which support its capacity to process and preserve fruit pulp consistently under controlled conditions.
By Application:
By application, Bakery and Snacks lead the market with nearly 35% share, as jams are extensively used in pastries, bread spreads, and confectionery fillings. Beverages and Dairy Products are rapidly emerging sub-segments due to growing adoption of fruit-infused drinks, yogurts, and smoothies. Drivers include the rising trend of functional foods, expanding bakery chains, and increasing consumer inclination toward fruit-based indulgence products. Additionally, the rise of home baking and artisanal jam consumption supports sustained growth in diversified applications.
Key Growth Drivers
Rising Consumer Preference for Healthy and Natural Foods
The growing awareness of health and nutrition is driving demand for mixed fruit jams made from natural fruit pulps with minimal preservatives. Consumers increasingly seek functional foods rich in vitamins, antioxidants, and fiber. This shift encourages manufacturers to introduce fruit blends and premium offerings, fueling market expansion. Additionally, the popularity of clean-label products in both retail and foodservice sectors supports higher consumption, particularly in bakery, dairy, and beverage applications, sustaining long-term growth in the mixed fruit jam segment.
- For instance, Naturipe has significantly reduced its total greenhouse-gas emissions by approximately 100,000 metric tons since 2019, implemented programs to incorporate certified recycled plastic packaging, and expanded renewable-energy use such that over 35% of its packing and cooling operations now run on clean energy.
Expansion of Bakery, Confectionery, and Dairy Industries
Rapid growth in bakery chains, confectionery, and dairy products worldwide has significantly boosted the mixed fruit jam market. Jams are increasingly used as fillings, toppings, and flavor enhancers, particularly in pastries, spreads, and yogurt-based products. Rising urbanization and changing lifestyles drive higher consumption of convenience and indulgence foods. Manufacturers are leveraging these trends by developing innovative fruit combinations, premium packaging, and easy-to-use forms, positioning mixed fruit jams as versatile ingredients across multiple segments, thus accelerating overall market growth.
- For instance, Chiquita’s “Behind the Blue Sticker” initiative reports that 59% of its farmland has been rejuvenated, improving average yields by approximately 20%, which enhances fruit availability for derivative products.
Technological Advancements and Product Innovation
Innovations in fruit processing, pulp preservation, and packaging are enabling manufacturers to maintain flavor, color, and nutritional value for extended periods. Techniques like vacuum concentration, aseptic processing, and frozen pulp storage enhance quality and shelf life. These advancements support the production of premium and exotic fruit blends, meeting consumer demand for variety and superior taste. Additionally, automation in processing and packaging reduces production costs, improving scalability and market reach, particularly in emerging economies, thereby driving growth in the mixed fruit jam market.
Key Trends & Opportunities
Premium and Exotic Fruit Blends
Consumers increasingly seek unique flavors, driving the demand for jams made from mango-berry, citrus-apple, and tropical fruit blends. Premium offerings with high fruit content, natural sweetness, and reduced sugar are gaining traction. This trend creates opportunities for small-scale artisanal producers and established brands to differentiate products through innovative flavors, attractive packaging, and limited-edition releases, enhancing brand loyalty while expanding market penetration across gourmet and specialty retail channels.
- For instance, James Ford Bell Technical Center, adding a 35,000‑square‑foot, two‑story pilot‑plant wing, which increases its pilot‑plant capacity by over 20%, thereby enabling faster development and testing of new formulations and packaging solutions.
Increasing Adoption in Beverages and Functional Foods
The use of mixed fruit jams in beverages, smoothies, yogurts, and health drinks is growing rapidly. Fruit-based functional products rich in antioxidants and vitamins align with the rising health-conscious consumer segment. This trend presents opportunities for jam manufacturers to diversify applications beyond traditional spreads, catering to both retail and foodservice sectors. Collaboration with beverage and dairy brands for co-branded or flavored offerings further strengthens product visibility and consumption, driving market growth.
- For instance, Tanimura & Antle Fresh Foods, Inc. farms over 30,000 acres of premium fresh produce annually, including a diverse array of leafy greens and vegetables, enabling a large-scale, consistent supply of quality vegetable bases suitable for various fresh-cut and processed food applications.
E-commerce and Online Retail Expansion
The surge in online grocery shopping and direct-to-consumer platforms offers new distribution channels for mixed fruit jams. Consumers prefer doorstep delivery of premium and exotic fruit blends, including artisanal and small-batch varieties. This trend enables manufacturers to reach wider geographic markets with minimal physical retail investment. Digital marketing, subscription models, and social media campaigns further enhance brand awareness, creating opportunities to tap into health-conscious and convenience-driven customer segments while increasing overall sales volume.
Key Challenges
Supply Chain and Raw Material Volatility
Fluctuating fruit availability, seasonal variations, and climate-related disruptions pose significant challenges to consistent jam production. Price volatility of key fruits like mango, berries, and citrus affects profitability, particularly for premium blends. Manufacturers must maintain reliable sourcing, invest in cold-chain logistics, and adopt preservation technologies to mitigate risks. Failure to manage these factors can lead to product shortages, inconsistent quality, and higher production costs, hindering market growth despite increasing consumer demand.
Stringent Food Safety and Regulatory Compliance
Mixed fruit jam manufacturers face strict regulations regarding additives, preservatives, labeling, and hygiene standards across global markets. Compliance with food safety protocols, quality certifications, and import-export requirements increases operational complexity and cost. Non-compliance risks recalls, fines, and reputational damage. Small and medium-sized producers, in particular, may struggle with regulatory adherence, limiting expansion opportunities. Navigating these challenges requires investment in quality management systems, testing laboratories, and traceability mechanisms to ensure safety while sustaining market competitiveness.
Regional Analysis
North America
North America leads the mixed fruit jam market with an estimated 28% market share, driven by high consumer awareness of healthy and natural foods. The U.S. dominates due to strong demand for fruit spreads, bakery applications, and artisanal jams. Rising adoption of premium and exotic fruit blends, along with growth in e-commerce platforms, fuels market expansion. Canada contributes through increasing health-conscious consumption and bakery innovation. Key growth factors include strong retail distribution networks, rising demand for organic and reduced-sugar products, and technological advancements in fruit processing, which ensure consistent quality and extended shelf life.
Europe
Europe holds approximately 25% market share in the mixed fruit jam market, supported by a long-standing tradition of fruit preserves and spreads. Countries like Germany, France, and the U.K. are key contributors, driven by premium and artisanal products, organic offerings, and bakery integration. Consumers increasingly prefer jams with natural ingredients, exotic blends, and functional benefits. Market growth is further reinforced by bakery and confectionery industry expansion, rising demand for ready-to-use fruit bases, and the prevalence of private-label jams in retail chains. Sustainable sourcing and innovative packaging are emerging trends enhancing market appeal.
Asia-Pacific
The Asia-Pacific region accounts for about 30% market share, led by India, China, and Japan due to abundant fruit production and growing domestic consumption. Rising disposable income, urbanization, and increasing bakery and confectionery chains fuel demand for mixed fruit jams. Consumers show strong preference for tropical fruit blends such as mango, guava, and pineapple. Export demand, particularly for premium and exotic jams, also drives growth. Key market enablers include expanding cold-chain infrastructure, technological adoption in pulp processing, and increasing awareness of natural and functional food products across urban populations.
Latin America
Latin America contributes roughly 10% market share, with Brazil and Mexico leading due to rich tropical fruit availability and increasing bakery and beverage consumption. The market is driven by the rising popularity of mixed fruit jams with tropical and citrus blends, supported by domestic production and export opportunities. Urbanization, growing retail networks, and rising consumer preference for convenience foods are key growth factors. Challenges include seasonal fruit availability and price fluctuations, but innovations in preservation and pulp processing are enabling year-round supply and premium offerings, enhancing market growth prospects across the region.
Middle East & Africa
The Middle East & Africa hold around 7% market share, driven by the growing demand for premium and imported fruit jams in urban centers. Countries such as the UAE, Saudi Arabia, and South Africa are witnessing increased consumption in bakery, dairy, and confectionery applications. Factors supporting growth include rising disposable income, modernization of retail channels, and adoption of exotic and tropical fruit blends. Import reliance and supply chain constraints remain challenges, but opportunities exist in health-focused, natural, and organic jam offerings. E-commerce platforms are further enhancing market reach in this region.
Market Segmentations:
By Fruit Type:
By Form:
By Application:
By Geography
- North America
- Europe
- Germany
- France
- U.K.
- Italy
- Spain
- Rest of Europe
- Asia Pacific
- China
- Japan
- India
- South Korea
- South-east Asia
- Rest of Asia Pacific
- Latin America
- Brazil
- Argentina
- Rest of Latin America
- Middle East & Africa
- GCC Countries
- South Africa
- Rest of the Middle East and Africa
Competitive Landscape
The mixed fruit jam market include Grimmway Farms, Dole Food Company, Inc., Naturipe Farms, LLC, Chiquita Brands International, Inc., Sunkist Growers, Inc., General Mills Inc., Tanimura & Antle Fresh Foods, Inc., Fresh Del Monte Produce, Inc., Berry Global Inc., and Sysco Corporation. The mixed fruit jam market is highly competitive, driven by innovation, product differentiation, and expanding distribution networks. Companies focus on developing premium and exotic fruit blends, clean-label formulations, and preservative-free offerings to meet growing consumer demand for natural and health-conscious products. Strategies such as mergers, strategic partnerships, and private-label collaborations enhance market positioning and brand visibility. Investment in advanced processing technologies, quality control, and sustainable sourcing ensures consistent taste, extended shelf life, and supply reliability. Additionally, the rise of e-commerce and international expansion presents opportunities to capture emerging markets, making agility, product innovation, and consumer-centric strategies critical for maintaining competitiveness.
Shape Your Report to Specific Countries or Regions & Enjoy 30% Off!
Key Player Analysis
- Grimmway Farms
- Dole Food Company, Inc.
- Naturipe Farms, LLC
- Chiquita Brands International, Inc.
- Sunkist Growers, Inc.
- General Mills Inc.
- Tanimura & Antle Fresh Foods, Inc.
- Fresh Del Monte Produce, Inc.
- Berry Global Inc.
- Sysco Corporation
Recent Developments
- In March 2025, Tropic in Norwich unveiled a gene-edited non-browning banana, designed to stay fresh for up to 12 hours post-peel targeted to reduce waste and meet global demand, with rollouts planned in the US, Canada, and parts of Latin America.
- In August 2024, The Indian Institute of Horticultural Research (ICAR-IIHR) in Hesaraghatta, Karnataka, announced the development of a new method to introduce dragon fruit powder, which reduces production costs by around 50%, while enhancing its nutritional quality.
- In June 2023, Cabosse Naturals, a brand of Barry Callebaut, a Swiss-based chocolate producer, launched a 100% free-flowing cacaofruit powder. This ingredient can be used to improve textures and tastes in the ice cream and confectionery sector.
Report Coverage
The research report offers an in-depth analysis based on Fruit Type, Form, Application and Geography. It details leading market players, providing an overview of their business, product offerings, investments, revenue streams, and key applications. Additionally, the report includes insights into the competitive environment, SWOT analysis, current market trends, as well as the primary drivers and constraints. Furthermore, it discusses various factors that have driven market expansion in recent years. The report also explores market dynamics, regulatory scenarios, and technological advancements that are shaping the industry. It assesses the impact of external factors and global economic changes on market growth. Lastly, it provides strategic recommendations for new entrants and established companies to navigate the complexities of the market.
Future Outlook
- The market is expected to grow steadily due to rising consumer preference for natural and healthy fruit-based products.
- Demand for premium and exotic fruit blends will increase, driven by changing taste preferences.
- Expansion of bakery, dairy, and beverage applications will support higher consumption of mixed fruit jams.
- E-commerce and online retail channels will play a larger role in product distribution.
- Manufacturers will focus on clean-label, preservative-free, and reduced-sugar offerings to meet health trends.
- Technological advancements in fruit processing and packaging will enhance shelf life and product quality.
- Emerging markets will witness increased adoption due to rising disposable income and urbanization.
- Innovation in flavors and packaging will attract younger, convenience-oriented consumers.
- Sustainability and ethical sourcing will become key factors in market positioning.
- Collaboration with foodservice and retail chains will expand market reach and brand visibility.


