Omega 3 Market Overview:
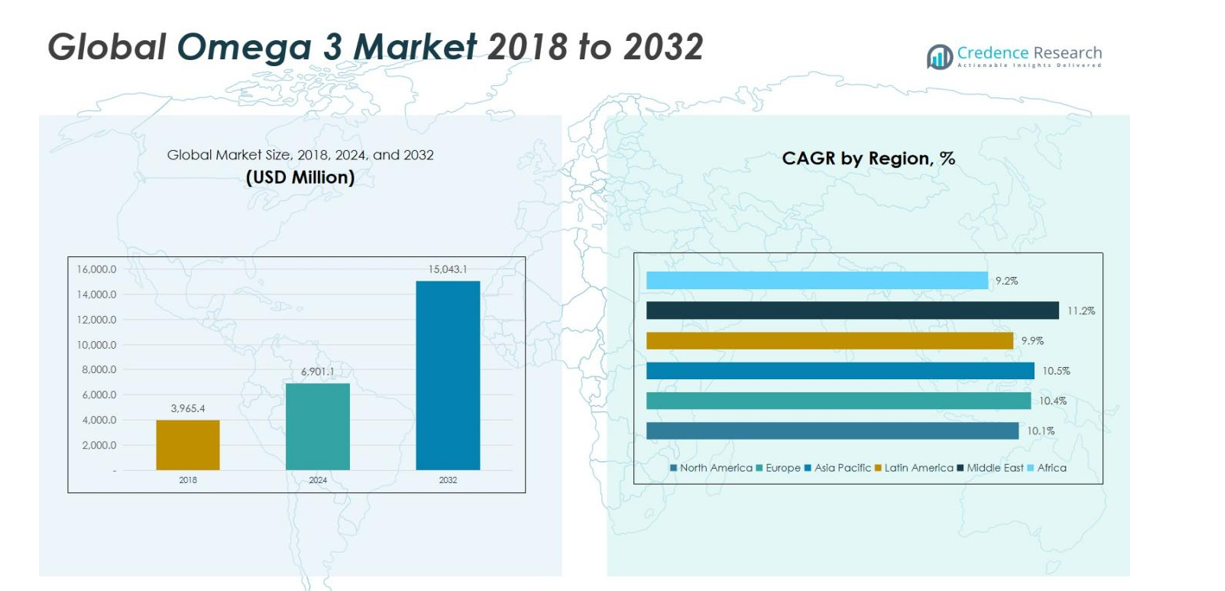
Omega 3 Market size was valued at USD 3,965.4 Million in 2018 and reached USD 6,901.1 Million in 2024. It is anticipated to grow to USD 15,043.1 Million by 2032, at a CAGR of 10.31% during the forecast period.
| REPORT ATTRIBUTE |
DETAILS |
| Historical Period |
2020-2023 |
| Base Year |
2024 |
| Forecast Period |
2025-2032 |
| Omega 3 Market Size 2024 |
USD 6,901.1 Million |
| Omega 3 Market, CAGR |
10.31% |
| Omega 3 Market Size 2032 |
USD 15,043.1 Million |
The Omega 3 Market is highly competitive, led by prominent companies such as BASF SE, Cargill, Inc., Croda International Plc., FMC Corporation, GC Reiber Oils, LUHUA BIOMARINE (Shandong) Co., Ltd, ADM, Kerry Group Plc, Omega Protein Corporation, Pharma Marine AS, and Royal DSM. These players dominate through diversified product portfolios, strategic partnerships, and extensive distribution networks, focusing on DHA, EPA, and ALA formulations for dietary supplements, infant nutrition, and pharmaceutical applications. North America and Europe remain key markets, with North America holding 26% and Europe 22% of the global share in 2018, driven by high health awareness, preventive healthcare adoption, and established supplement consumption. Asia Pacific leads in growth potential, representing 34% of the market, fueled by rising disposable income, urbanization, and increased demand for fortified foods and plant-based omega-3 products. Strategic innovation, regional expansion, and sustainability initiatives are central to maintaining leadership positions.
Omega 3 Market Insights
- The Omega 3 Market was valued at USD 6,901.1 Million in 2024 and is projected to reach USD 15,043.1 Million by 2032, growing at a CAGR of 10.31%.
- Rising health awareness and preventive healthcare trends are driving demand, with DHA leading the type segment at 35%, and dietary supplements dominating applications at 40%.
- Market trends include growing adoption of plant-based and sustainable omega-3 sources, increased fortification in functional foods, and rising use in pet foods and aquaculture nutrition.
- Competitive landscape features key players such as BASF SE, Cargill, Croda International, FMC Corporation, and Royal DSM, leveraging strategic partnerships, product innovation, and regional expansion to strengthen market presence.
- Regionally, Asia Pacific holds the largest share at 34%, followed by North America at 26% and Europe at 22%, with emerging markets in Latin America and the Middle East showing rapid growth, while Africa represents a smaller but growing opportunity.
Access crucial information at unmatched prices!
Request your sample report today & start making informed decisions powered by Credence Research Inc.!
Download Sample
Omega 3 Market Segmentation Analysis:
By Type
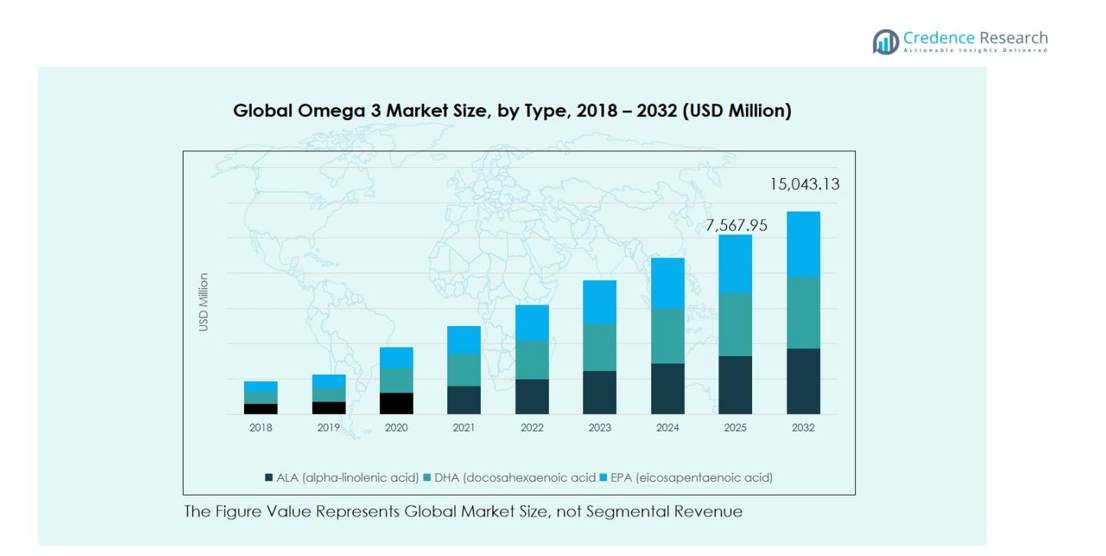
The Omega 3 market by type is dominated by DHA (Docosahexaenoic Acid), capturing 35% of the type segment. DHA is widely used in infant formula and cognitive health supplements, driven by rising awareness of its benefits for brain development, vision, and neuroprotection. ALA and EPA also contribute significantly, with flaxseed-based ALA products favored by plant-based consumers and EPA-rich dietary supplements targeting cardiovascular health. The growing adoption of preventive healthcare and functional nutrition across North America and Europe continues to fuel type segment growth.
- For instance, Enfamil’s #RaiseTheDHA campaign highlighted that their infant formulas contain the expert-recommended DHA level of 0.32% of total fatty acids, which aligns with WHO guidelines for optimal brain and eye development in infants.
By Application
Dietary supplements dominate the application market with a 40% share, fueled by increasing health consciousness, preventive healthcare trends, and convenience of capsules and fortified foods. The infant formula segment, primarily enriched with DHA, holds a significant portion due to rising birth rates and parental focus on cognitive development. Pharmaceutical applications are driven by prescription EPA products for cardiovascular and inflammatory conditions. Overall, the segment benefits from growing consumer spending on health and wellness across North America, Europe, and Asia Pacific.
- For instance, Amarin Corporation’s VASCEPA (icosapent ethyl), an EPA-rich prescription drug marketed for cardiovascular risk, saw regulatory approval in China in 2024, enabling wider clinical use for patients with elevated triglycerides and high-risk factors, reflecting growing pharmaceutical applications.
By Sources
The market by sources is led by marine-derived omega-3, capturing around 45% of the sources segment, primarily through fish oil and algae extracts. This sub-segment is preferred for its high EPA and DHA content, supporting cardiovascular and cognitive health. Nuts and seeds, especially flaxseed oil, hold a notable share for ALA intake, while vegetable oils and soya products cater to plant-based and fortified food demand. Adoption is strongest in North America and Europe, with Asia Pacific showing rapid growth due to aquaculture expansion and functional food fortification.
Key Growth Drivers
Rising Health Awareness and Preventive Healthcare
Increasing consumer awareness of cardiovascular, cognitive, and joint health is a major driver for the Omega 3 market. Individuals are actively seeking preventive nutrition through dietary supplements, fortified foods, and functional beverages. Governments and health organizations are promoting heart-healthy diets, further boosting demand for EPA, DHA, and ALA-rich products. This shift toward preventive healthcare, coupled with growing disposable income, particularly in North America and Europe, encourages higher adoption of omega-3 products across all age groups, driving consistent market growth.
Growing Demand in Infant Nutrition and Functional Foods
The Omega 3 market benefits from strong demand in infant formula and functional food segments. DHA-enriched infant formulas are increasingly preferred by parents for cognitive and visual development, while functional foods and beverages fortified with omega-3 attract health-conscious adults. The expanding middle-class population in Asia Pacific and rising awareness of nutrition-led wellness in developed regions are key growth drivers. Manufacturers are innovating with plant-based and clean-label options, making omega-3 accessible across different dietary preferences and expanding the market’s reach globally.
- For instance, Naturmega showcased at Vitafoods Asia 2025 its portfolio featuring both marine and plant-based omega-3 options, such as EssentiOmega® Algae DHA, targeting consumers with plant-based and clean-label preferences, thereby widening global market reach.
Expansion of Pharmaceutical and Clinical Applications
The market is propelled by increasing prescription-based omega-3 products targeting hypertriglyceridemia, cardiovascular disorders, and inflammatory conditions. Regulatory approvals for EPA and DHA therapies have encouraged healthcare providers to recommend omega-3 as part of treatment plans. North America and Europe lead adoption due to established healthcare infrastructure and high patient awareness. Rising chronic disease prevalence and growing investment in clinical research further support this segment. Integration of omega-3 into pharmaceutical formulations enhances therapeutic efficacy and drives overall market expansion.
- For instance, Amarin Pharma’s Vascepa, containing purified EPA, demonstrated in the REDUCE-IT trial with over 8,000 patients that it significantly lowered triglyceride levels and reduced cardiovascular events such as heart attacks and strokes.
Key Trends and Opportunities
Trend Toward Plant-Based and Sustainable Sources
Consumers are increasingly adopting plant-based diets and sustainable nutrition options, creating opportunities for ALA-rich flaxseed, chia, and algae-derived omega-3 products. Clean-label and eco-friendly sourcing resonate with environmentally conscious buyers, while innovative fortification in snacks, beverages, and bakery products expands application. Companies focusing on sustainable marine and plant sources gain a competitive advantage. This trend encourages product diversification, supports brand differentiation, and drives long-term market adoption in both developed and emerging regions.
- For instance, Organic India offers flaxseed oil capsules containing 500 mg of omega-3 ALA per softgel, supporting cardiovascular health through a natural plant-based source.
Rising Adoption in Pet and Aquaculture Nutrition
Omega-3 is increasingly incorporated into pet foods and fish feed to support joint health, cognitive development, and growth. The growing premiumization of pet nutrition, coupled with awareness of omega-3 benefits for animals, fuels segment growth. In aquaculture, marine-derived omega-3 enriches farmed fish, meeting consumer demand for nutrient-rich seafood. Emerging markets in Asia Pacific and Latin America are witnessing rapid adoption due to expanding pet ownership and aquaculture operations. These developments present opportunities for product innovation and targeted marketing strategies.
- For instance, DSM-Firmenich’s Veramaris Pets delivers omega-3 with 60% EPA and DHA content, more than double typical fish oils, to enhance pet coat and brain health sustainably.
Key Challenges
Regulatory and Quality Compliance Challenges
Stringent regulations regarding purity, dosage, and labeling pose challenges for omega-3 manufacturers. Ensuring consistent EPA and DHA levels in supplements, infant formula, and fortified foods requires advanced quality control and certification. Variations in global regulatory standards, particularly between North America, Europe, and Asia Pacific, complicate market entry and compliance. Companies must invest in testing, traceability, and documentation to meet consumer and governmental expectations. Non-compliance risks product recalls, litigation, and reputational damage, which may impede market growth despite rising demand.
Price Volatility and Supply Chain Constraints
Fluctuations in raw material costs, particularly fish oil, algae, and plant-based sources, create price volatility in the omega-3 market. Seasonal variations, overfishing concerns, and limited availability of high-quality oils impact production and profitability. Additionally, complex global supply chains and transportation challenges may delay product delivery. Smaller manufacturers and emerging players are particularly vulnerable to these disruptions. Companies must adopt sustainable sourcing, diversify suppliers, and optimize logistics to mitigate risks and ensure stable supply while maintaining competitive pricing for end consumers.
Regional Analysis
North America
North America accounted for 26% of the global Omega 3 market in 2018, valued at USD 1,022.27 million. The region’s market reached USD 1,756.04 million in 2024 and is projected to grow to USD 3,760.78 million by 2032, exhibiting a CAGR of 10.1%. Growth is driven by rising health awareness, high adoption of dietary supplements, and strong pharmaceutical applications. The U.S. dominates regional demand due to established consumer preferences for heart and cognitive health products, while Canada contributes significantly through infant formula and functional food consumption. Continuous innovation and preventive healthcare trends further support market expansion.
Europe
Europe held a market share of 22% in 2018, valued at USD 876.74 million. The market expanded to USD 1,532.64 million in 2024 and is expected to reach USD 3,360.63 million by 2032 at a CAGR of 10.4%. The region benefits from high consumer awareness of cardiovascular and cognitive health, coupled with strong regulatory support for nutritional supplements. Germany, the UK, and France lead adoption in dietary supplements and infant nutrition. Innovation in plant-based and marine-derived omega-3 products, along with rising preventive healthcare expenditure, drives sustained growth across Europe.
Asia Pacific
Asia Pacific accounted for 34% of the global market in 2018, valued at USD 1,357.34 million. The market grew to USD 2,385.03 million in 2024 and is projected to reach USD 5,265.09 million by 2032, at a CAGR of 10.5%. Rapid urbanization, rising disposable income, and increasing awareness of preventive nutrition are key drivers. India, China, and Japan lead consumption in dietary supplements, infant formula, and functional foods. Expanding middle-class populations and growing adoption of plant-based omega-3 products in food and beverages further enhance market growth opportunities.
Latin America
Latin America held a market share of 8% in 2018, valued at USD 436.98 million, growing to USD 745.12 million in 2024 and expected to reach USD 1,579.53 million by 2032, with a CAGR of 9.9%. Brazil and Argentina dominate regional demand, supported by rising awareness of heart and cognitive health, along with increasing use of dietary supplements and fortified foods. The growing middle class and urban population, coupled with expanding retail and e-commerce channels, contribute to market expansion. Nutritional interventions in functional foods and infant formula continue to drive adoption.
Middle East
The Middle East represented 5% of the global market in 2018, valued at USD 189.54 million. The market is projected to grow to USD 346.44 million in 2024 and USD 803.30 million by 2032, at a CAGR of 11.2%. Growth is driven by rising consumer interest in preventive healthcare, increasing disposable income, and awareness of omega-3 benefits for cardiovascular and cognitive health. GCC countries lead demand, supported by dietary supplements and functional foods. Pharmaceutical applications and fortified infant nutrition are also emerging as significant contributors to market expansion.
Africa
Africa accounted for 2% of the global market in 2018, valued at USD 82.48 million. The market reached USD 135.85 million in 2024 and is projected to grow to USD 273.78 million by 2032, at a CAGR of 9.2%. Growth is supported by rising health awareness, increasing urbanization, and adoption of dietary supplements in South Africa and Egypt. Infant nutrition and fortified foods are emerging segments, while limited market penetration and affordability constraints remain challenges. Expanding retail and e-commerce infrastructure are expected to drive future growth across the continent.
Omega 3 Market Segmentations:
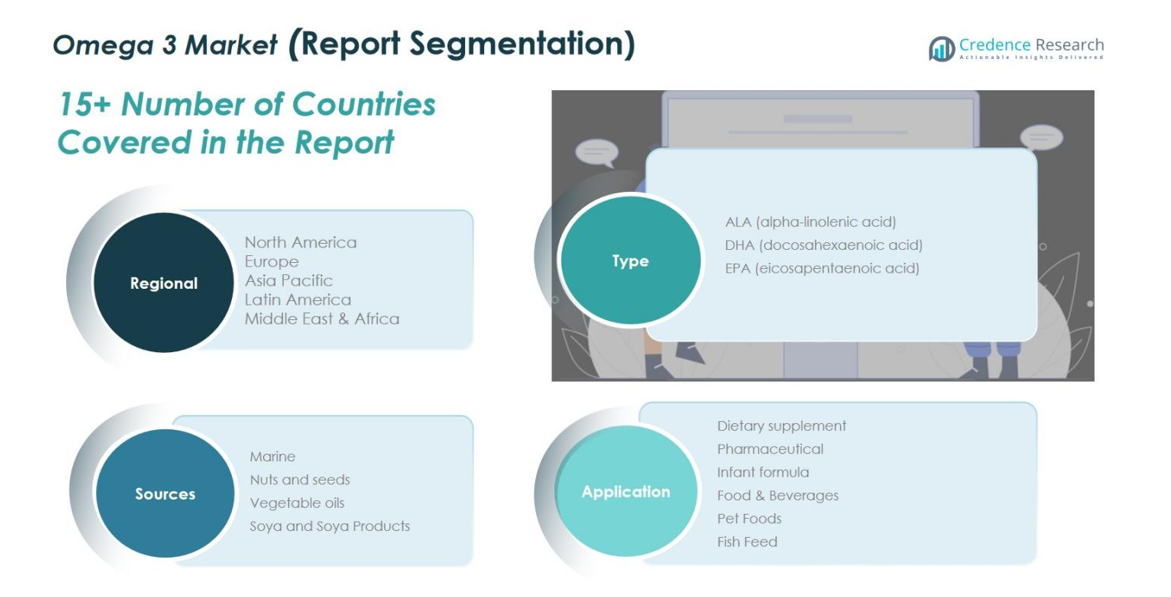
By Type:
- ALA (alpha-linolenic acid)
- DHA (docosahexaenoic acid)
- EPA (eicosapentaenoic acid)
By Application:
- Dietary supplements
- Pharmaceutical
- Infant formula
- Food & Beverages
- Pet Foods
- Fish Feed
By Sources:
- Marine
- Nuts and seeds
- Vegetable oils
- Soya and Soya Products
By Region:
- North America
- Europe
- Germany
- France
- U.K.
- Italy
- Spain
- Rest of Europe
- Asia Pacific
- China
- Japan
- India
- South Korea
- South-east Asia
- Rest of Asia Pacific
- Latin America
- Brazil
- Argentina
- Rest of Latin America
- Middle East & Africa
- GCC Countries
- South Africa
- Rest of the Middle East and Africa
Competitive Landscape
Competitive landscape in the Omega 3 market features key players such as BASF SE, Cargill, Inc., Croda International Plc., FMC Corporation, GC Reiber Oils, LUHUA BIOMARINE (Shandong) Co., Ltd, ADM, Kerry Group Plc, Omega Protein Corporation, Pharma Marine AS, and Royal DSM. These companies dominate through extensive product portfolios, strategic partnerships, and global distribution networks. Market competition is intensified by continuous innovation in formulations, including plant-based ALA products, marine-derived DHA/EPA supplements, and fortified functional foods. Firms are investing in research and development to improve bioavailability, purity, and sustainability of omega-3 sources. Regional expansion strategies, particularly in Asia Pacific and Latin America, enable companies to capture emerging consumer bases. Pricing strategies, brand reputation, and product differentiation remain key factors, while mergers, acquisitions, and collaborations are frequently employed to enhance market presence and strengthen competitive advantage globally.
Shape Your Report to Specific Countries or Regions & Enjoy 30% Off!
Key Player Analysis
- BASF SE
- Cargill, Inc.
- Croda International Plc.
- FMC Corporation
- GC Reiber Oils
- LUHUA BIOMARINE (Shandong) Co., Ltd
- ADM
- Kerry Group Plc
- Omega Protein Corporation
- Pharma Marine AS
- Royal DSM
- Others
Recent Developments
- In September 30, 2025, BASF and Louis Dreyfus Company (LDC) completed the sale of BASF’s Food and Health Performance Ingredients Business, including omega-3 oils for human nutrition, to LDC.
- In October 1, 2024, Royal DSM completed the sale of its MEG-3® fish oil business to KD Pharma Group SA, streamlining its omega-3 portfolio.
- In 2024, DSM Nutritional Products launched a high-purity EPA/DHA omega-3 concentrate tailored for functional foods and nutraceuticals.
Report Coverage
The research report offers an in-depth analysis based on Type, Application, Sources and Region. It details leading market players, providing an overview of their business, product offerings, investments, revenue streams, and key applications. Additionally, the report includes insights into the competitive environment, SWOT analysis, current market trends, as well as the primary drivers and constraints. Furthermore, it discusses various factors that have driven market expansion in recent years. The report also explores market dynamics, regulatory scenarios, and technological advancements that are shaping the industry. It assesses the impact of external factors and global economic changes on market growth. Lastly, it provides strategic recommendations for new entrants and established companies to navigate the complexities of the market.
Future Outlook
- The market is expected to grow steadily, driven by rising health awareness and preventive healthcare trends.
- Increasing adoption of dietary supplements and functional foods will continue to fuel demand.
- Infant nutrition and DHA-enriched formulas will remain a key growth area globally.
- Plant-based and sustainable omega-3 sources are likely to gain higher acceptance among consumers.
- Expansion in emerging regions such as Asia Pacific and Latin America will offer significant growth opportunities.
- Pharmaceutical applications for cardiovascular and inflammatory conditions will further support market development.
- Pet food and aquaculture nutrition segments will see increased incorporation of omega-3 products.
- Continuous innovation in bioavailability, purity, and fortified products will drive competitive differentiation.
- Strategic partnerships, mergers, and acquisitions among key players will enhance market presence.
- Rising e-commerce and retail penetration will improve product accessibility and boost overall market growth.


