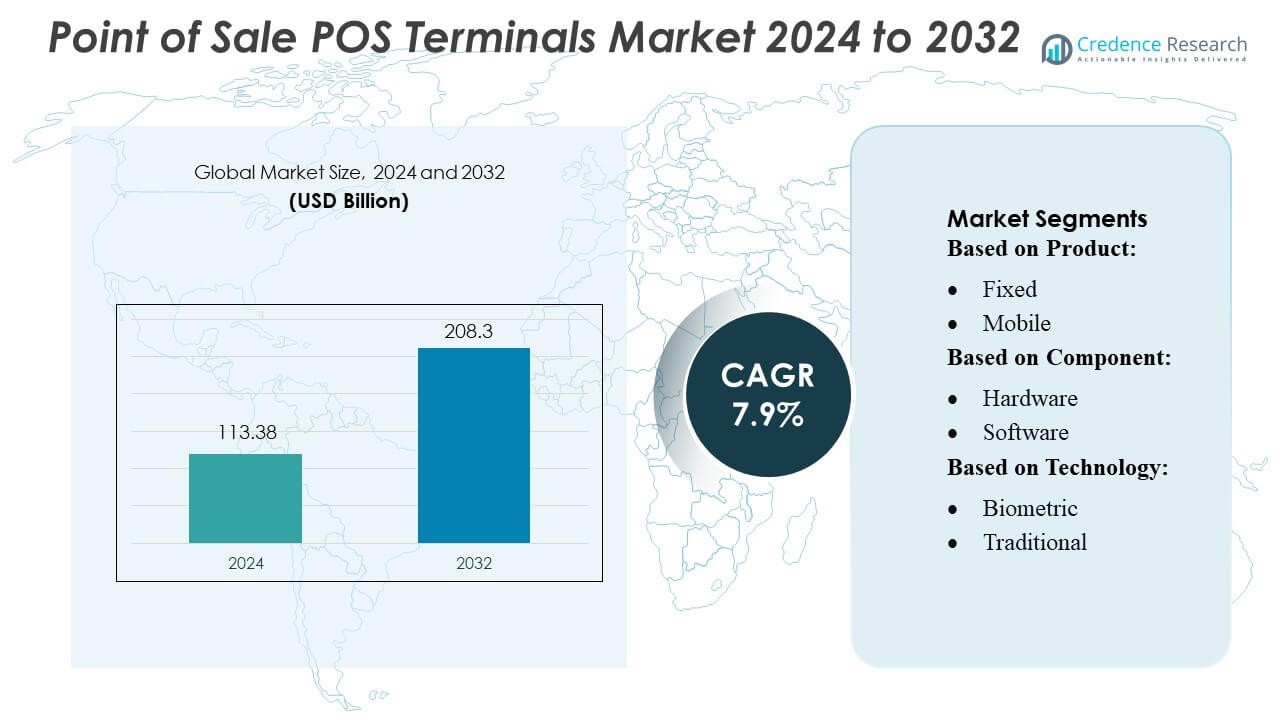
Home » Semiconductor & Electronics » Point Of Sale (POS) Terminals Market

Global Point Of Sale (POS) Terminals Market By Product (Fixed and Mobile) By Component (Hardware, Software and Services) By Deployment (Cloud and On-premise)-Growth, Future Prospects & Competitive Analysis, 2016 – 2030

Price: $4999

Published: | Report ID: 9673 | Report Format : PDF

Key Highlights of the Report

How are the major segments performing in the Point Of Sale (POS) Terminals market?

  • Due to large-scale suppliers choosing fixed POS terminals because of the high purchase and installation costs, which now support the segment’s growth, the fixed product segment led the industry in 2022. It accounted for the greatest share of more than 61.75% of worldwide revenue.
  • In 2022, the hardware market controlled the world, accounting for more than 63.30% of the total revenue. Most of the system’s hardware components are found in the stationary POS terminal, making using the system to manage daily activity easier.
  • From 2023 to 2030, the cloud segment is anticipated to develop at the quickest rate. The rising use of SaaS technologies and software integration is blamed for this expansion.

How does the Market Size of POS Terminals regard to value?

The global POS terminals market is anticipated to grow at a substantial CAGR of 16.3% in the upcoming years. The global POS terminals industry was estimated to be worth USD 23.5 billion in 2022 and was expected to be worth USD 67.6 million by 2028.

Design Element 2

Access crucial information at unmatched prices!

Request your free sample report today & start making informed decisions powered by Credence Research!

Download Free Sample
CTA Design Element 3

Which region dominated the POS terminals market?

Over the forecast period, Asia Pacific is expected to have the quickest CAGR. The demand for POS terminals in the area is rising due to government measures to foster a cashless economy. The growing adoption of digital payment technology in the area has created prosperous chances for mPOS in nations like China, Japan, and India. However, the demand for fixed POS terminals from major businesses to safeguard their corporate information and guarantee the processing of massive volumes of consumer data promotes market growth.

REPORT ATTRIBUTE DETAILS
Point Of Sale (POS) Terminals Market by Volume Yes
Point Of Sale (POS) Terminals Market by Value Yes
Point Of Sale (POS) Terminals Market, Tornado Analysis Yes
Point Of Sale (POS) Terminals Market, STAR Analysis Yes
Point Of Sale (POS) Terminals Market, SRC Analysis Yes
Point Of Sale (POS) Terminals Market, Import-Export Data Yes (On Demand)
Point Of Sale (POS) Terminals Market Pricing Analysis Yes (On Demand)
Point Of Sale (POS) Terminals Market Segment Analysis By Product (Fixed and Mobile)

By Component (Hardware, Software and Services)

By Deployment (Cloud and On-premise)

Point Of Sale (POS) Terminals Market, Regional Analysis Europe (Germany, Spain, UK, France, Italy, and Rest of Europe)

North America (US and Canada)

Latin America (Mexico, Brazil, and Rest of Latin America)

Asia Pacific (South Korea, South East Asia, China, India, Japan, and Rest of Asia Pacific)

Middle East and Africa (South Africa, GCC Countries, and Rest of Middle East and Africa)

Point Of Sale (POS) Terminals Market Key Companies Acrelec; AURES Group; HM Electronics; Hewlett Packard Development LP; NCR Corp.; Oracle; Presto Group; Qu, Inc.; Quail Digital; Revel Systems; Toast, Inc.; Toshiba Corp.; TouchBistro; and Xenial, Inc.
Point Of Sale (POS) Terminals Market Competitive Landscape Market Share Analysis

Competitive Benchmarking

Key Players Market Positioning

Geographical Presence Analysis

Major Strategies Adopted

How is US Market Performing in the POS terminals market?

Several high-demand payment technologies, including contactless payments and NFC, have driven the need for POS terminals in the US. Additionally, the United States is home to many well-known retail chains, like Walmart, Costco Wholesale Corp., Target, The Kroger Co., and The Home Depot, which depend on POS terminals to handle everyday operations like billing, payment, employee duty, and inventory.

How is the economy impacting the global POS terminals market growth?

The spike in inflation rates that many nations have seen has considerably impacted consumers’ purchasing power. People prioritize their necessities during a recession, which may affect what they buy. Additionally, market liquidity may drop. The Russia-Ukraine War caused considerable losses for businesses that purchased items from Russia and Ukraine. All these factors have the potential to limit market expansion. The market entry of covid-19 significantly impacted the capital expenditures of significant enterprises.

What is the competitive environment of the POS terminals market?

Several prominent competitors contribute to the high market fragmentation in the point-of-sale terminal sector. Additionally, these firms spend much on research and development to bring new payment technologies to the market. The market will be driven by strict government laws and policies, increasing its appeal and competition level. The official point-of-sale (POS) for the culinary and music festival GastroBeats 2022 was made available by Qashier in June 2022. With this move, the Singaporean FinTech startup enters the market for event payment solutions. To enable contactless ordering and payments during the event, Qashier teamed up with GastroBeats, guaranteeing a secure and convenient experience for everyone.

Point Of Sale (POS) Terminals Market

Executive Summary

What are the key trends in the POS Terminals market?

  • Due to the perception that physical characteristics provide dependability, credit and debit cards are exclusively processed through payment terminals in several countries. This custom has allowed terminals to replace counters in most retail establishments. The demand is further backed by the fact that in contrast to POS systems where payment cards are processed, where security measures are dependent on end-users and developers, credit and debit card data is somewhat less susceptible to hackers.
  • The need for mPOS solutions has increased as supermarket operators expand internationally. Visa transaction statistics confirmed the finding, demonstrating that some nations maintain a significant advantage in average transaction size compared to developed and rising e-commerce markets.

What is the market understanding of the POS Terminals Market?

The time and place when a transaction is completed are determined by the POS terminal system. A point-of-sale system combines computer hardware and software to control marketing while a good or service is sold. Data about sales transactions should be stored, captured, shared, and reported. It facilitates shopping and speeds up the payment procedure, which makes customers happier. Primary data from the systems include inventory management, stock on hand, product availability, and pricing details.

Which are the key investments by the POS Terminals market players?

To survive in the cutthroat market environment, major corporations are pursuing a variety of inorganic growth tactics, such as joint ventures, mergers and acquisitions, and regional expansion. For instance, Elo Touch Solutions, Inc. and CERTIFY Health collaborated to deliver a patient self-service solution in September 2021. This collaboration combined Elo’s All-in-One touchscreen PCs with a CERTIFY Care cloud-based user interface, optimizing patient registration operations for healthcare providers and institutions. Players in the business are focusing on R&D to create items with the newest technologies and expand the size and scope of their companies. Presto unveiled Presto Flex, its next-generation platform, in September 2021. This system is a multifunctional tablet computer created for the hospitality sector. It can be set up for various dine-in and drive-through restaurant applications, such as pay-at-table, staff handheld, drive-through, and kiosk line buster.

Some major players in the POS terminals market are Acrelec; AURES Group; HM Electronics; Hewlett Packard Development LP; NCR Corp.; Oracle; Presto Group; Qu, Inc.; Quail Digital; Revel Systems; Toast, Inc.; Toshiba Corp.; TouchBistro; and Xenial, Inc

What are the Major Driving Factors for the POS Terminals Market?

Demand for appropriate wireless communication technology has increased due to rising consumer demand. POS systems use wireless devices to enable payments for goods and services. Wireless technology is used to streamline many activities, from restaurants to cab services. POS terminals are used by retail and hotel companies for remittance and other operational duties like accounting, sales tracking, and inventory management. For instance, restaurants, bars, and food service providers rely on POS systems to track sales, operations, operations, products, and inventories. The market concept includes tools and displays for online transactions using cash registers, barcode scanners, and computers. Additionally, the growing usage of mobile POS terminals, advancements in payment technology, acceptance of Europay, Mastercard, and Visa (EMV) cards, and market expansion in the retail and e-commerce sectors contribute to the industry’s expansion.

What are the Major Risks for the POS Terminals Market?

The potential for identity threats is a significant effect of POS breaches. These victims experience financial loss damage, a decline in credit scores, and fraudulent transactions. Consequently, compensatory measures to manage the data flow are expected to enhance POS security. For instance, VeriFone’s VeriShield is a temporary power source for data transmission between various POS system components. The COVID-19 pandemic affected the industry’s growth because of social lockdown and travel limitations. Many end-use verticals experienced losses as a result, which reduced the demand for new fixed POS terminals.

Which is the key product in the POS terminals market?

In 2022, the fixed product segment dominated the market and accounted for the highest revenue share of more than 61.75%. Kiosks and other devices are included in the fixed POS sector. Due to expensive procurement and installation expenses, which at the time supported the segment’s growth, large-scale vendors opted for fixed POS terminals. Installing fixed POS terminals for data storage with the on-premises server is another practice among end users aware of cloud data storage. Applications for these systems include bill printing, customer relationship management (CRM), inventory management, and device support for payments.

From 2023 to 2030, the mobile POS market is anticipated to grow at the quickest rate. This expansion is linked to customers’ increasing global acceptance of in-store mobile payments. Mobile POS devices make it possible to accept payments around the store. Many end users, including restaurants, have started using mPOS because it makes payments easier during peak times and prevents lost sales from delays, which boosts customer satisfaction. For instance, Quick-Service Restaurants (QSRs) in China now display menus and take orders using devices like tablets and digital kiosks. This aids eateries in improving operational effectiveness and client experience, which will likely drive the business.

How are the POS terminals market performing in regions?

APAC is expected to experience the fastest CAGR during the predicted period. As a result of government initiatives to promote a cashless economy, there is a growing demand for POS terminals in the area. Growing mPOS opportunities have been developed in countries like China, Japan, and India thanks to the area’s growing usage of digital payment technologies. However, large companies need fixed POS terminals to protect their corporate information and ensure the processing of enormous volumes of customer data fosters market expansion. China, one of the major producers of POS terminal hardware parts, recovered more quickly than other nations, and Japan implemented control measures to lessen the impact on its companies. Other Asian nations are taking steps to resurrect their economies, which is anticipated to boost product demand in the future. Additionally, the market is projected to have profitable development because of a sizable unbanked population and low penetration in other developing nations, such as Vietnam and Thailand.

North America is anticipated to expand at a consistent GAGR during the forecast period, accounting for the second-largest revenue share in 2022. In the US, the demand for POS terminals has been fueled by several highly desired payment methods, such as contactless transactions and NFC. Many well-known retail chains are also based in the United States, including Walmart, Costco Wholesale Corp., Target, Kroger Co., and The Home Depot. These companies rely on POS terminals to manage routine tasks, including billing, payment, personnel duty, and inventory. In order to stop the disease from spreading after COVID-19, the US government is also promoting the use of contactless payment methods. However, the pandemic-related slowdown in the retail and other service sectors hindered the area market’s overall development.

Shape Your Report to Specific Countries or Regions & Enjoy 30% Off!

What are the major players planning for the future of the POS terminals market?

An improved customer experience is the outcome of advantages provided by contemporary drive-thrus, such as increased convenience. The market is hence anticipated to benefit from these lucrative growth possibilities. As a result, the main players are concentrating on offering POS terminal services for drive-throughs.

Segmentation of Global POS Terminals Market-

Global POS Terminals Market – By Product

  • Fixed
  • Mobile

Global POS Terminals Market – By Component

  • Hardware
  • Software
  • Services

Global POS Terminals Market – By Deployment

  • Cloud
  • On-premise

Global POS Terminals Market – By Region

  • North America
    • US
    • Canada
  • Europe
    • Germany
    • France
    • K.
    • Italy
    • Spain
    • Rest of Europe
  • Asia Pacific
    • China
    • Japan
    • India
    • South Korea
    • South-east Asia
    • Rest of Asia Pacific
  • Latin America
    • Brazil
    • Mexico
    • Rest of Latin America
  • Middle East & Africa
    • GCC Countries
    • South Africa
    • Rest of Middle East and Africa

1. Preface
1.1. Report Description
1.1.1. Purpose of the Report
1.1.2. Target Audience
1.1.3. USP and Key Offerings
1.2. Research Scope
1.3. Research Methodology
1.3.1. Phase I – Secondary Research
1.3.2. Phase II – Primary Research
1.3.3. Phase III – Expert Panel Review
1.3.4. Approach Adopted
1.3.4.1. Top-Down Approach
1.3.4.2. Bottom-Up Approach
1.3.5. Assumptions
1.4. Market Introduction
1.5. Market Research Scope

2. Executive Summary
2.1. Market Snapshot: Point Of Sale (POS) Terminals Market
2.2. Point Of Sale (POS) Terminals Market, By Product Outlook
2.3. Point Of Sale (POS) Terminals Market, By Component Outlook
2.4. Point Of Sale (POS) Terminals Market, By Deployment Outlook
2.5. Point Of Sale (POS) Terminals Market, By Region

3. Market Dynamics & Factors Analysis
3.1. Introduction
3.1.1. Point Of Sale (POS) Terminals Market Value, 2017-2030, (US$ Bn)
3.1.2. Y-o-Y Growth Trend Analysis
3.2. Market Dynamics
3.2.1. Market Drivers
3.2.2. Market Restraints
3.2.3. Market Opportunities
3.2.4. Major Industry Challenges
3.3. Growth and Development Patterns
3.4. Investment Feasibility Analysis
3.5. Market Opportunity Analysis
3.5.1. Product Outlook
3.5.2. Component Outlook
3.5.3. Deployment Outlook
3.5.4. Geography

4. Premium Insights
4.1. STAR (Situation, Task, Action, Results) Analysis
4.2. Porter’s Five Forces Analysis
4.2.1. Threat of New Entrants
4.2.2. Bargaining Power of Buyers/Consumers
4.2.3. Bargaining Power of Suppliers
4.2.4. Threat of Substitute Types
4.2.5. Intensity of Competitive Rivalry
4.3. Key Market Trends
4.3.1. Demand Side Trends
4.3.2. Supply Side Trends
4.4. Value Chain Analysis
4.5. Technology Analysis
4.6. Analysis and Recommendations
4.7. Marketing Strategy Analysis
4.7.1. Direct Marketing
4.7.2. Indirect Marketing
4.7.3. Marketing Channel Development Trend

5. Market Positioning of Key Players, 2022
5.1. Company market share of key players, 2022
5.2. Competitive Benchmarking
5.3. Market Positioning of Key Vendors
5.4. Geographical Presence Analysis
5.5. Major Strategies Adopted by Key Players
5.5.1. Key Strategies Analysis
5.5.2. Mergers and Acquisitions
5.5.3. Partnerships
5.5.4. Product Launch
5.5.5. Geographical Expansion
5.5.6. Others

6. Economic Impact Analysis
6.1. Recession Impact
6.1.1. North America
6.1.2. Europe
6.1.3. Asia Pacific
6.1.4. Latin America
6.1.5. Middle East and Africa
6.2. Ukraine-Russia War Impact
6.2.1. North America
6.2.2. Europe
6.2.3. Asia Pacific
6.2.4. Latin America
6.2.5. Middle East and Africa
6.3. COVID-19 Impact Analysis
6.3.1. North America
6.3.2. Europe
6.3.3. Asia Pacific
6.3.4. Latin America
6.3.5. Middle East and Africa

7. Point Of Sale (POS) Terminals Market
7.1. Point Of Sale (POS) Terminals Market, By Product Outlook, 2017-2030(US$ Bn)
7.1.1. Overview
7.1.2. Point Of Sale (POS) Terminals Market, By Product Outlook, 2022 vs 2030 (in%)
7.1.3. Point Of Sale (POS) Terminals Market, By Fixed, 2017-2030 (US$ Bn)
7.1.4. Point Of Sale (POS) Terminals Market, By Mobile, 2017-2030 (US$ Bn)
7.2. Point Of Sale (POS) Terminals Market, by Component Outlook, 2017-2030(US$ Bn)
7.2.1. Overview
7.2.2. Point Of Sale (POS) Terminals Market, By Component Outlook, 2022 vs 2030 (in%)
7.2.3. Point Of Sale (POS) Terminals Market, By Hardware, 2017-2030 (US$ Bn)
7.2.4. Point Of Sale (POS) Terminals Market, By Software, 2017-2030 (US$ Bn)
7.2.5. Point Of Sale (POS) Terminals Market, By Services, 2017-2030 (US$ Bn)
7.3. Point Of Sale (POS) Terminals Market, By Deployment Outlook, 2017-2030(US$ Bn)
7.3.1. Overview
7.3.2. Point Of Sale (POS) Terminals Market, By Deployment Outlook, 2022 vs 2030 (in%)
7.3.3. Point Of Sale (POS) Terminals Market, By Cloud, 2017-2030 (US$ Bn)
7.3.4. Point Of Sale (POS) Terminals Market, By On-premise, 2017-2030 (US$ Bn)

8. North America Point Of Sale (POS) Terminals Market Analysis
8.1. North America Point Of Sale (POS) Terminals Market, By Product Outlook, 2017-2030(US$ Bn)
8.1.1. Overview
8.1.2. SRC Analysis
8.2. North America Point Of Sale (POS) Terminals Market, by Component Outlook, 2017-2030(US$ Bn)
8.2.1. Overview
8.2.2. SRC Analysis
8.3. North America Point Of Sale (POS) Terminals Market, By Deployment Outlook, 2017-2030(US$ Bn)
8.3.1. Overview
8.3.2. SRC Analysis
8.4. North America Point Of Sale (POS) Terminals Market, by Country, 2017-2030 (US$ Bn)
8.4.1. U.S.
8.4.1.1. U.S. Point Of Sale (POS) Terminals Market Estimates and Forecast, 2017-2030 (US$ Bn)
8.4.1.2. U.S. Point Of Sale (POS) Terminals, By Product Outlook, 2017-2030 (US$ Bn)
8.4.1.3. U.S. Point Of Sale (POS) Terminals, By Component Outlook, 2017-2030 (US$ Bn)
8.4.1.4. U.S. Point Of Sale (POS) Terminals, By Deployment Outlook, 2017-2030 (US$ Bn)
8.4.2. Canada
8.4.2.1. Canada Point Of Sale (POS) Terminals Market Estimates and Forecast, 2017-2030 (US$ Bn)
8.4.2.2. Canada Point Of Sale (POS) Terminals, By Product Outlook, 2017-2030 (US$ Bn)
8.4.2.3. Canada Point Of Sale (POS) Terminals, By Component Outlook, 2017-2030 (US$ Bn)
8.4.2.4. Canada Point Of Sale (POS) Terminals, By Deployment Outlook, 2017-2030 (US$ Bn)

9. Europe Point Of Sale (POS) Terminals Market Analysis
9.1. Europe Point Of Sale (POS) Terminals Market, By Product Outlook, 2017-2030(US$ Bn)
9.1.1. Overview
9.1.2. SRC Analysis
9.2. Europe Point Of Sale (POS) Terminals Market, by Component Outlook, 2017-2030(US$ Bn)
9.2.1. Overview
9.2.2. SRC Analysis
9.3. Europe Point Of Sale (POS) Terminals Market, By Deployment Outlook, 2017-2030(US$ Bn)
9.3.1. Overview
9.3.2. SRC Analysis
9.4. Europe Point Of Sale (POS) Terminals Market, by Country, 2017-2030 (US$ Bn)
9.4.1. Germany
9.4.1.1. Germany Point Of Sale (POS) Terminals Market Estimates and Forecast, 2017-2030 (US$ Bn)
9.4.1.2. Germany Point Of Sale (POS) Terminals, By Product Outlook, 2017-2030 (US$ Bn)
9.4.1.3. Germany Point Of Sale (POS) Terminals, By Component Outlook, 2017-2030 (US$ Bn)
9.4.1.4. Germany Point Of Sale (POS) Terminals, By Deployment Outlook, 2017-2030 (US$ Bn)
9.4.2. France
9.4.2.1. France Point Of Sale (POS) Terminals Market Estimates and Forecast, 2017-2030 (US$ Bn)
9.4.2.2. France Point Of Sale (POS) Terminals, By Product Outlook, 2017-2030 (US$ Bn)
9.4.2.3. France Point Of Sale (POS) Terminals, By Component Outlook, 2017-2030 (US$ Bn)
9.4.2.4. France Point Of Sale (POS) Terminals, By Deployment Outlook, 2017-2030 (US$ Bn)
9.4.3. UK
9.4.3.1. UK Point Of Sale (POS) Terminals Market Estimates and Forecast, 2017-2030 (US$ Bn)
9.4.3.2. UK Point Of Sale (POS) Terminals, By Product Outlook, 2017-2030 (US$ Bn)
9.4.3.3. UK Point Of Sale (POS) Terminals, By Component Outlook, 2017-2030 (US$ Bn)
9.4.3.4. UK Point Of Sale (POS) Terminals, By Deployment Outlook, 2017-2030 (US$ Bn)
9.4.4. Italy
9.4.4.1. Italy Point Of Sale (POS) Terminals Market Estimates and Forecast, 2017-2030 (US$ Bn)
9.4.4.2. Italy Point Of Sale (POS) Terminals, By Product Outlook, 2017-2030 (US$ Bn)
9.4.4.3. Italy Point Of Sale (POS) Terminals, By Component Outlook, 2017-2030 (US$ Bn)
9.4.4.4. Italy Point Of Sale (POS) Terminals, By Deployment Outlook, 2017-2030 (US$ Bn)
9.4.5. Spain
9.4.5.1. Spain Point Of Sale (POS) Terminals Market Estimates and Forecast, 2017-2030 (US$ Bn)
9.4.5.2. Spain Point Of Sale (POS) Terminals, By Product Outlook, 2017-2030 (US$ Bn)
9.4.5.3. Spain Point Of Sale (POS) Terminals, By Component Outlook, 2017-2030 (US$ Bn)
9.4.5.4. Spain Point Of Sale (POS) Terminals, By Deployment Outlook, 2017-2030 (US$ Bn)
9.4.6. Rest of Europe
9.4.6.1. Rest of Europe Point Of Sale (POS) Terminals Market Estimates and Forecast, 2017-2030 (US$ Bn)
9.4.6.2. Rest of Europe Point Of Sale (POS) Terminals, By Product Outlook, 2017-2030 (US$ Bn)
9.4.6.3. Rest of Europe Point Of Sale (POS) Terminals, By Component Outlook, 2017-2030 (US$ Bn)
9.4.6.4. Rest of Europe Point Of Sale (POS) Terminals, By Deployment Outlook, 2017-2030 (US$ Bn)

10. Asia Pacific Point Of Sale (POS) Terminals Market Analysis
10.1. Asia Pacific Point Of Sale (POS) Terminals Market, By Product Outlook, 2017-2030(US$ Bn)
10.1.1. Overview
10.1.2. SRC Analysis
10.2. Asia Pacific Point Of Sale (POS) Terminals Market, by Component Outlook, 2017-2030(US$ Bn)
10.2.1. Overview
10.2.2. SRC Analysis
10.3. Asia Pacific Point Of Sale (POS) Terminals Market, By Deployment Outlook, 2017-2030(US$ Bn)
10.3.1. Overview
10.3.2. SRC Analysis
10.4. Asia Pacific Point Of Sale (POS) Terminals Market, by Country, 2017-2030 (US$ Bn)
10.4.1. China
10.4.1.1. China Point Of Sale (POS) Terminals Market Estimates and Forecast, 2017-2030 (US$ Bn)
10.4.1.2. China Point Of Sale (POS) Terminals, By Product Outlook, 2017-2030 (US$ Bn)
10.4.1.3. China Point Of Sale (POS) Terminals, By Component Outlook, 2017-2030 (US$ Bn)
10.4.1.4. China Point Of Sale (POS) Terminals, By Deployment Outlook, 2017-2030 (US$ Bn)
10.4.2. Japan
10.4.2.1. Japan Point Of Sale (POS) Terminals Market Estimates and Forecast, 2017-2030 (US$ Bn)
10.4.2.2. Japan Point Of Sale (POS) Terminals, By Product Outlook, 2017-2030 (US$ Bn)
10.4.2.3. Japan Point Of Sale (POS) Terminals, By Component Outlook, 2017-2030 (US$ Bn)
10.4.2.4. Japan Point Of Sale (POS) Terminals, By Deployment Outlook, 2017-2030 (US$ Bn)
10.4.3. India
10.4.3.1. India Point Of Sale (POS) Terminals Market Estimates and Forecast, 2017-2030 (US$ Bn)
10.4.3.2. India Point Of Sale (POS) Terminals, By Product Outlook, 2017-2030 (US$ Bn)
10.4.3.3. India Point Of Sale (POS) Terminals, By Component Outlook, 2017-2030 (US$ Bn)
10.4.3.4. India Point Of Sale (POS) Terminals, By Deployment Outlook, 2017-2030 (US$ Bn)
10.4.4. South Korea
10.4.4.1. South Korea Point Of Sale (POS) Terminals Market Estimates and Forecast, 2017-2030 (US$ Bn)
10.4.4.2. South Korea Point Of Sale (POS) Terminals, By Product Outlook, 2017-2030 (US$ Bn)
10.4.4.3. South Korea Point Of Sale (POS) Terminals, By Component Outlook, 2017-2030 (US$ Bn)
10.4.4.4. South Korea Point Of Sale (POS) Terminals, By Deployment Outlook, 2017-2030 (US$ Bn)
10.4.5. South-East Asia
10.4.5.1. South-East Asia Point Of Sale (POS) Terminals Market Estimates and Forecast, 2017-2030 (US$ Bn)
10.4.5.2. South-East Asia Point Of Sale (POS) Terminals, By Product Outlook, 2017-2030 (US$ Bn)
10.4.5.3. South-East Asia Point Of Sale (POS) Terminals, By Component Outlook, 2017-2030 (US$ Bn)
10.4.5.4. South-East Asia Point Of Sale (POS) Terminals, By Deployment Outlook, 2017-2030 (US$ Bn)
10.4.6. Rest of Asia Pacific
10.4.6.1. Rest of Asia Pacific Point Of Sale (POS) Terminals Market Estimates and Forecast, 2017-2030 (US$ Bn)
10.4.6.2. Rest of Asia Pacific Point Of Sale (POS) Terminals, By Product Outlook, 2017-2030 (US$ Bn)
10.4.6.3. Rest of Asia Pacific Point Of Sale (POS) Terminals, By Component Outlook, 2017-2030 (US$ Bn)
10.4.6.4. Rest of Asia Pacific Point Of Sale (POS) Terminals, By Deployment Outlook, 2017-2030 (US$ Bn)


11. Latin America Point Of Sale (POS) Terminals Market Analysis
11.1. Latin America Point Of Sale (POS) Terminals Market, By Product Outlook, 2017-2030(US$ Bn)
11.1.1. Overview
11.1.2. SRC Analysis
11.2. Latin America Point Of Sale (POS) Terminals Market, by Component Outlook, 2017-2030(US$ Bn)
11.2.1. Overview
11.2.2. SRC Analysis
11.3. Latin America Point Of Sale (POS) Terminals Market, By Deployment Outlook, 2017-2030(US$ Bn)
11.3.1. Overview
11.3.2. SRC Analysis
11.4. Latin America Point Of Sale (POS) Terminals Market, by Country, 2017-2030 (US$ Bn)
11.4.1. Brazil
11.4.1.1. Brazil Point Of Sale (POS) Terminals Market Estimates and Forecast, 2017-2030 (US$ Bn)
11.4.1.2. Brazil Point Of Sale (POS) Terminals, By Product Outlook, 2017-2030 (US$ Bn)
11.4.1.3. Brazil Point Of Sale (POS) Terminals, By Component Outlook, 2017-2030 (US$ Bn)
11.4.1.4. Brazil Point Of Sale (POS) Terminals, By Deployment Outlook, 2017-2030 (US$ Bn)
11.4.2. Mexico
11.4.2.1. Mexico Point Of Sale (POS) Terminals Market Estimates and Forecast, 2017-2030 (US$ Bn)
11.4.2.2. Mexico Point Of Sale (POS) Terminals, By Product Outlook, 2017-2030 (US$ Bn)
11.4.2.3. Mexico Point Of Sale (POS) Terminals, By Component Outlook, 2017-2030 (US$ Bn)
11.4.2.4. Mexico Point Of Sale (POS) Terminals, By Deployment Outlook, 2017-2030 (US$ Bn)
11.4.3. Rest of Latin America
11.4.3.1. Rest of Latin America Point Of Sale (POS) Terminals Market Estimates and Forecast, 2017-2030 (US$ Bn)
11.4.3.2. Rest of Latin America Point Of Sale (POS) Terminals, By Product Outlook, 2017-2030 (US$ Bn)
11.4.3.3. Rest of Latin America Point Of Sale (POS) Terminals, By Component Outlook, 2017-2030 (US$ Bn)
11.4.3.4. Rest of Latin America Point Of Sale (POS) Terminals, By Deployment Outlook, 2017-2030 (US$ Bn)

12. Middle East and Africa Point Of Sale (POS) Terminals Market Analysis
12.1. Middle East and Africa Point Of Sale (POS) Terminals Market, By Product Outlook, 2017-2030(US$ Bn)
12.1.1. Overview
12.1.2. SRC Analysis
12.2. Middle East and Africa Point Of Sale (POS) Terminals Market, by Component Outlook, 2017-2030(US$ Bn)
12.2.1. Overview
12.2.2. SRC Analysis
12.3. Middle East and Africa Point Of Sale (POS) Terminals Market, By Deployment Outlook, 2017-2030(US$ Bn)
12.3.1. Overview
12.3.2. SRC Analysis
12.4. Middle East and Africa Point Of Sale (POS) Terminals Market, by Country, 2017-2030 (US$ Bn)
12.4.1. GCC Countries
12.4.1.1. GCC Countries Point Of Sale (POS) Terminals Market Estimates and Forecast, 2017-2030 (US$ Bn)
12.4.1.2. GCC Countries Point Of Sale (POS) Terminals, By Product Outlook, 2017-2030 (US$ Bn)
12.4.1.3. GCC Countries Point Of Sale (POS) Terminals, By Component Outlook, 2017-2030 (US$ Bn)
12.4.1.4. GCC Countries Point Of Sale (POS) Terminals, By Deployment Outlook, 2017-2030 (US$ Bn)
12.4.2. South Africa
12.4.2.1. South Africa Point Of Sale (POS) Terminals Market Estimates and Forecast, 2017-2030 (US$ Bn)
12.4.2.2. South Africa Point Of Sale (POS) Terminals, By Product Outlook, 2017-2030 (US$ Bn)
12.4.2.3. South Africa Point Of Sale (POS) Terminals, By Component Outlook, 2017-2030 (US$ Bn)
12.4.2.4. South Africa Point Of Sale (POS) Terminals, By Deployment Outlook, 2017-2030 (US$ Bn)
12.4.3. Rest of Middle East and Africa
12.4.3.1. Rest of Middle East and Africa Point Of Sale (POS) Terminals Market Estimates and Forecast, 2017-2030 (US$ Bn)
12.4.3.2. Rest of Middle East and Africa Point Of Sale (POS) Terminals, By Product Outlook, 2017-2030 (US$ Bn)
12.4.3.3. Rest of Middle East and Africa Point Of Sale (POS) Terminals, By Component Outlook, 2017-2030 (US$ Bn)
12.4.3.4. Rest of Middle East and Africa Point Of Sale (POS) Terminals, By Deployment Outlook, 2017-2030 (US$ Bn)

13. Company Profiles
13.1. Acrelec
13.1.1. Company Overview
13.1.2. Products/Services Portfolio
13.1.3. Geographical Presence
13.1.4. Financial Summary
13.1.4.1. Market Revenue and Net Profit (2019-2022)
13.1.4.2. Business Segment Revenue Analysis
13.1.4.3. Geographical Revenue Analysis
13.2. AURES Group; HM Electronics
13.3. Hewlett Packard Development LP
13.4. NCR Corp.
13.5. Oracle
13.6. Presto Group
13.7. Qu, Inc.
13.8. Quail Digital
13.9. Revel Systems
13.10. Toast Inc.
13.11. Toshiba Corp.
13.12. TouchBistro Inc.
13.13. Xenial Inc.

List of Figures
FIG. 1 Point Of Sale (POS) Terminals Market: Research Methodology
FIG. 2 Market Size Estimation – Top Down & Bottom up Approach
FIG. 3 Point Of Sale (POS) Terminals Market Segmentation
FIG. 4 Point Of Sale (POS) Terminals Market, By Product Outlook, 2022 (US$ Bn)
FIG. 5 Point Of Sale (POS) Terminals Market, by Component Outlook, 2022 (US$ Bn)
FIG. 6 Point Of Sale (POS) Terminals Market, By Deployment Outlook, 2022 (US$ Bn)
FIG. 7 Point Of Sale (POS) Terminals Market, by Geography, 2022 (US$ Bn)
FIG. 8 Attractive Investment Proposition, By Product Outlook, 2022
FIG. 9 Attractive Investment Proposition, by Component Outlook, 2022
FIG. 10 Attractive Investment Proposition, By Deployment Outlook, 2022
FIG. 11 Attractive Investment Proposition, by Geography, 2022
FIG. 12 Global Market Share Analysis of Key Point Of Sale (POS) Terminals Market Manufacturers, 2022
FIG. 13 Global Market Positioning of Key Point Of Sale (POS) Terminals Market Manufacturers, 2022
FIG. 14 Point Of Sale (POS) Terminals Market Value Contribution, By Product Outlook, 2022 & 2030 (Value %)
FIG. 15 Point Of Sale (POS) Terminals Market, by Fixed, Value, 2017-2030 (US$ Bn)
FIG. 16 Point Of Sale (POS) Terminals Market, by Mobile, Value, 2017-2030 (US$ Bn)
FIG. 17 Point Of Sale (POS) Terminals Market Value Contribution, By Component Outlook, 2022 & 2030 (Value %)
FIG. 18 Point Of Sale (POS) Terminals Market, by Hardware, Value, 2017-2030 (US$ Bn)
FIG. 19 Point Of Sale (POS) Terminals Market, by Software, Value, 2017-2030 (US$ Bn)
FIG. 20 Point Of Sale (POS) Terminals Market, by Services, Value, 2017-2030 (US$ Bn)
FIG. 21 Point Of Sale (POS) Terminals Market Value Contribution, By Deployment Outlook, 2022 & 2030 (Value %)
FIG. 22 Point Of Sale (POS) Terminals Market, by Cloud, Value, 2017-2030 (US$ Bn)
FIG. 23 Point Of Sale (POS) Terminals Market, by On-premise, Value, 2017-2030 (US$ Bn)
FIG. 24 U.S. Point Of Sale (POS) Terminals Market, 2017-2030 (US$ Bn)
FIG. 25 Canada Point Of Sale (POS) Terminals Market, 2017-2030 (US$ Bn)
FIG. 26 Germany Point Of Sale (POS) Terminals Market, 2017-2030 (US$ Bn)
FIG. 27 France Point Of Sale (POS) Terminals Market, 2017-2030 (US$ Bn)
FIG. 28 U.K. Point Of Sale (POS) Terminals Market, 2017-2030 (US$ Bn)
FIG. 29 Italy Point Of Sale (POS) Terminals Market, 2017-2030 (US$ Bn)
FIG. 30 Spain Point Of Sale (POS) Terminals Market, 2017-2030 (US$ Bn)
FIG. 31 Rest of Europe Point Of Sale (POS) Terminals Market, 2017-2030 (US$ Bn)
FIG. 32 China Point Of Sale (POS) Terminals Market, 2017-2030 (US$ Bn)
FIG. 33 Japan Point Of Sale (POS) Terminals Market, 2017-2030 (US$ Bn)
FIG. 34 India Point Of Sale (POS) Terminals Market, 2017-2030 (US$ Bn)
FIG. 35 South Korea Point Of Sale (POS) Terminals Market, 2017-2030 (US$ Bn)
FIG. 36 Southeast Asia Point Of Sale (POS) Terminals Market, 2017-2030 (US$ Bn)
FIG. 37 Rest of Asia Pacific Point Of Sale (POS) Terminals Market, 2017-2030 (US$ Bn)
FIG. 38 Latin America Point Of Sale (POS) Terminals Market, 2017-2030 (US$ Bn)
FIG. 39 Brazil Point Of Sale (POS) Terminals Market, 2017-2030 (US$ Bn)
FIG. 40 Mexico Point Of Sale (POS) Terminals Market, 2017-2030 (US$ Bn)
FIG. 41 Rest of Latin America Point Of Sale (POS) Terminals Market, 2017-2030 (US$ Bn)
FIG. 42 Middle East & Africa Point Of Sale (POS) Terminals Market, 2017-2030 (US$ Bn)
FIG. 43 GCC Countries Point Of Sale (POS) Terminals Market, 2017-2030 (US$ Bn)
FIG. 44 South Africa Point Of Sale (POS) Terminals Market, 2017-2030 (US$ Bn)
FIG. 45 Rest of Middle East and Africa Point Of Sale (POS) Terminals Market, 2017-2030 (US$ Bn)

List of Tables
TABLE 1 Market Snapshot: Point Of Sale (POS) Terminals Market
TABLE 2 Point Of Sale (POS) Terminals Market, by Competitive Benchmarking, 2022
TABLE 3 Point Of Sale (POS) Terminals Market, by Geographical Presence Analysis, 2022
TABLE 4 Point Of Sale (POS) Terminals Market, by Key Strategies Analysis, 2022
TABLE 5 Point Of Sale (POS) Terminals Market, By Product Outlook, 2017-2030 (US$ Bn)
TABLE 6 Point Of Sale (POS) Terminals Market, by Component Outlook, 2017-2030 (US$ Bn)
TABLE 7 Point Of Sale (POS) Terminals Market, By Deployment Outlook, 2017-2030 (US$ Bn)
TABLE 8 Point Of Sale (POS) Terminals Market, by Geography, 2017-2030 (US$ Bn)
TABLE 9 North America Point Of Sale (POS) Terminals Market, By Product Outlook, 2017-2030 (US$ Bn)
TABLE 10 North America Point Of Sale (POS) Terminals Market, by Component Outlook, 2017-2030 (US$ Bn)
TABLE 11 North America Point Of Sale (POS) Terminals Market, By Deployment Outlook, 2017-2030 (US$ Bn)
TABLE 12 North America Point Of Sale (POS) Terminals Market, by Country, 2017-2030 (US$ Bn)
TABLE 13 US Point Of Sale (POS) Terminals Market, By Product Outlook, 2017-2030 (US$ Bn)
TABLE 14 US Point Of Sale (POS) Terminals Market, by Component Outlook, 2017-2030 (US$ Bn)
TABLE 15 US Point Of Sale (POS) Terminals Market, By Deployment Outlook, 2017-2030 (US$ Bn)
TABLE 16 Canada Point Of Sale (POS) Terminals Market, By Product Outlook, 2017-2030 (US$ Bn)
TABLE 17 Canada Point Of Sale (POS) Terminals Market, by Component Outlook, 2017-2030 (US$ Bn)
TABLE 18 Canada Point Of Sale (POS) Terminals Market, By Deployment Outlook, 2017-2030 (US$ Bn)
TABLE 19 Europe Point Of Sale (POS) Terminals Market, By Product Outlook, 2017-2030 (US$ Bn)
TABLE 20 Europe Point Of Sale (POS) Terminals Market, by Component Outlook, 2017-2030 (US$ Bn)
TABLE 21 Europe Point Of Sale (POS) Terminals Market, By Deployment Outlook, 2017-2030 (US$ Bn)
TABLE 22 Europe Point Of Sale (POS) Terminals Market, by Country, 2017-2030 (US$ Bn)
TABLE 23 Germany Point Of Sale (POS) Terminals Market, By Product Outlook, 2017-2030 (US$ Bn)
TABLE 24 Germany Point Of Sale (POS) Terminals Market, by Component Outlook, 2017-2030 (US$ Bn)
TABLE 25 Germany Point Of Sale (POS) Terminals Market, By Deployment Outlook, 2017-2030 (US$ Bn)
TABLE 26 France Point Of Sale (POS) Terminals Market, By Product Outlook, 2017-2030 (US$ Bn)
TABLE 27 France Point Of Sale (POS) Terminals Market, by Component Outlook, 2017-2030 (US$ Bn)
TABLE 28 France Point Of Sale (POS) Terminals Market, By Deployment Outlook, 2017-2030 (US$ Bn)
TABLE 29 UK Point Of Sale (POS) Terminals Market, By Product Outlook, 2017-2030 (US$ Bn)
TABLE 30 UK Point Of Sale (POS) Terminals Market, by Component Outlook, 2017-2030 (US$ Bn)
TABLE 31 UK Point Of Sale (POS) Terminals Market, By Deployment Outlook, 2017-2030 (US$ Bn)
TABLE 32 Italy Point Of Sale (POS) Terminals Market, By Product Outlook, 2017-2030 (US$ Bn)
TABLE 33 Italy Point Of Sale (POS) Terminals Market, by Component Outlook, 2017-2030 (US$ Bn)
TABLE 34 Italy Point Of Sale (POS) Terminals Market, By Deployment Outlook, 2017-2030 (US$ Bn)
TABLE 35 Spain Point Of Sale (POS) Terminals Market, By Product Outlook, 2017-2030 (US$ Bn)
TABLE 36 Spain Point Of Sale (POS) Terminals Market, by Component Outlook, 2017-2030 (US$ Bn)
TABLE 37 Spain Point Of Sale (POS) Terminals Market, By Deployment Outlook, 2017-2030 (US$ Bn)
TABLE 38 Rest of Europe Point Of Sale (POS) Terminals Market, By Product Outlook, 2017-2030 (US$ Bn)
TABLE 39 Rest of Europe Point Of Sale (POS) Terminals Market, by Component Outlook, 2017-2030 (US$ Bn)
TABLE 40 Rest of Europe Point Of Sale (POS) Terminals Market, By Deployment Outlook, 2017-2030 (US$ Bn)
TABLE 41 Asia Pacific Point Of Sale (POS) Terminals Market, By Product Outlook, 2017-2030 (US$ Bn)
TABLE 42 Asia Pacific Point Of Sale (POS) Terminals Market, by Component Outlook, 2017-2030 (US$ Bn)
TABLE 43 Asia Pacific Point Of Sale (POS) Terminals Market, By Deployment Outlook, 2017-2030 (US$ Bn)
TABLE 44 Asia Pacific Point Of Sale (POS) Terminals Market, by Country, 2017-2030 (US$ Bn)
TABLE 45 China Point Of Sale (POS) Terminals Market, By Product Outlook, 2017-2030 (US$ Bn)
TABLE 46 China Point Of Sale (POS) Terminals Market, by Component Outlook, 2017-2030 (US$ Bn)
TABLE 47 China Point Of Sale (POS) Terminals Market, By Deployment Outlook, 2017-2030 (US$ Bn)
TABLE 48 Japan Point Of Sale (POS) Terminals Market, By Product Outlook, 2017-2030 (US$ Bn)
TABLE 49 Japan Point Of Sale (POS) Terminals Market, by Component Outlook, 2017-2030 (US$ Bn)
TABLE 50 Japan Point Of Sale (POS) Terminals Market, By Deployment Outlook, 2017-2030 (US$ Bn)
TABLE 51 India Point Of Sale (POS) Terminals Market, By Product Outlook, 2017-2030 (US$ Bn)
TABLE 52 India Point Of Sale (POS) Terminals Market, by Component Outlook, 2017-2030 (US$ Bn)
TABLE 53 India Point Of Sale (POS) Terminals Market, By Deployment Outlook, 2017-2030 (US$ Bn)
TABLE 54 South Korea Point Of Sale (POS) Terminals Market, By Product Outlook, 2017-2030 (US$ Bn)
TABLE 55 South Korea Point Of Sale (POS) Terminals Market, by Component Outlook, 2017-2030 (US$ Bn)
TABLE 56 South Korea Point Of Sale (POS) Terminals Market, By Deployment Outlook, 2017-2030 (US$ Bn)
TABLE 57 South East Asia Point Of Sale (POS) Terminals Market, By Product Outlook, 2017-2030 (US$ Bn)
TABLE 58 South East Asia Point Of Sale (POS) Terminals Market, by Component Outlook, 2017-2030 (US$ Bn)
TABLE 59 South East Asia Point Of Sale (POS) Terminals Market, By Deployment Outlook, 2017-2030 (US$ Bn)
TABLE 60 Rest of Asia Pacific Point Of Sale (POS) Terminals Market, By Product Outlook, 2017-2030 (US$ Bn)
TABLE 61 Rest of Asia Pacific Point Of Sale (POS) Terminals Market, by Component Outlook, 2017-2030 (US$ Bn)
TABLE 62 Rest of Asia Pacific Point Of Sale (POS) Terminals Market, By Deployment Outlook, 2017-2030 (US$ Bn)
TABLE 63 Latin America Point Of Sale (POS) Terminals Market, By Product Outlook, 2017-2030 (US$ Bn)
TABLE 64 Latin America Point Of Sale (POS) Terminals Market, by Component Outlook, 2017-2030 (US$ Bn)
TABLE 65 Latin America Point Of Sale (POS) Terminals Market, By Deployment Outlook, 2017-2030 (US$ Bn)
TABLE 66 Latin America Point Of Sale (POS) Terminals Market, by Country, 2017-2030 (US$ Bn)
TABLE 67 Brazil Point Of Sale (POS) Terminals Market, By Product Outlook, 2017-2030 (US$ Bn)
TABLE 68 Brazil Point Of Sale (POS) Terminals Market, by Component Outlook, 2017-2030 (US$ Bn)
TABLE 69 Brazil Point Of Sale (POS) Terminals Market, By Deployment Outlook, 2017-2030 (US$ Bn)
TABLE 70 Mexico Point Of Sale (POS) Terminals Market, By Product Outlook, 2017-2030 (US$ Bn)
TABLE 71 Mexico Point Of Sale (POS) Terminals Market, by Component Outlook, 2017-2030 (US$ Bn)
TABLE 72 Mexico Point Of Sale (POS) Terminals Market, By Deployment Outlook, 2017-2030 (US$ Bn)
TABLE 73 Rest of Latin America Point Of Sale (POS) Terminals Market, By Product Outlook, 2017-2030 (US$ Bn)
TABLE 74 Rest of Latin America Point Of Sale (POS) Terminals Market, by Component Outlook, 2017-2030 (US$ Bn)
TABLE 75 Rest of Latin America Point Of Sale (POS) Terminals Market, By Deployment Outlook, 2017-2030 (US$ Bn)
TABLE 76 Middle East and Africa Point Of Sale (POS) Terminals Market, By Product Outlook, 2017-2030 (US$ Bn)
TABLE 77 Middle East and Africa Point Of Sale (POS) Terminals Market, by Component Outlook, 2017-2030 (US$ Bn)
TABLE 78 Middle East and Africa Point Of Sale (POS) Terminals Market, By Deployment Outlook, 2017-2030 (US$ Bn)
TABLE 79 Middle East and Africa Point Of Sale (POS) Terminals Market, by Country, 2017-2030 (US$ Bn)
TABLE 80 GCC Countries Point Of Sale (POS) Terminals Market, By Product Outlook, 2017-2030 (US$ Bn)
TABLE 81 GCC Countries Point Of Sale (POS) Terminals Market, by Component Outlook, 2017-2030 (US$ Bn)
TABLE 82 GCC Countries Point Of Sale (POS) Terminals Market, By Deployment Outlook, 2017-2030 (US$ Bn)
TABLE 83 South Africa Point Of Sale (POS) Terminals Market, By Product Outlook, 2017-2030 (US$ Bn)
TABLE 84 South Africa Point Of Sale (POS) Terminals Market, by Component Outlook, 2017-2030 (US$ Bn)
TABLE 85 South Africa Point Of Sale (POS) Terminals Market, By Deployment Outlook, 2017-2030 (US$ Bn)
TABLE 86 Rest of Middle East and Africa Point Of Sale (POS) Terminals Market, By Product Outlook, 2017-2030 (US$ Bn)
TABLE 87 Rest of Middle East and Africa Point Of Sale (POS) Terminals Market, by Component Outlook, 2017-2030 (US$ Bn)
TABLE 88 Rest of Middle East and Africa Point Of Sale (POS) Terminals Market, By Deployment Outlook, 2017-2030 (US$ Bn)

Frequently Asked Questions

How does COVID-19 Impact the global POS terminals market?

COVID-19 has had a substantial impact on the market due to the outbreak of the COVID-19 pandemic, which impacted the demand for POS terminals.

Which is the leading region of the market for POS terminals?

Asia Pacific accounted for the most heightened global POS terminals market share.

What are the key drivers for the growth of the POS terminals market?

Growing demand in the quick service restaurants to drive the POS terminals market.

Which is the major POS terminals market segment by product?

The fixed segment had a major global market share in 2022.

Which is the major POS terminals market segment by component?

The hardware segment had a major global market share in 2022.

Electrical Computer-Aided Design (ECAD) Market

Published:
Report ID: 36638

Fiber Optics Market

Published:
Report ID: 36367

Field Programmable Gate Array (FPGA) Market

Published:
Report ID: 36359

Electronic Contract Manufacturing and Design Services Market

Published:
Report ID: 36355

Battery Energy Storage System Market

Published:
Report ID: 36352

Laptop Market

Published:
Report ID: 36318

Fiber Optic Preform Market

Published:
Report ID: 36286

Commercial Display Market

Published:
Report ID: 36262

Vibration Control System Market

Published:
Report ID: 36259

Semiconductor Memory Market

Published:
Report ID: 36250

North America Industrial Valve Market

Published:
Report ID: 36223

Flip Chip Market

Published:
Report ID: 36203

Purchase Options

$2999
Delivery Format: Excel.
$4999
Designed for the individual purchaser.
$6999
Users located at a single corporate site or regional office.
$7999
Allowed for unlimited sharing globally within one company.
Smallform of Sample request

Have a question?

User Profile

Don’t settle for less – trust Mitul to help you find the best solution.

Report delivery within 24 to 48 hours

– Other Info –

What people say?-

User Review

I am very impressed with the information in this report. The author clearly did their research when they came up with this product and it has already given me a lot of ideas.

Jana Schmidt
CEDAR CX Technologies

– Connect with us –

Phone

+91 6232 49 3207


support

24/7 Research Support


sales@credenceresearch.com

– Research Methodology –

Going beyond the basics: advanced techniques in research methodology

– Trusted By –

Pepshi, LG, Nestle
Motorola, Honeywell, Johnson and johnson
LG Chem, SIEMENS, Pfizer
Unilever, Samsonite, QIAGEN