
Market Overview:
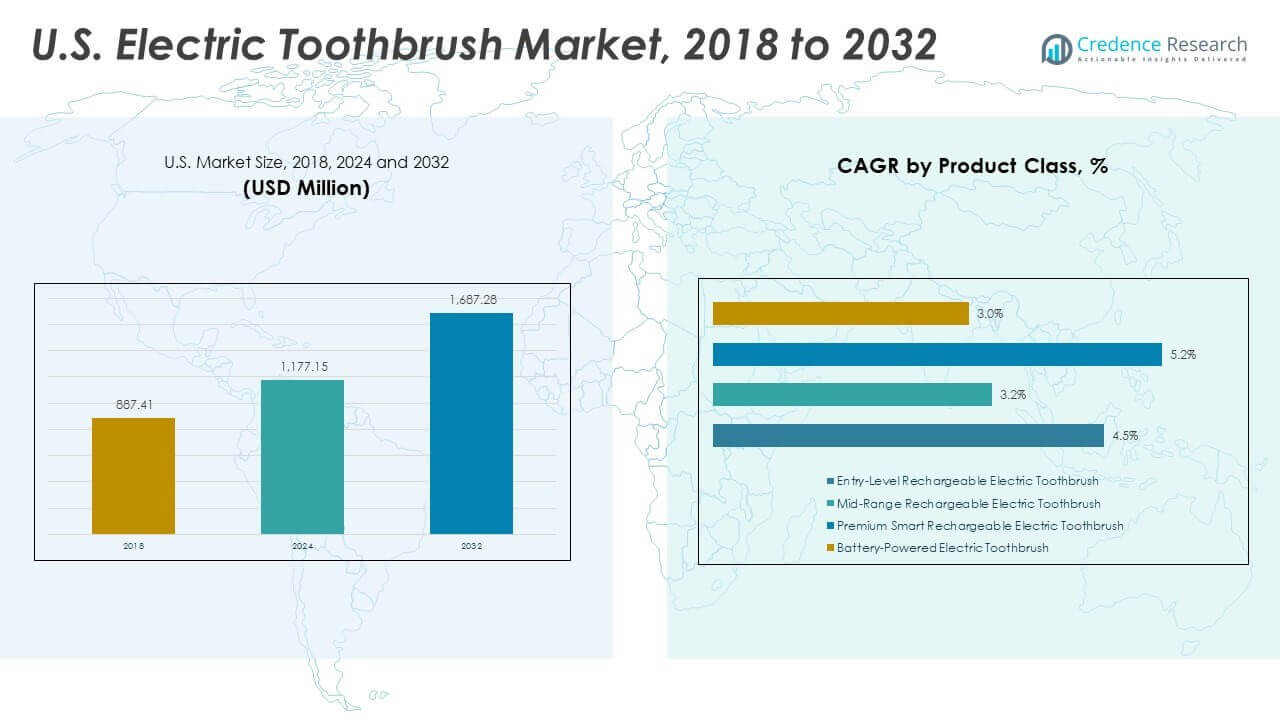
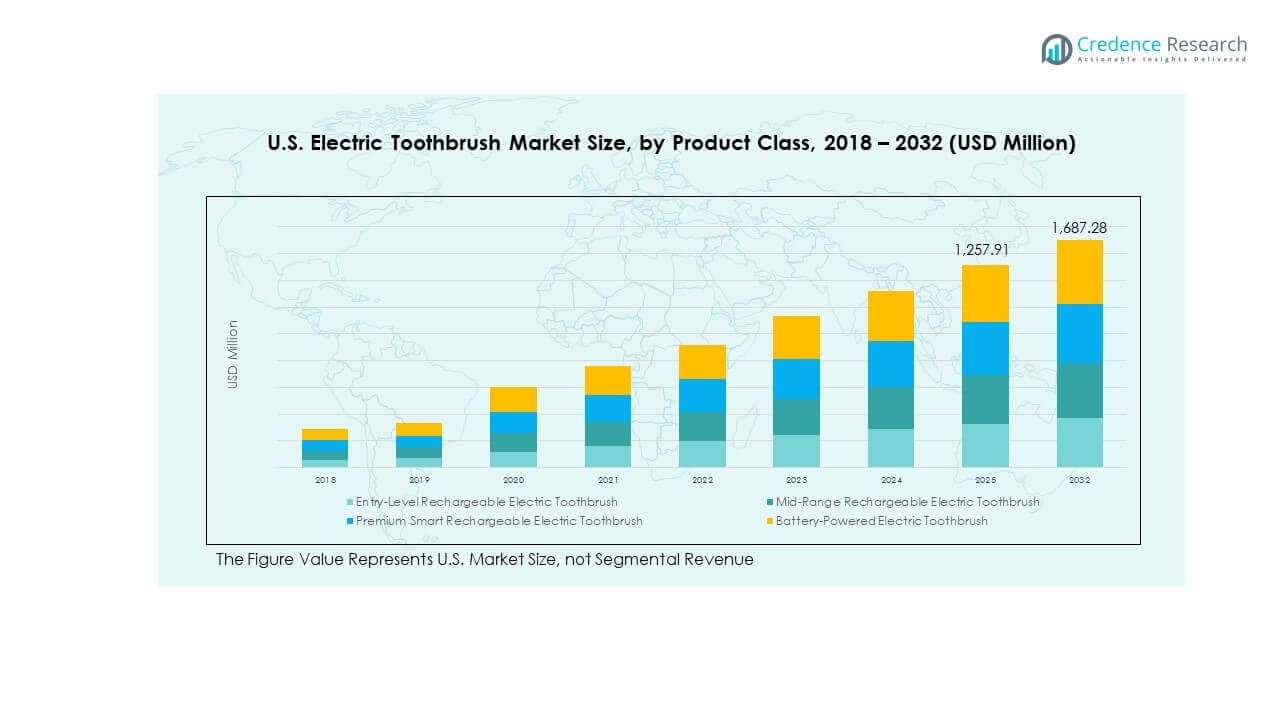
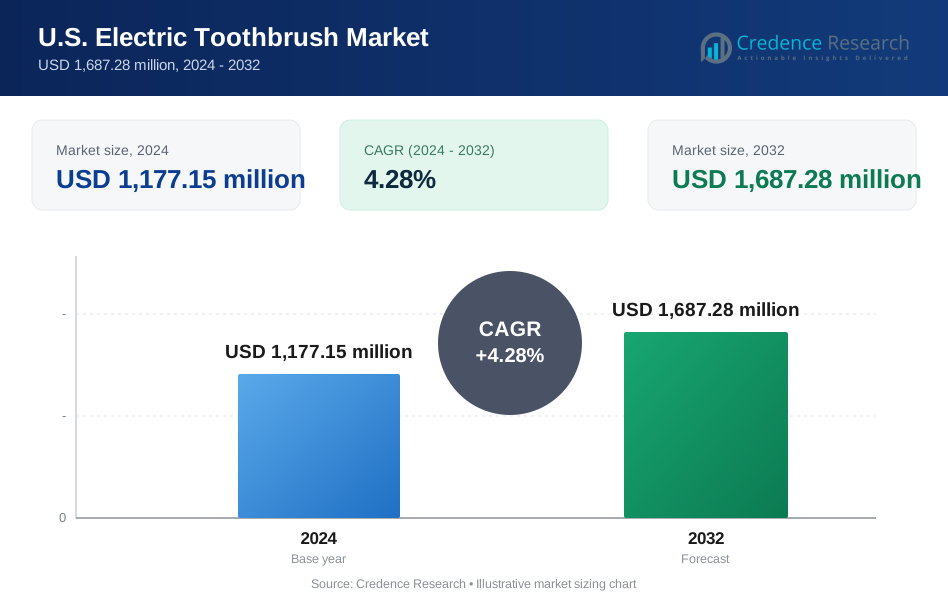
The U.S. Electric Toothbrush Market size was valued at USD 887.41 million in 2018 to USD 1,177.15 million in 2024 and is anticipated to reach USD 1,687.28 million by 2032, at a CAGR of 4.28% during the forecast period.
| REPORT ATTRIBUTE | DETAILS |
|---|---|
| Historical Period | 2020-2023 |
| Base Year | 2024 |
| Forecast Period | 2025-2032 |
| U.S. Electric Toothbrush Market Size 2024 | USD 1,177.15 million |
| U.S. Electric Toothbrush Market, CAGR | 4.28% |
| U.S. Electric Toothbrush Market Size 2032 | USD 1,687.28 million |
The market continues to grow with rising consumer awareness of oral health and the benefits of powered brushing. Electric toothbrushes offer better plaque removal, gum care, and cleaning efficiency compared to manual options. Dentists actively recommend these products, while brands invest in features like pressure sensors, Bluetooth connectivity, and app integration. Subscription models for brush head replacements are improving long-term adoption. Pediatric and geriatric users are increasingly served with age-specific variants, and smart features are driving engagement. Retail expansion and e-commerce accessibility support wider market reach. Technology innovation remains a core differentiator.
Regionally, the Northeast leads the market due to higher urbanization, income levels, and dental insurance coverage. The West follows closely, benefiting from tech-driven consumer behavior and e-commerce penetration. The South and Midwest are emerging segments with growing awareness and adoption, supported by retail expansion and public dental programs. Entry-level models are gaining ground in these regions, where affordability and availability drive first-time purchases. Regional campaigns, school initiatives, and dental care alliances are helping to bridge access gaps and expand electric toothbrush use.
Market Insights
- The U.S. Electric Toothbrush Market was valued at USD 887.41 million in 2018, grew to USD 1,177.15 million in 2024, and is projected to reach USD 1,687.28 million by 2032, registering a CAGR of 4.28%.
- The Northeast leads with a 34% market share, driven by dense urbanization and high dental coverage; the West follows with 28%, supported by e-commerce and innovation; the South holds 22%, aided by rising awareness and access expansion.
- The Midwest, with a 16% share, is the fastest-growing region due to increasing adoption of entry-level models, public dental programs, and expanding retail penetration.
- In 2024, Entry-Level Rechargeable Electric Toothbrushes accounted for the largest share among all product classes, supported by affordability and broad consumer appeal.
- Mid-Range Rechargeable Electric Toothbrushes recorded the highest CAGR at 5.2%, reflecting strong interest in performance-value models with extended battery life and smart features.
Market Drivers
Rising Consumer Focus on Preventive Oral Health and Dentist Recommendations
Growing awareness about oral hygiene across all age groups is driving demand for electric toothbrushes. Dental associations and professionals continue to recommend electric models over manual brushes. Users are responding positively to clinical evidence showing superior plaque removal and gum health benefits. Preventive care adoption has increased among adults and children due to frequent dental promotions. The U.S. Electric Toothbrush Market benefits from expanded awareness campaigns by oral care brands. Public health programs also support early intervention, encouraging the use of advanced dental tools. High dental insurance coverage in urban areas aids market penetration. Users prefer electric variants to reduce dental visits and long-term costs. Brands are investing in dentist partnerships to build product credibility.
- For instance, Oral-B iO Series removed 100% more plaque along the gumline than a manual toothbrush in clinical trials.
Technology Advancements Enhancing User Experience and Driving Repeat Purchases
Smart features such as pressure sensors, timer functions, and Bluetooth connectivity increase consumer interest. Personalized brushing feedback through connected apps appeals to health-conscious users. Manufacturers introduce AI-powered features to optimize brushing angles and pressure levels. Product innovations raise satisfaction and support replacement cycles. Rechargeable lithium-ion batteries extend usability and reduce maintenance. The U.S. Electric Toothbrush Market sees increased traction from models with wireless charging and waterproof design. Enhanced ergonomic grips and brush head compatibility improve usability across demographics. Subscription-based brush head delivery encourages long-term engagement. Smart variants support user retention with habit-building features.
Expansion of E-Commerce and Subscription Platforms Accelerating Market Access
Online channels provide convenient access to a wider product range and personalized buying experiences. Direct-to-consumer models strengthen brand control and improve pricing strategies. Subscription services automate replacement cycles, raising brand loyalty and recurring revenue. The U.S. Electric Toothbrush Market experiences growth through e-commerce promotions and bundling. Influencer marketing and targeted digital ads drive awareness across income groups. Online reviews and video demonstrations build product trust in absence of physical trials. E-commerce growth lowers entry barriers for emerging brands. Bulk sales and discounted bundles attract family buyers online. Logistics improvements support timely delivery of brush heads and accessories.
- For instance, Quip's subscription program automates quarterly brush head deliveries and supports multi-channel fulfillment through Amazon and direct-to-consumer sales, helping improve long-term customer retention.
Rising Pediatric and Geriatric Use Cases Supporting Segment Diversification
Pediatric oral care segments are growing due to age-specific product designs and gamified brushing. Brands are launching character-themed electric toothbrushes with interactive mobile apps. Parents adopt these models to encourage consistent brushing habits in children. For elderly users, electric models offer improved grip and ease of use for limited mobility. The U.S. Electric Toothbrush Market sees tailored features like softer bristles and longer handles for senior populations. Retailers offer specialized SKUs for different age groups to meet evolving oral care needs. Institutional buyers like elder-care facilities add to volume demand. Pediatric dental programs in schools encourage early electric toothbrush use. This dual-segment demand improves volume consistency across life stages.
Market Trends
Growing Integration of Artificial Intelligence for Personalized Brushing Guidance
AI features are transforming user experience by providing real-time brushing feedback and pattern analysis. These smart toothbrushes detect missed areas and advise users through companion apps. The U.S. Electric Toothbrush Market embraces AI to support better oral care compliance. Manufacturers release models with AI-powered motion sensors and adaptive feedback mechanisms. These innovations help consumers maintain dental routines between dentist visits. Gamification through AI-driven scoring systems appeals to younger users. Data synchronization with mobile health apps enhances long-term tracking. AI-backed platforms allow dentists to remotely monitor patient habits. Cloud-linked toothbrushes form part of connected personal care ecosystems.
Design-Led Differentiation Gaining Momentum Across Premium and Mass Segments
Aesthetic appeal plays a central role in purchase decisions among design-conscious consumers. Brands prioritize sleek forms, color variants, and minimalistic aesthetics in newer models. Premium lines feature travel cases, metal finishes, and noise-reduction features. The U.S. Electric Toothbrush Market sees demand for well-designed products that align with lifestyle preferences. Compact charging bases and wall-mounted docks support modern bathroom layouts. Design upgrades also help justify premium pricing tiers. Personalization options, including engraving and color matching, boost customer retention. Gender-neutral designs expand appeal across all user segments. Visual innovation remains a strong competitive lever across brands.
- For instance, Philips Sonicare Prestige 9900 delivers 62,000 brush strokes per minute with a SenseIQ pressure sensor, verified in official specs.
Eco-Conscious Product Innovations Addressing Consumer Sustainability Demands
Sustainability considerations are shaping product and packaging decisions across top brands. Recyclable brush heads, compostable packaging, and low-waste charging docks gain traction. The U.S. Electric Toothbrush Market sees stronger messaging around carbon footprint reduction. Manufacturers adopt lifecycle-friendly materials such as bioplastics and aluminum. Subscription kits now include reusable components to minimize single-use waste. Battery longevity improvements support green marketing narratives. Return-and-recycle schemes enhance brand reputation and customer retention. Environmentally responsible consumers opt for brands with verified sustainability practices. Regulatory pressure and ESG mandates also influence product design decisions.
Integration of Voice Assistance and IoT in Smart Oral Care Ecosystems
Voice-enabled toothbrushes are entering the market as part of the wider smart home trend. Some models now support Amazon Alexa or Google Assistant for reminders and brushing tips. The U.S. Electric Toothbrush Market leverages IoT to deliver enhanced convenience and health tracking. Toothbrushes are syncing with broader home ecosystems for scheduling and reporting. IoT functions assist users with habit formation and remote family monitoring. Parents can monitor children's brushing via app dashboards. Seniors benefit from alert systems when routines are missed. Connected devices also sync with smart mirrors and bathroom sensors. Oral care brands are expanding app compatibility across platforms.
- For instance, Colgate Hum Smart Toothbrush tracks brushing habits through its mobile app, offering personalized feedback and zone recognition, as detailed in official product features.
Market Challenges Analysis
High Cost of Ownership Limiting Access Among Price-Sensitive and Underserved Groups
Electric toothbrushes remain significantly more expensive than manual brushes in both purchase and maintenance. Low-income households delay or avoid adoption due to upfront and replacement costs. The U.S. Electric Toothbrush Market struggles to expand among rural and Medicaid-dependent populations. Subscription models add ongoing expenses, deterring budget-conscious users. Lack of coverage for electric models in most insurance plans further limits accessibility. Retailers report slower rotation rates in discount-driven store formats. Distribution gaps exist in underserved areas where dental outreach is limited. Market penetration slows in segments with lower healthcare literacy or digital engagement. This challenge creates gaps in oral health equity across regions.
Replacement Rates and Battery Longevity Affecting Long-Term User Retention
Consumer retention depends heavily on replacement brush heads, yet compliance is often low. Many users delay replacement cycles due to cost, inconvenience, or lack of reminders. The U.S. Electric Toothbrush Market faces attrition from users who revert to manual brushing. Battery life degradation after 1–2 years reduces long-term satisfaction. Non-universal brush head fittings limit flexibility and drive up total cost of use. Users often switch brands to avoid costly proprietary replacements. Limited availability of spare parts affects repairability and lifetime value. Disposal challenges related to electronics and lithium batteries affect sustainability claims. Retention strategies depend on reducing friction in maintenance cycles.
Market Opportunities
Growth Potential from Institutional Partnerships and Dental Service Integration
Opportunities exist in expanding dental clinic and insurance partnerships for bundled offerings. Dentists can promote electric toothbrushes during regular checkups and wellness programs. The U.S. Electric Toothbrush Market can grow by embedding products in employer health benefits. School dental programs create channels for pediatric model adoption. Elder care homes offer scope for bulk sales through care packages. Institutions act as influencers for trust and long-term behavior change. Public health campaigns could subsidize access in underserved zones. Brand tie-ups with dental chains open access to guided trials and onboarding support.
Expansion Opportunities Through Entry-Level Models and Regional Tailoring
Low-cost models provide an entry point for first-time users in price-sensitive markets. Simplified variants without smart features reduce barriers to adoption. The U.S. Electric Toothbrush Market can scale by tailoring assortments to local retail formats. Targeted models for rural clinics, mobile vans, and schools can broaden reach. Regional brands can develop culturally resonant designs or packaging. Localization in messaging and access channels will support broader demographic engagement. Refill availability and affordable repair services can build loyalty. Regional bundling with oral hygiene kits creates added value.
Market Segmentation Analysis
By Product Class
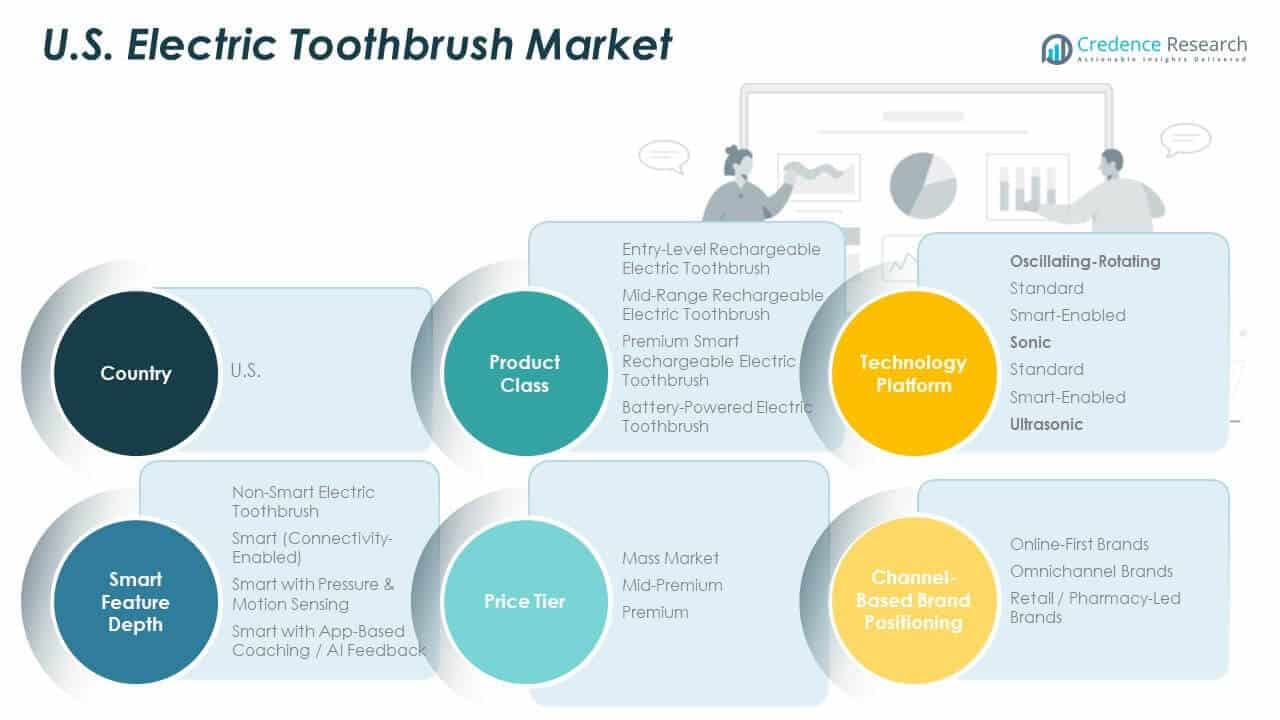
Entry-level rechargeable toothbrushes dominate volume sales through affordability and basic functionality. Mid-range models offer longer battery life and improved brush heads. Premium smart variants lead in value share with AI features and personalized tracking. Battery-powered options retain relevance in travel and pediatric segments. The U.S. Electric Toothbrush Market sees clear segmentation by performance tier and user preference.
- For instance, Oral-B Pro 1000 delivers 8,800 oscillations and 20,000 pulsations per minute for plaque removal.
By Smart Feature Depth
Non-smart models cater to value-conscious buyers seeking simplicity. Connectivity-enabled brushes appeal to digitally active consumers. Units with pressure and motion sensing improve brushing accuracy and safety. Models with AI-based coaching are growing in premium and pediatric segments. The U.S. Electric Toothbrush Market aligns product differentiation with digital behavior.
By Technology Platform
Oscillating-rotating toothbrushes lead in adoption due to dentist preference and clinical performance. Smart-enabled versions of this platform gain share through app integration. Sonic variants offer quieter operation and high-frequency movement. Smart sonic models appeal to premium users. Ultrasonic toothbrushes remain a niche category focused on specialized needs. The U.S. Electric Toothbrush Market diversifies through targeted platform innovation.
By Price Tier
Mass market brushes drive volume through large-format retail and basic features. Mid-premium products balance performance and cost. Premium SKUs deliver AI, design, and smart integration. The U.S. Electric Toothbrush Market remains price-segmented with growing preference for mid-premium offerings.
By Channel-Based Brand Positioning
Online-first brands grow rapidly through DTC models and subscription kits. Omnichannel players offer broad access and balanced brand visibility. Retail/pharmacy-led brands rely on dentist tie-ups and footfall-driven sales. The U.S. Electric Toothbrush Market benefits from hybrid distribution models.
By SKU Positioning
Flagship models anchor premium lines and showcase innovation. Core volume SKUs maintain consistent shelf presence and sales flow. Entry models introduce new users to electric formats. The U.S. Electric Toothbrush Market uses clear SKU strategies for each consumer tier.
By End User
Adults form the largest user base, especially in premium and smart segments. Children benefit from gamified, character-branded models tailored for habit formation. The U.S. Electric Toothbrush Market supports age-specific product innovation and targeted messaging.
- For instance, Oral-B Kids features Bluetooth connectivity and app-guided brushing via the Disney Magic Timer app, supporting habit formation in younger users. The U.S. Electric Toothbrush Market supports age-specific product innovation and targeted messaging.
Segmentation
By Product Class
- Entry-Level Rechargeable Electric Toothbrush
- Mid-Range Rechargeable Electric Toothbrush
- Premium Smart Rechargeable Electric Toothbrush
- Battery-Powered Electric Toothbrush
By Smart Feature Depth
- Non-Smart Electric Toothbrush
- Smart (Connectivity-Enabled)
- Smart with Pressure & Motion Sensing
- Smart with App-Based Coaching / AI Feedback
By Technology Platform
- Oscillating-Rotating
- Standard
- Smart-Enabled
- Sonic
- Standard
- Smart-Enabled
- Ultrasonic
By Price Tier
- Mass Market
- Mid-Premium
- Premium
By Channel-Based Brand Positioning
- Online-First Brands
- Omnichannel Brands
- Retail / Pharmacy-Led Brands
By SKU Positioning
- Flagship / Hero Models
- Core Volume Models
- Value / Entry Models
By End User
- Adults
- Children
Regional Analysis
Northeast U.S. – Leading Market with Strong Dental Awareness and Urban Penetration
The Northeast accounts for the largest share in the U.S. Electric Toothbrush Market, holding approximately 34% of the total revenue. High population density, access to dental services, and strong insurance coverage support demand. Urban centers such as New York City and Boston drive premium product adoption. Consumers in this region favor smart toothbrushes with app connectivity and AI feedback. High disposable income supports frequent brush head replacements and subscription renewals. The Northeast also sees high dentist-led promotions and clinical endorsements, reinforcing market traction.
West U.S. – Innovation-Centric Adoption and Strong E-Commerce Penetration
The Western region contributes around 28% to the U.S. Electric Toothbrush Market, led by innovation-focused states like California and Washington. Consumer preferences align with tech-enabled health solutions and sustainable product choices. E-commerce dominance in the region accelerates adoption of direct-to-consumer brands. Product personalization, design-led formats, and smart features gain rapid acceptance. The region's high-tech ecosystems promote early adoption of AI-integrated models. Sustainability-driven users in coastal states support growth in recyclable and eco-conscious toothbrush variants.
South and Midwest U.S. – Emerging Growth Hubs with Untapped Consumer Segments
The South holds approximately 22% share, while the Midwest accounts for 16% of the U.S. Electric Toothbrush Market. These regions show rising demand driven by expanding healthcare access and growing awareness. Retail growth in tier-2 and tier-3 cities supports wider product availability. Mid-income households in these areas increasingly adopt entry-level electric toothbrushes. Public dental programs and school-based awareness initiatives drive pediatric adoption. Manufacturers are localizing strategies with cost-effective models and regional promotions to expand their footprint.
Key Player Analysis
- Procter & Gamble (Oral-B)
- Philips (Sonicare)
- Colgate-Palmolive
- Church & Dwight (Arm & Hammer)
- Quip
- Waterpik
- Burst Oral Care
- Fairywill
- FOREO
- SmileDirectClub
Competitive Analysis
The U.S. Electric Toothbrush Market features a mix of global leaders and emerging domestic brands competing across pricing tiers. Philips Sonicare and Oral-B dominate the premium and mid-range segments, offering a broad portfolio of rechargeable, smart, and app-connected models. These players invest heavily in clinical trials, dentist endorsements, and AI-powered features. Colgate and Quip compete effectively in the subscription and mass-affordable segments by targeting younger demographics and emphasizing design simplicity. Burst and Snow are gaining traction through influencer-driven marketing and direct-to-consumer sales models. Retailers like Amazon and Walmart support private label competition through aggressive pricing and bundling strategies. Brand differentiation now relies on battery life, replacement head availability, ergonomic design, and integration with digital health ecosystems. Subscription models, loyalty programs, and sustainable packaging are emerging as key retention tools. The market remains highly fragmented at the entry level, where newer players target underserved consumer segments with simplified, low-cost electric options. Companies are investing in pediatric and senior-focused innovations to expand across life stages.
Recent Developments
- In September 2025, Philips Sonicare launched the 600 and 0 series toothbrushes in the U.S. electric toothbrush market. These models feature next-generation Sonicare technology for enhanced cleaning, gentle gum care, and app-based personalization, including pressure sensors and extended battery life, exclusively available at Walmart.
- In May 2025, Dental Care Alliance announced a strategic partnership with Philips Oral Healthcare designating Philips Sonicare as the preferred toothbrush across over 400 affiliated practices nationwide. This collaboration provides clinicians with enhanced access to Sonicare products, educational resources, and in-office materials to promote better patient oral hygiene and long-term wellness.
- In March 2024, Keosaa released a new series of electric toothbrushes on Amazon targeting the U.S. market. These incorporate ultrasonic technology and DuPont nylon bristles with two modes for effective cleaning.
Report Coverage
The research report offers an in-depth analysis based on Product Class, Smart Feature Depth, Technology Platform, Price Tier, Channel-Based Brand Positioning, SKU Positioning and End User. It details leading market players, providing an overview of their business, product offerings, investments, revenue streams, and key applications. Additionally, the report includes insights into the competitive environment, SWOT analysis, current market trends, as well as the primary drivers and constraints. Furthermore, it discusses various factors that have driven market expansion in recent years. The report also explores market dynamics, regulatory scenarios, and technological advancements that are shaping the industry. It assesses the impact of external factors and global economic changes on market growth. Lastly, it provides strategic recommendations for new entrants and established companies to navigate the complexities of the market.
Future Outlook
- Subscription-based brush head replacements will drive recurring revenue and support long-term brand loyalty.
- AI-integrated models with adaptive brushing feedback will reshape user expectations and competitive benchmarks.
- Pediatric and geriatric segments will expand due to specialized product launches and institutional demand.
- Retailers will emphasize sustainable packaging and recyclable components to meet eco-conscious buyer needs.
- E-commerce platforms will strengthen direct-to-consumer channels through personalized offerings and bundling.
- Public-private partnerships will increase distribution in schools, clinics, and elder care facilities.
- Entry-level electric models will gain traction in rural and price-sensitive urban markets.
- Integration with digital health ecosystems will enhance toothbrush usage compliance and dentist collaboration.
- Voice-enabled smart toothbrushes will emerge as niche but growing innovations for connected homes.
- Competitive pricing and repair-friendly features will influence purchasing decisions across middle-income groups.
Request a Free Sample
Fill in your details and we'll send you a free sample report.
- Sample data tables & charts
- Research methodology
Need a Custom Version of This Report?
Tailor the scope, geography, or segments to your exact requirements.
- Custom geography or segment scope
- Direct access to our analyst team
Frequently Asked Questions
What is the current market size for U.S. Electric Toothbrush Market, and what is its projected size in 2032?
At what Compound Annual Growth Rate is the U.S. Electric Toothbrush Market projected to grow between 2024 and 2032?
Which U.S. Electric Toothbrush Market segment held the largest share in 2024?
What are the primary factors fueling the growth of the U.S. Electric Toothbrush Market?
Who are the leading companies in the U.S. Electric Toothbrush Market?
Which region commanded the largest share of the U.S. Electric Toothbrush Market in 2024?
Table of Content
Chapter 1. Report Introduction
- 1.1 Report Description & Purpose
- 1.1.1 Report Title & Market Definition
- 1.1.2 Unique Selling Propositions (USP) & Key Differentiators
- 1.1.3 Value Proposition for Stakeholders
- 1.2 Research Objectives
- 1.2.1 Market Sizing Objectives (Volume & Revenue) (Volume Where Applicable)
- 1.2.2 Segmentation Objectives
- 1.2.3 Competitive Intelligence Objectives
- 1.2.4 Forecast & Scenario Objectives
- 1.3 Report Scope
- 1.3.1 U.S. Electric Toothbrush Scope – Segments & Subsegments Covered
- 1.3.2 Geographic Scope – Selected Country & Subnational Markets Covered
- 1.3.3 Historical Period, Base Year & Forecast Period (2024; forecast to 2032)
- 1.3.4 Inclusions & Exclusions
- 1.4 Industry Classification & Applicable Codes
- 1.5 Currency, Measurement Units & Valuation Basis
- 1.6 Target Stakeholders
- 1.7 Limitations & Assumptions
Chapter 2. Executive Summary
- 2.1 U.S. Electric Toothbrush Snapshot
- 2.1.1 Market Size – Historical (2024) & Forecast (2024-2032) (2024: USD 1,177.15 million → 2032: USD 1,687.28 million)
- 2.1.2 Volume & Revenue – National Totals (Volume Where Applicable)
- 2.1.3 Key Market Highlights – Top Five Facts
- 2.2 U.S. Electric Toothbrush Segmentation Snapshot
- 2.2.1 Market Split by Subnational Area – 2024 vs. 2032
- 2.3 Competitive Snapshot
- 2.3.1 Top 10 Players by Revenue Share – 2024
- 2.3.2 Top 10 Players by Volume Share – 2024 (Volume Where Applicable)
- 2.3.3 Recent Strategic Developments (18-Month Summary)
- 2.4 Key Investment Highlights & Strategic Conclusions
Chapter 3. U.S. Electric Toothbrush Dynamics & Industry Analysis
- 3.1 Market Overview & Context
- 3.1.1 U.S. Electric Toothbrush Position in the Broader Industry Value Chain
- 3.1.2 Demand Structure & Purchasing Dynamics
- 3.1.3 Market Maturity & Development Stage Across Domestic Markets
- 3.2 U.S. Electric Toothbrush Drivers
- 3.3 U.S. Electric Toothbrush Restraints & Challenges
- 3.4 U.S. Electric Toothbrush Opportunities
- 3.5 Porter's Five Forces Analysis
- 3.5.1 Threat of New Entrants
- 3.5.2 Bargaining Power of Suppliers
- 3.5.3 Bargaining Power of Buyers
- 3.5.4 Threat of Substitutes
- 3.5.5 Competitive Rivalry – Intensity Assessment
- 3.6 U.S. Electric Toothbrush Value Chain Analysis
- 3.6.1 Upstream – Key Inputs, Resources & Suppliers
- 3.6.1.1 Key Input/Resource 1
- 3.6.1.2 Key Input/Resource 2
- 3.6.1.3 Key Input/Resource 3
- 3.6.2 Midstream – Core Operations & Value Creation
- 3.6.2.1 Operating Model & Process Overview
- 3.6.2.2 Key Operating Locations & Capabilities by Company
- 3.6.3 Downstream – Market Channels & End Users
- 3.6.3.1 Direct Sales & Customer Engagement Channels
- 3.6.3.2 Indirect Sales, Intermediaries & Partner Channels
- 3.6.4 Value Chain Profitability Analysis
- 3.6.1 Upstream – Key Inputs, Resources & Suppliers
- 3.7 PESTEL Analysis
- 3.7.1 Political Factors
- 3.7.2 Economic Factors
- 3.7.3 Social Factors
- 3.7.4 Technological Factors
- 3.7.5 Environmental Factors
- 3.7.6 Legal Factors
- 3.8 U.S. Electric Toothbrush Supply Chain Analysis
- 3.8.1 Critical Input & Resource Availability Risk Assessment
- 3.8.2 Supplier & Operational Concentration Risk (Geographic Exposure)
- 3.8.3 Supply & Service Disruption Impact Analysis
- 3.9 National & Subnational Regulatory Landscape
Note: The regulatory and policy landscape section covers regulations based on their applicability to the market, U.S. Electric Toothbrush category, geography, and scope of the study. Only regulatory frameworks with a material impact on operations, compliance, trade, sustainability, or market access are analyzed in detail.
Chapter 4. Key Investment Pockets & Opportunity Analysis
- 4.1 U.S. Electric Toothbrush Attractiveness Analysis
- 4.1.1 By Subnational Area – Investment Attractiveness Matrix (Market Size × CAGR)
- 4.2 Absolute Revenue Growth Opportunity
- 4.2.1 By Subnational Area – Absolute Revenue Growth Through 2032
- 4.3 Incremental Demand Opportunity
- 4.3.1 By Subnational Area – Incremental Demand Through 2032
- 4.3.2 Segment – Incremental Demand
- 4.4 Emerging Submarket Opportunity Deep Dive (Subject to Applicability)
- 4.5 Priority Domestic Market Opportunity Scorecards
- 4.5.1 Priority Domestic Market 1
- 4.5.2 Priority Domestic Market 2
- 4.5.3 Priority Domestic Market 3
- 4.5.4 Priority Domestic Market 4
Note: Domestic market scorecards cover relevant states, provinces, territories, cities, or economic zones within the selected country. Numbered entries are populated with market names suited to the national administrative structure and research scope. Geographic share tables use one consistent, nonoverlapping set of areas.
Chapter 5. U.S. Electric Toothbrush Cross-Border Trade & Market Access Analysis
- 5.1 National Trade & International Partner Overview
- 5.1.1 Export Value by Destination Country (2024)
- 5.1.2 Export Volume by Destination Country (2024) (Where Applicable)
- 5.1.3 Import Value by Source Country (2024)
- 5.1.4 Import Volume by Source Country (2024) (Where Applicable)
- 5.1.5 National & Partner-Country Trade Balances (2024)
- 5.2 Export Analysis – Segment
- 5.2.1 Category 1 (Applicable Classification Code)
- 5.2.2 Category 2 (Applicable Classification Code)
- 5.2.3 Category 3 (Applicable Classification Code)
- 5.2.4 Category 4 (Applicable Classification Code)
- 5.2.5 Category 5 (Applicable Classification Code)
- 5.3 Import Analysis – Segment
- 5.3.1 Category 1 (Applicable Classification Code)
- 5.3.2 Category 2 (Applicable Classification Code)
- 5.3.3 Category 3 (Applicable Classification Code)
- 5.3.4 Category 4 (Applicable Classification Code)
- 5.3.5 Category 5 (Applicable Classification Code)
- 5.4 Cross-Border Pricing & Transaction Benchmarks
- 5.4.1 Export Pricing – Segment & Destination Country
- 5.4.2 Import Pricing – Segment & Source Country
- 5.4.3 Price Trends (2024)
- 5.5 Key Cross-Border Trade & Delivery Routes
- 5.5.1 Cross-Border Trade/Delivery Route 1
- 5.5.2 Cross-Border Trade/Delivery Route 2
- 5.5.3 Cross-Border Trade/Delivery Route 3
- 5.5.4 Cross-Border Trade/Delivery Route 4
- 5.5.5 Cross-Border Trade/Delivery Route 5
- 5.6 Trade Policy & Market Access Impact Assessment
- 5.6.1 Tariff & Non-Tariff Barriers
- 5.6.2 National Participation in Regional Trade & Economic Frameworks
- 5.6.3 Bilateral & Multilateral Trade Agreements
- 5.6.4 Cross-Border Operating, Licensing & Localization Requirements
Note: This chapter covers international trade relevant to U.S. Electric Toothbrush in the selected country. Exports are analyzed by destination and imports by source. Domestic interregional flows are excluded from international trade totals. Goods, services, and digital offerings use applicable classifications; volume and route analyses apply only where meaningful.
Chapter 6. Competitive Landscape & Company Benchmarking
- 6.1 U.S. Electric Toothbrush Concentration & Structure
- 6.1.1 Herfindahl-Hirschman Index (HHI) – the historical period vs. 2024
- 6.1.2 Leading, Mid-Sized & Emerging Player Structure
- 6.1.3 Multinational, National & Local Player Dynamics
- 6.2 U.S. Electric Toothbrush Share Analysis – 2024
- 6.2.1 National Revenue Share by Company
- 6.2.2 National Volume Share by Company (Volume Where Applicable)
- 6.2.3 Company Revenue Share by Subnational Area
- 6.2.4 Market Share Evolution (the historical period vs. 2024)
- 6.2.5 Company Market Share by Key Segment
- 6.2.6 Company Market Share by Customer Group
- 6.3 Operating Scale, Capacity & Infrastructure Analysis
- 6.3.1 National Operating Scale & Supply Capacity
- 6.3.2 Resource Utilization & Operating Efficiency
- 6.3.3 Output, Service Delivery & Activity Metrics
- 6.3.4 Operating Footprint & Infrastructure Map
- 6.3.5 Planned Operational & Capacity Expansion
- 6.4 U.S. Electric Toothbrush Competitive Benchmarking Matrix
- 6.4.1 Revenue, Growth, Profitability & Operating Metric Comparison
- 6.4.2 Channel Revenue Mix
- 6.4.3 Revenue Exposure Across Domestic Markets
- 6.4.4 R&D Intensity
- 6.4.5 Sustainability Maturity
- 6.5 Strategic Developments in U.S. Electric Toothbrush (Last 24 Months)
- 6.5.1 Mergers, Acquisitions & Divestments
- 6.5.2 New Products, Services & Solutions in U.S. Electric Toothbrush
- 6.5.3 Operational & Infrastructure Expansions
- 6.5.4 Strategic Alliances, Joint Ventures & Partnerships
- 6.5.5 Distribution Expansion & Market Entry
- 6.5.6 Sustainability & ESG Initiatives
- 6.6 Competitive Strategy Mapping
- 6.6.1 Leader, Challenger, Follower & Niche Classification
- 6.6.2 Pricing Strategy Comparison
- 6.6.3 Channel Strategy Matrix
Note: Strategic developments are included based on their materiality and the availability of reliable information.
Chapter 7. U.S. Electric Toothbrush – By Sales & Delivery Channel
- 7.1 Segment Overview
- 7.1.1 Volume & Revenue Split by Channel (2024 & 2032) (Volume Where Applicable)
- 7.1.2 Channel Mix Evolution (2024-2032)
Chapter 8. Subnational Market Analysis – Country Overview
- 8.1 Domestic Geographic Market Overview
- 8.1.1 Subnational Volume Share (Where Applicable)
- 8.1.2 Subnational Revenue Share
- 8.1.3 Market Volume by Subnational Area (Where Applicable)
- 8.1.4 Market Revenue by Subnational Area
- 8.1.5 Subnational Forecasts Through 2032
- 8.2 Cross-Area Segment Analysis Within the Country
- 8.2.1 By Sales & Delivery Channel
- 8.2.2 By Competitive Positioning & Price Tier
Chapter 9. U.S. Electric Toothbrush – Priority Domestic Market 1
Chapter 10. U.S. Electric Toothbrush – Priority Domestic Market 2
Chapter 11. U.S. Electric Toothbrush – Priority Domestic Market 3
Chapter 12. U.S. Electric Toothbrush – Priority Domestic Market 4
Chapter 13. U.S. Electric Toothbrush Company Profiles
- 13.1 [Company 01]
- 13.1.1 Company Overview
- 13.1.2 Key Management Personnel
- 13.1.3 Products & Services Portfolio
- 13.1.4 Financial Performance
- 13.1.5 Domestic Market Focus & Local Operating Presence
- 13.1.6 Recent Developments & Strategic Initiatives
Note: The company profile list is preliminary and may change based on research findings, market developments, data availability, and client requirements.
Chapter 14. Appendices
- Appendix A – List of Abbreviations & Acronyms
- Appendix B – Industry Classification Code Reference – Full Series
- Appendix C – Supply, Output & Operating Capacity Data Tables
- Appendix D – End-Use & Demand Base Tables
- Appendix E – Demand, Adoption & Usage Assumptions
- Appendix F – Pricing & Revenue Metric Reference Tables
- Appendix G – Company Operations & Infrastructure Database
- Appendix H – Cross-Border Trade & Activity Data Tables (Where Applicable)
- Appendix I – Regulatory Summary Tables
- Appendix J – Primary Research Participant List (Anonymized)
- Appendix K – Primary Research Questionnaire Framework
- Appendix L – Data Sources & Bibliography
- Appendix M – Market Size Divergence & Source Comparison
Chapter 15. Research Methodology
- 15.1 Research Framework & Philosophy
- 15.2 Secondary Research – Sources, Hierarchy & Data Extraction
- 15.3 Data Modeling – National Market Sizing & Subnational Allocation
- 15.4 Primary Research – Stakeholder Framework, LOI & Sample Sizes
- 15.5 Forecast Methodology – Regression, Scenario & Sensitivity Analysis
- 15.6 Quality Control – Four-Layer Validation Framework
- 15.7 Limitations & Standard Assumptions
- 15.8 Disclaimer
