
Market Overview
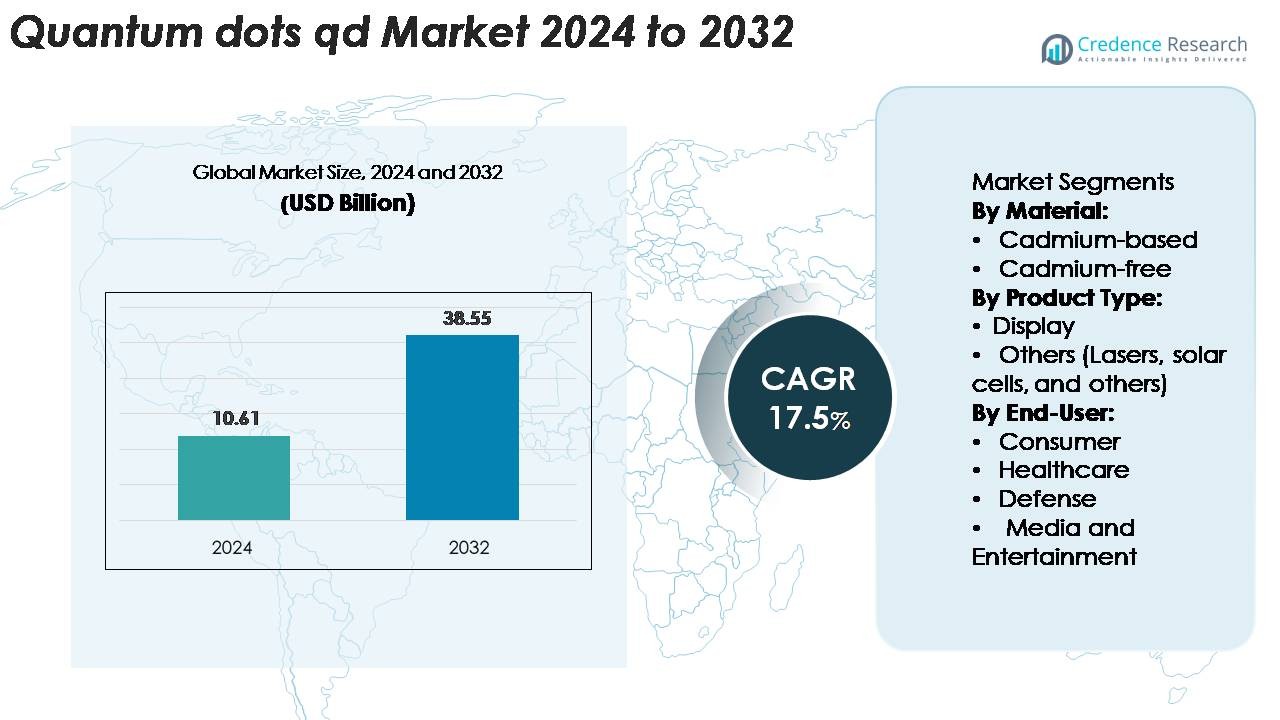
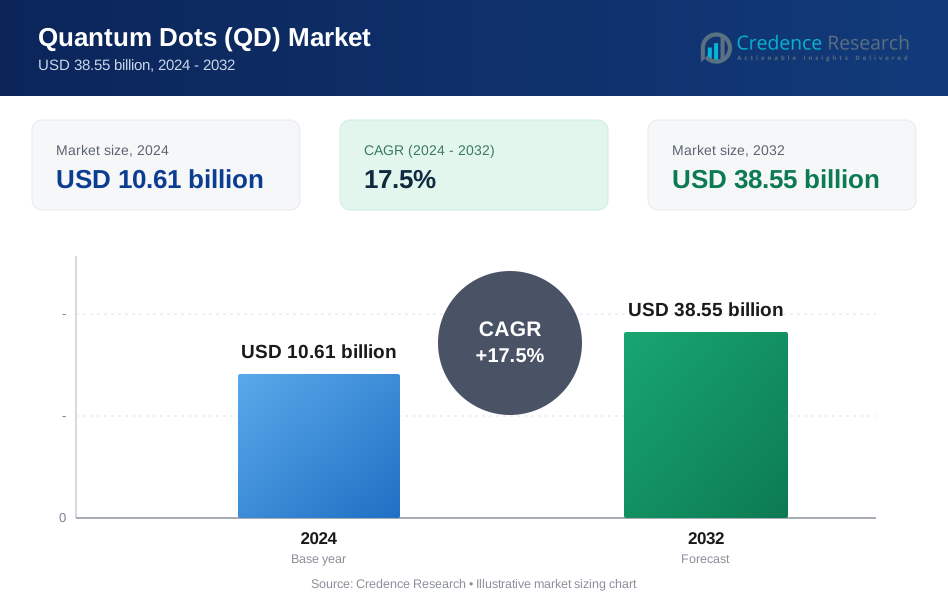
The Quantum Dots (QD) market was valued at USD 10.61 billion in 2024 and is expected to grow to USD 38.55 billion by 2032, reflecting a compound annual growth rate (CAGR) of 17.5% during the forecast period.
| REPORT ATTRIBUTE | DETAILS |
|---|---|
| Historical Period | 2020-2023 |
| Base Year | 2024 |
| Forecast Period | 2025-2032 |
| Quantum Dots (QD) market Size 2024 | USD 10.61 Billion |
| Quantum Dots (QD) market , CAGR | 17.5% |
| Quantum Dots (QD) market Size 2032 | USD 38.55 Billion |
The global quantum dots market features leading players such as Samsung Electronics Co., Ltd., Nanoco Group plc, Nanosys, Inc., and Merck KGaA, each leveraging advanced materials like cadmium‑free quantum dots and alliances to bolster their market positions. Regionally, the Asia Pacific region leads the market, capturing approximately 40.54 % share in 2024, driven by strong consumer electronics demand and large display manufacturing hubs.
Market Insights
- The Quantum Dots market was valued at USD 10.61 billion in 2024 and is expected to reach USD 38.55 billion by 2032, growing at a CAGR of 17.5% during the forecast period.
- Key growth drivers include increasing demand for high-quality displays in consumer electronics, such as televisions, smartphones, and tablets, where quantum dots enhance color accuracy and energy efficiency.
- Emerging trends include the integration of quantum dots in solar cells and LEDs, offering better energy efficiency and performance in renewable energy solutions and advanced lighting.
- The market remains competitive with major players like Samsung Display, Nanoco Group, and Nanosys, which are innovating in non-toxic, cadmium-free quantum dot solutions.
- The Asia Pacific region leads with approximately 40% market share in 2024, driven by strong manufacturing in China and Japan. North America and Europe follow with shares of 30% and 20%, respectively.
Market Segmentation Analysis:
By Material:
The Quantum Dots market is divided into cadmium-based and cadmium-free materials. The cadmium-free sub-segment holds a dominant market share due to the increasing demand for safer, environmentally friendly alternatives. As cadmium-based QDs face regulatory restrictions due to toxicity concerns, the cadmium-free segment has gained traction, particularly in consumer electronics and healthcare applications. These materials maintain the high performance of QDs while offering a non-toxic alternative, driving their adoption in industries prioritizing environmental sustainability and safety.
- For instance, Avantama AG reports that its cadmium‑free QDs achieve a photoluminescent quantum yield (PLQY) of over 99 % and can reproduce up to 93 % of visible natural colours.
By Product Type:
The market for Quantum Dots is segmented into display and other applications such as lasers, solar cells, and more. The display sub-segment leads the market with the largest share, driven by the growing demand for enhanced visual quality in consumer electronics like televisions, smartphones, and monitors. Quantum dots improve color accuracy, brightness, and energy efficiency in displays, making them highly sought after for next-generation display technologies. As consumer demand for high-quality, energy-efficient displays increases, the display segment continues to dominate market growth.
- For instance, Avantama AG reports that its cadmium‑free QDs achieve a photoluminescent quantum yield of 99 % and maintain a full width at half maximum (FWHM) of 25 nm, enabling ultra‑pure red emission at 630 nm.
By End-User:
The consumer segment dominates the Quantum Dots market, with applications in high-end displays driving its growth. The rise in demand for advanced display technology in televisions, smartphones, and other consumer electronics has made this segment the largest contributor to market share. The media and entertainment sector follows closely, benefiting from the adoption of quantum dots in screens and lighting for digital media. Additionally, healthcare applications, especially in diagnostics and imaging, are expected to drive further growth as quantum dots offer precise imaging and low toxicity, expanding their use in the medical field.
Key Growth Drivers
Increasing Demand for High-Quality Displays
The surge in demand for high-quality displays in consumer electronics is one of the primary growth drivers for the Quantum Dots (QD) market. Quantum dots enhance display performance by offering superior color accuracy, brightness, and energy efficiency, which are highly valued in applications such as televisions, smartphones, and tablets. The rise of 4K and 8K TVs, coupled with the increasing adoption of OLED and LED displays, has amplified the need for quantum dot technology to enhance visual experiences. As consumer electronics continue to evolve, the demand for displays with enhanced visual quality and energy efficiency is expected to drive the market further, positioning quantum dots as a crucial technology in next-generation display solutions.
- For instance, Samsung Display’s latest, fourth-generation QD-OLED TV panel (introduced at CES 2025) can deliver a peak brightness of over 4,000 nits in HDR mode, specifically when measuring a small window (around 3% of the screen).
Advancements in Healthcare Applications
The growing adoption of Quantum Dots in the healthcare sector is significantly driving market growth. Quantum dots offer high precision, biocompatibility, and non-toxicity, making them ideal for a range of diagnostic and imaging applications, such as in vivo imaging, targeted drug delivery, and biomarker detection. Their ability to offer better resolution and longer-lasting fluorescence in medical imaging systems has attracted interest from healthcare providers. As the demand for non-invasive, high-resolution imaging solutions increases, quantum dots are poised to revolutionize diagnostics, contributing to the market's expansion. Additionally, their potential in personalized medicine and drug delivery further enhances their growth prospects in healthcare.
- For instance, research shows that certain biocompatible near-infrared QDs (e.g., ZnCuInSe/ZnS) can have photoluminescence lifetimes of 150–300 ns with an emission peak at 800 nm, which is used in time-gated imaging to enhance deep tissue imaging clarity by separating the long QD signal from the short-lived tissue autofluorescence.
Government Regulations and Safety Concerns
Increasing government regulations on toxic materials and their impact on the environment are boosting the demand for cadmium-free Quantum Dots. As concerns regarding the environmental impact and toxicity of cadmium-based QDs rise, manufacturers are shifting toward safer alternatives. Regulatory bodies across the globe are implementing stricter standards on hazardous materials, prompting companies to invest in research and development to create cadmium-free QD solutions. These advancements not only ensure compliance with safety regulations but also appeal to environmentally conscious consumers and industries, creating a favorable market environment for cadmium-free quantum dots.
Key Trends & Opportunities
Integration with Solar Technology
One of the emerging trends in the Quantum Dots market is the integration of quantum dot technology with solar cells. Quantum dots enhance the efficiency of solar panels by improving light absorption and converting a broader spectrum of sunlight into energy. The use of QDs in next-generation solar cells offers the potential for cheaper, more efficient, and flexible solar panels. As the world transitions to renewable energy sources, quantum dot-based solar technologies present an exciting opportunity for growth. Continued innovation in this area could lead to highly efficient, cost-effective solar solutions, aligning with the growing demand for sustainable energy solutions.
- For instance, UbiQD and First Solar entered a multi‑year supply agreement in July 2025, where UbiQD’s QDs were incorporated into thin‑film bifacial modules such that the quantum conversion efficiency on the rear side more than doubles at specific wavelengths of light.
Rising Adoption of Quantum Dots in LEDs and Lasers
Another growing opportunity for quantum dots lies in their adoption in light-emitting diodes (LEDs) and lasers. Quantum dots are increasingly used in high-performance LEDs, especially in displays, lighting, and signage, to enhance color accuracy and reduce energy consumption. Additionally, QDs are being incorporated into lasers for their ability to emit coherent light at specific wavelengths with high efficiency. As industries continue to prioritize energy-efficient and high-performance lighting and laser technologies, the integration of quantum dots into these applications will fuel further market growth. Their scalability and ability to fine-tune light emission are key factors driving this trend.
- For instance, researchers demonstrated that CdSe‑based EL‑LEDs achieved external quantum efficiencies (EQE) of 19.8% for blue, 21.0% for green and 20.5% for red emission wavelengths.
Key Challenges
High Manufacturing Costs
One of the significant challenges facing the Quantum Dots market is the high cost of manufacturing. While quantum dot technology offers numerous advantages in terms of performance and efficiency, the production of quantum dots, especially cadmium-free variants, requires advanced techniques and expensive raw materials. These high manufacturing costs can limit the widespread adoption of quantum dots, particularly in cost-sensitive applications like consumer electronics and solar cells. Although there are ongoing efforts to reduce production costs through technological advancements and economies of scale, the financial barrier remains a challenge for both manufacturers and end-users, potentially hindering the rapid growth of the market.
Toxicity and Environmental Concerns with Cadmium-Based Quantum Dots
Despite the shift towards cadmium-free quantum dots, the continued use of cadmium-based quantum dots in some applications presents an ongoing challenge. Cadmium is a toxic heavy metal that poses environmental and health risks, particularly during the manufacturing, disposal, and recycling processes. As awareness of the potential dangers of cadmium-based QDs grows, regulatory pressure is increasing, leading to stricter guidelines and regulations. The need for manufacturers to invest in safer alternatives adds to production costs and complicates the market dynamics. Although cadmium-free quantum dots provide a safer solution, ensuring widespread adoption across all industries is a challenge that the market will continue to face.
Regional Analysis
Asia Pacific The Asia Pacific region held the largest share at approximately 40.5% in 2024. This dominance stems from strong manufacturing hubs in China, Japan and India, plus large scale consumer electronics demand. The region benefits from heavy investment in display panel production and quantum‑dot enhanced devices. Furthermore, government‑backed initiatives and local industry R&D underpin growth, making Asia Pacific the key driver of global quantum dot technology adoption.
North America
North America commands around 30% of the quantum dots market, supported by its robust consumer electronics and semiconductor industries. The U.S. leads in advanced display integration, nanotech R&D and premium product demand. Institutional investment and innovation ecosystems enable early adoption of quantum dot applications in electronics, healthcare imaging and energy sectors. This strong demand and infrastructure place North America as a major regional contributor to market growth.
Europe Europe holds an estimated 20% market share in the quantum dots segment, driven by regulatory emphasis on sustainability and advanced display technologies. Countries such as Germany, France and the UK are increasing efforts in nanotech funding and eco‑friendly material development. European demand is mainly fuelled by high‑end electronics, healthcare imaging applications and defence sectors seeking cadmium‑free quantum dot solutions. This combination ensures a steady growth trajectory for the region.
Latin America Latin America accounts for roughly 5% of the global quantum dots market. Growth is being driven by increasing consumer electronics penetration, digital signage adoption and rising awareness of advanced display technologies in Brazil, Mexico and Chile. While manufacturing presence is limited, importation of premium devices and partnerships with international players present expansion opportunities across the region’s developing markets.
Middle East & Africa (MEA) The Middle East & Africa region holds about 3‑4% of the global quantum dots market share, reflecting its early‑stage adoption. Growth is spurred by investments in digital infrastructure, energy‑efficient lighting and advanced display systems in Gulf states and South Africa. The region’s market remains niche but shows potential as governments promote technology diversification and imports of high‑performance devices increase.
Market Segmentations:
By Material:
- Cadmium-based
- Cadmium-free
By Product Type:
- Display
- Others (Lasers, solar cells, and others)
By End-User:
- Consumer
- Healthcare
- Defense
- Media and Entertainment
By Geography
- North America
- U.S.
- Canada
- Mexico
- Europe
- Germany
- France
- U.K.
- Italy
- Spain
- Rest of Europe
- Asia Pacific
- China
- Japan
- India
- South Korea
- South-east Asia
- Rest of Asia Pacific
- Latin America
- Brazil
- Argentina
- Rest of Latin America
- Middle East & Africa
- GCC Countries
- South Africa
- Rest of the Middle East and Africa
Competitive Landscape
The competitive landscape for the global quantum dots (QD) market features established firms and specialized innovators vying for dominance. Key players such as Samsung Electronics Co., Ltd. (Samsung Display), Nanoco Group plc, Merck KGaA and Nanosys, Inc. lead the industry through differentiated material platforms and broad licensing portfolios. These companies emphasize alliances with display manufacturers, investment into cadmium‑free QD technologies and global manufacturing scale. Competitive intensity remains high as new entrants license core technologies and OEMs seek cost efficiencies and supply chain resiliency. Regional manufacturing concentration in Asia Pacific strengthens competitive moats, while regulatory pressure on toxic materials drives innovation toward safer QDs. With display applications still capturing the bulk of market share, the ability to move into adjacent fields like solar, LEDs and imaging now defines the most agile competitors.
Key Player Analysis
- Avantama (Switzerland)
- Ocean Nanotech, LLC. (U.S.)
- QDI Systems (Netherlands)
- Samsung Electronics Co., Ltd. (Samsung Display) (South Korea)
- Nanoco Group plc (U.K.)
- Merck KGaA (Germany)
- Quantum Materials Corp. (U.S.)
- Shoei Chemical, Inc. (Nanosys) (Japan)
- UbiQD, Inc. (U.S.)
- NNCrystal US Corporation (U.S.)
Recent Developments
- In May 2025, Samsung Display announced it would showcase next‑generation electroluminescent QD (EL‑QD) prototypes — including a non‑cadmium 400‑nit EL‑QD and a 5,000 ppi RGB OLED on silicon — at the SID Display Week 2025.
- In January 2024, QDI Systems announced a Series A funding round of €5 million to scale its quantum‑dot technology for image sensors (especially for medical‑imaging applications).
- In January 2024, Avantama and additive‑manufacturing startup Scrona announced successful processing of perovskite QD ink via electrohydrodynamic (EHD) ink‑jet printing.
Report Coverage
The research report offers an in-depth analysis based on Material, Product type, End-User and Geography. It details leading market players, providing an overview of their business, product offerings, investments, revenue streams, and key applications. Additionally, the report includes insights into the competitive environment, SWOT analysis, current market trends, as well as the primary drivers and constraints. Furthermore, it discusses various factors that have driven market expansion in recent years. The report also explores market dynamics, regulatory scenarios, and technological advancements that are shaping the industry. It assesses the impact of external factors and global economic changes on market growth. Lastly, it provides strategic recommendations for new entrants and established companies to navigate the complexities of the market.
Future Outlook
- Adoption of cadmium‑free quantum dots will accelerate as regulatory and sustainability concerns intensify, boosting safer material alternatives.
- Display applications will continue to dominate, with quantum dots enhancing color quality and energy efficiency in consumer electronics and premium screens.
- Integration into solar cell and LED lighting systems will open new revenue streams as manufacturers seek high efficiency and tunable light emission.
- Expansion into healthcare imaging and biosensing will drive demand thanks to quantum dots’ brightness, stability and small size.
- Emerging micro‑LED and AR/VR display technologies will incorporate quantum dots for compact, high‑brightness, and high‑resolution solutions.
- Asia‑Pacific will maintain its leadership in manufacturing and consumption, while North America and Europe will advance adoption through premium segments.
- Supply chain investments and scale‑up of quantum dot production will reduce prices and increase accessibility across end‑user segments.
- Collaboration between material scientists and manufacturers will yield next‑generation quantum dot formulations with improved lifetime and performance.
- Challenges in uniformity, stability and blue‑emitter performance will guide innovation efforts toward more robust quantum dots.
- Growth in defence, automotive and smart lighting sectors will drive quantum dot demand beyond traditional displays.
Request a Free Sample
Fill in your details and we'll send you a free sample report.
- Sample data tables & charts
- Research methodology
Need a Custom Version of This Report?
Tailor the scope, geography, or segments to your exact requirements.
- Custom geography or segment scope
- Direct access to our analyst team
Frequently Asked Questions
What is the current market size for Quantum dots QD, and what is its projected size in 2032?
At what Compound Annual Growth Rate is the Quantum dots QD projected to grow between 2025 and 2032?
Which Quantum dots QD segment held the largest share in 2024?
What are the primary factors fueling the growth of the Quantum dots QD market?
Who are the leading companies in the Quantum dots QD market?
Which region commanded the largest share of the Quantum dots QD market in 2024?
Table of Content
Chapter 1. Report Introduction
- 1.1 Report Description & Purpose
- 1.1.1 Report Title & Market Definition
- 1.1.2 Unique Selling Propositions (USP) & Key Differentiators
- 1.1.3 Value Proposition for Stakeholders
- 1.2 Research Objectives
- 1.2.1 Market Sizing Objectives (Volume & Revenue)
- 1.2.2 Segmentation Objectives
- 1.2.3 Competitive Intelligence Objectives
- 1.2.4 Forecast & Scenario Objectives
- 1.3 Report Scope
- 1.3.1 Quantum Dots (QD) Scope – Types & Subtypes Covered
- 1.3.2 Geographic Scope – Regions & Countries Covered
- 1.3.3 Historical Period, Base Year & Forecast Period (2024; forecast to 2032)
- 1.3.4 Inclusions & Exclusions
- 1.4 HS Code & Classification Framework
- 1.5 Currency, Units & Pricing Basis
- 1.6 Target Stakeholders
- 1.7 Limitations & Assumptions
Chapter 2. Executive Summary
- 2.1 Global Quantum Dots (QD) Market Snapshot
- 2.1.1 Market Size – Historical (2024) & Forecast (2024-2032) (2024: USD 10.61 billion → 2032: USD 38.55 billion)
- 2.1.2 Volume & Revenue – Global Totals
- 2.1.3 Key Market Highlights – Top Five Facts
- 2.2 Quantum Dots (QD) Market Segmentation Snapshot
- 2.2.1 Market Split by Region – 2024 vs. 2032
- 2.3 Competitive Snapshot
- 2.3.1 Top 10 Players by Revenue Share – 2024
- 2.3.2 Top 10 Players by Volume Share – 2024
- 2.3.3 Recent Strategic Developments (18-Month Summary)
- 2.4 Key Investment Highlights & Strategic Conclusions
Chapter 3. Quantum Dots (QD) Market Dynamics & Industry Analysis
- 3.1 Market Overview & Context
- 3.1.1 Quantum Dots (QD) Market Position in the Broader Automotive Value Chain
- 3.1.2 OEM vs. Replacement Market Dynamics
- 3.1.3 Market Maturity & Development Stage by Region
- 3.2 Quantum Dots (QD) Market Drivers
- 3.3 Quantum Dots (QD) Market Restraints & Challenges
- 3.4 Quantum Dots (QD) Market Opportunities
- 3.5 Porter's Five Forces Analysis
- 3.5.1 Threat of New Entrants
- 3.5.2 Bargaining Power of Suppliers
- 3.5.3 Bargaining Power of Buyers
- 3.5.4 Threat of Substitutes
- 3.5.5 Competitive Rivalry – Intensity Assessment
- 3.6 Quantum Dots (QD) Value Chain Analysis
- 3.6.1 Upstream – Raw Material/Input Suppliers
- 3.6.1.1 Raw Material/Input 1
- 3.6.1.2 Raw Material/Input 2
- 3.6.1.3 Raw Material/Input 3
- 3.6.2 Midstream – Production/Manufacturing/Service Delivery
- 3.6.2.1 Production/Process Overview
- 3.6.2.2 Key Facility Locations & Capacity by Manufacturer
- 3.6.3 Downstream – Distribution & End Consumer
- 3.6.3.1 Primary Channel – B2B/OEM
- 3.6.3.2 Secondary Channels – Dealer, Retail, Online, Direct
- 3.6.4 Value Chain Profitability Analysis
- 3.6.1 Upstream – Raw Material/Input Suppliers
- 3.7 PESTEL Analysis
- 3.7.1 Political Factors
- 3.7.2 Economic Factors
- 3.7.3 Social Factors
- 3.7.4 Technological Factors
- 3.7.5 Environmental Factors
- 3.7.6 Legal Factors
- 3.8 Quantum Dots (QD) Supply Chain Analysis
- 3.8.1 Raw Material/Input Supply Risk Assessment
- 3.8.2 Manufacturing Concentration Risk (Geographic Exposure)
- 3.8.3 Trade Disruption Impact Analysis
- 3.9 Regulatory & Policy Landscape
Note: The regulatory and policy landscape section covers regulations based on their applicability to the market, Quantum Dots (QD) category, geography, and scope of the study. Only regulatory frameworks with a material impact on operations, compliance, trade, sustainability, or market access are analyzed in detail.
Chapter 4. Key Investment Pockets & Opportunity Analysis
- 4.1 Quantum Dots (QD) Market Attractiveness Analysis
- 4.1.1 By Region – Investment Attractiveness Matrix (Volume × CAGR)
- 4.2 Absolute Revenue Growth Opportunity
- 4.2.1 By Region – Absolute USD Growth Through 2032
- 4.3 Incremental Volume Opportunity
- 4.3.1 By Region – Incremental Volume Through 2032
- 4.3.2 Segment – Incremental Volume
- 4.4 Emerging Submarket Opportunity Deep Dive (Subject to Applicability)
- 4.5 Emerging Market Opportunity Scorecards
- 4.5.1 United States
- 4.5.2 Europe
- 4.5.3 Asia
- 4.5.4 Middle East & Africa
Note: Emerging Market Opportunity Scorecards will be included based on relevance and strategic importance. Regions listed are indicative and may vary depending on data availability and market dynamics.
Chapter 5. Quantum Dots (QD) Import-Export Analysis & Trade Flows
- 5.1 Global Trade Overview
- 5.1.1 Global Export Value by Country (2024)
- 5.1.2 Global Export Volume by Country (2024)
- 5.1.3 Global Import Value by Country (2024)
- 5.1.4 Global Import Volume by Country (2024)
- 5.1.5 Net Trade Balance by Country (2024)
- 5.2 Export Analysis – Segment
- 5.2.1 Type 1 (HS Code)
- 5.2.2 Type 2 (HS Code)
- 5.2.3 Type 3 (HS Code)
- 5.2.4 Type 4 (HS Code)
- 5.2.5 Type 5 (HS Code)
- 5.3 Import Analysis – Segment
- 5.3.1 Type 1 (HS Code)
- 5.3.2 Type 2 (HS Code)
- 5.3.3 Type 3 (HS Code)
- 5.3.4 Type 4 (HS Code)
- 5.3.5 Type 5 (HS Code)
- 5.4 Average Unit Trade Prices
- 5.4.1 Average Export Price – Segment & Country
- 5.4.2 Average Import Price – Segment & Source Country
- 5.4.3 Price Trends (2024)
- 5.5 Key Trade Route Analysis
- 5.5.1 Trade Route 1
- 5.5.2 Trade Route 2
- 5.5.3 Trade Route 3
- 5.5.4 Trade Route 4
- 5.5.5 Trade Route 5
- 5.6 Trade Policy Impact Assessment
- 5.6.1 US Anti-Dumping & Section 301 Tariffs
- 5.6.2 EU Customs Union Impact
- 5.6.3 Major Free Trade Agreements
- 5.6.4 USMCA Rules of Origin
Note: Trade policy analysis will be included only where relevant to the Quantum Dots (QD) market.
Chapter 6. Competitive Landscape & Company Benchmarking
- 6.1 Quantum Dots (QD) Market Concentration & Structure
- 6.1.1 Herfindahl-Hirschman Index (HHI) – vs. 2024
- 6.1.2 Tier 1, Tier 2 & Tier 3 Market Structure
- 6.1.3 Global, Regional & Local Player Dynamics
- 6.2 Quantum Dots (QD) Market Share Analysis – 2024
- 6.2.1 Global Revenue Share by Company
- 6.2.2 Global Volume Share by Company
- 6.2.3 Regional Revenue Share
- 6.2.4 Market Share Evolution ( vs. 2024)
- 6.2.5 OEM Segment Share by Company
- 6.2.6 Replacement Segment Share by Company
- 6.3 Production/Delivery Capacity & Facility Analysis
- 6.3.1 Global Installed Capacity
- 6.3.2 Capacity Utilization Rates
- 6.3.3 Production/Output Volume
- 6.3.4 Facility Locations & Capacity Map
- 6.3.5 Planned Capacity Additions
- 6.4 Quantum Dots (QD) Competitive Benchmarking Matrix
- 6.4.1 Revenue, Volume, CAGR & Profitability Comparison
- 6.4.2 Channel Revenue Mix
- 6.4.3 Geographic Revenue Exposure
- 6.4.4 R&D Intensity
- 6.4.5 Sustainability Maturity
- 6.5 Strategic Developments in Quantum Dots (QD) (Last 24 Months)
- 6.5.1 Mergers, Acquisitions & Divestments
- 6.5.2 New Quantum Dots (QD) Launches
- 6.5.3 Facility Expansions
- 6.5.4 Strategic Alliances, Joint Ventures & Partnerships
- 6.5.5 Distribution Expansion & Market Entry
- 6.5.6 Sustainability & ESG Initiatives
- 6.6 Competitive Strategy Mapping
- 6.6.1 Leader, Challenger, Follower & Niche Classification
- 6.6.2 Pricing Strategy Comparison
- 6.6.3 Channel Strategy Matrix
Note: Strategic developments are included based on their materiality and the availability of reliable information.
Chapter 7. Global Quantum Dots (QD) Market – By Distribution Channel
- 7.1 Segment Overview
- 7.1.1 Volume & Revenue Split by Channel (2024 & 2032)
- 7.1.2 Channel Mix Evolution (2024-2032)
Chapter 8. Regional Market Analysis – Global Overview
- 8.1 Global Regional Overview
- 8.1.1 Regional Volume Share
- 8.1.2 Regional Revenue Share
- 8.1.3 Regional Volume by Region
- 8.1.4 Regional Revenue by Region
- 8.1.5 Regional Forecast Through 2032
- 8.2 Cross-Regional Segment Analysis
- 8.2.1 By Distribution Channel
- 8.2.2 By Brand/Price Tier
Chapter 9. North America Quantum Dots (QD) Market
- 9.1 United States
- 9.2 Canada
- 9.3 Mexico
Chapter 10. Europe Quantum Dots (QD) Market
- 10.1 Germany
- 10.2 France
- 10.3 Italy
- 10.4 United Kingdom
- 10.5 Spain
- 10.6 Poland
- 10.7 Russia
- 10.8 Netherlands
- 10.9 Belgium
- 10.10 Sweden
- 10.11 Denmark
- 10.12 Norway
- 10.13 Rest of Europe
Chapter 11. Asia Pacific Quantum Dots (QD) Market
- 11.1 China
- 11.2 India
- 11.3 Japan
- 11.4 South Korea
- 11.5 Thailand
- 11.6 Indonesia
- 11.7 Vietnam
- 11.8 Malaysia
- 11.9 Australia
- 11.10 Rest of Asia Pacific
Chapter 12. Latin America Quantum Dots (QD) Market
- 12.1 Brazil
- 12.2 Argentina
- 12.3 Colombia
- 12.4 Chile
- 12.5 Rest of Latin America
Chapter 13. Middle East Quantum Dots (QD) Market
- 13.1 Saudi Arabia
- 13.2 United Arab Emirates
- 13.3 Turkey
- 13.4 Israel
- 13.5 Iran
- 13.6 Rest of the Middle East
Chapter 14. Africa Quantum Dots (QD) Market
- 14.1 South Africa
- 14.2 Egypt
- 14.3 Nigeria
- 14.4 Morocco
- 14.5 Rest of Africa
Chapter 15. Quantum Dots (QD) Company Profiles
- 15.1 [Company 01]
- 15.1.1 Company Overview
- 15.1.2 Key Management Personnel
- 15.1.3 Products & Services Portfolio
- 15.1.4 Financial Performance
- 15.1.5 Key Market Focus & Geographic Presence
- 15.1.6 Recent Developments & Strategic Initiatives
Note: The company profile list is preliminary and may change based on research findings, market developments, data availability, and client requirements.
Chapter 16. Appendices
- Appendix A – List of Abbreviations & Acronyms
- Appendix B – Industry Classification Code Reference – Full Series
- Appendix C – Production & Capacity Data Tables
- Appendix D – End-Use & Demand Base Tables
- Appendix E – Consumption & Replacement Rate Assumptions
- Appendix F – ASP Reference Tables
- Appendix G – Manufacturing & Facility Database
- Appendix H – Import-Export Data Tables
- Appendix I – Regulatory Summary Tables
- Appendix J – Primary Research Participant List (Anonymized)
- Appendix K – Primary Research Questionnaire Framework
- Appendix L – Data Sources & Bibliography
- Appendix M – Market Size Divergence & Source Comparison
Chapter 17. Research Methodology
- 17.1 Research Framework & Philosophy
- 17.2 Secondary Research – Sources, Hierarchy & Data Extraction
- 17.3 Data Modeling – Bottom-Up & Top-Down Market Sizing
- 17.4 Primary Research – Stakeholder Framework, LOI & Sample Sizes
- 17.5 Forecast Methodology – Regression, Scenario & Sensitivity Analysis
- 17.6 Quality Control – Four-Layer Validation Framework
- 17.7 Limitations & Standard Assumptions
- 17.8 Disclaimer
