
Market Overview
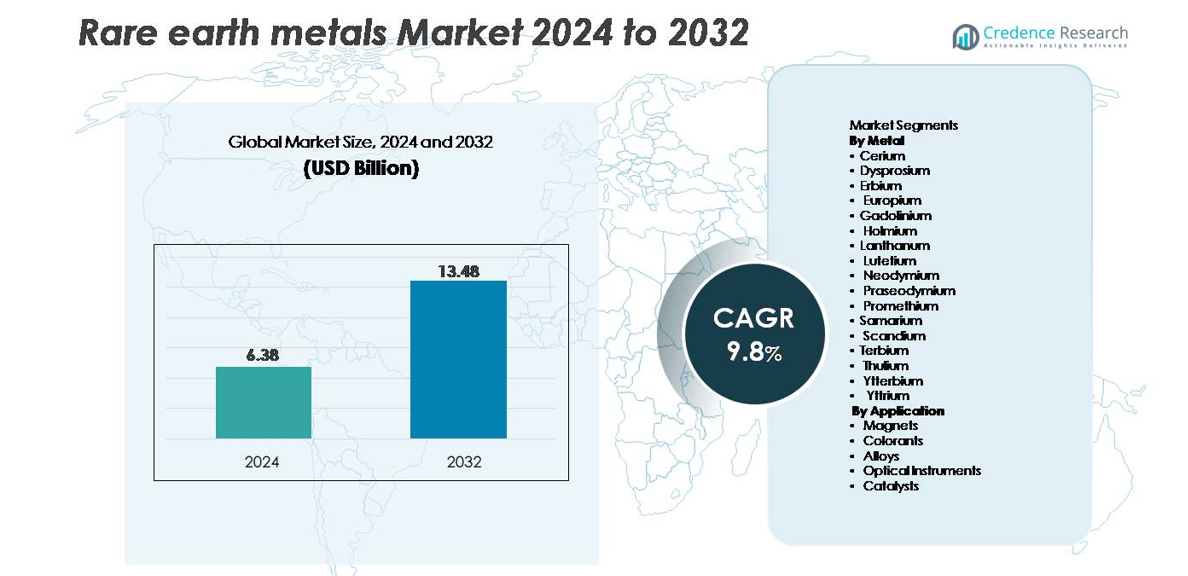
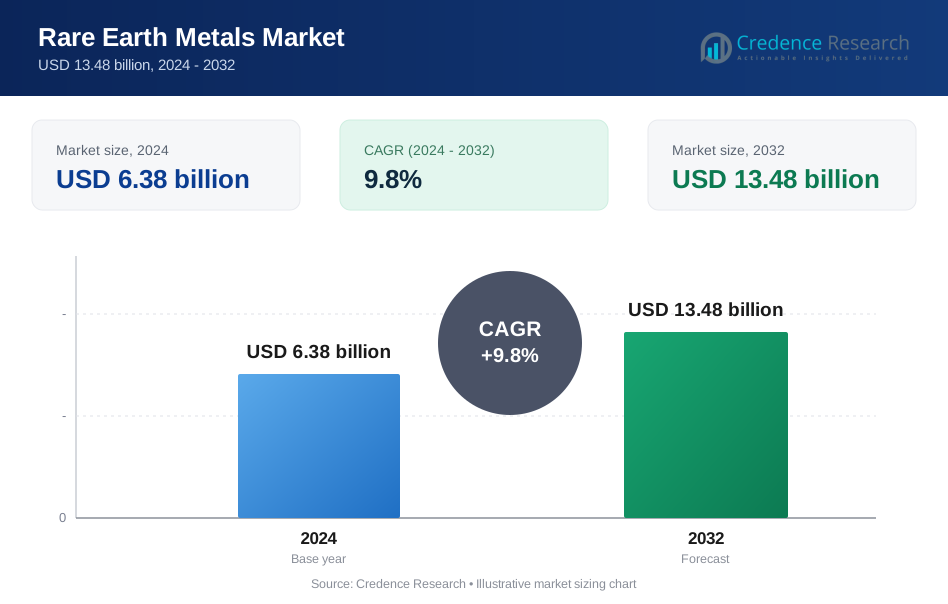
The global rare earth metals market was valued at USD 6.38 billion in 2024 and is projected to reach USD 13.48 billion by 2032, expanding at a CAGR of 9.8% during the forecast period.
| REPORT ATTRIBUTE | DETAILS |
|---|---|
| Historical Period | 2020-2023 |
| Base Year | 2024 |
| Forecast Period | 2025-2032 |
| Rare Earth Metals Market Size 2024 | USD 6.38 billion |
| Rare Earth Metals Market, CAGR | 9.8% |
| Rare Earth Metals Market Size 2032 | USD 13.48 billion |
The rare earth metals market is shaped by a mix of globally integrated producers and emerging mining specialists. Leading players such as Lynas Corporation Ltd., China Minmetals Rare Earth Co., Baotou Jinmeng Rare Earth Co., Iluka Resources Limited, Arafura Resources Ltd., Northern Minerals Limited, Alkane Resources Ltd., Greenland Minerals and Energy Ltd., Indian Rare Earths Limited, and Canada Rare Earth Corporation drive industry development through expanded mining capacity, refining technology, and magnet-materials processing. Asia-Pacific dominates the market with over 70% share, owing to China’s extensive refining infrastructure and downstream magnet manufacturing base. North America and Europe accelerate strategic projects to reduce import dependence, while Australia strengthens its position as a key non-China supplier.
Market Insights
- The global rare earth metals market was valued at USD 6.38 billion in 2024 and is projected to reach USD 13.48 billion by 2032, registering a CAGR of 9.8% during the forecast period.
- Demand continues to rise due to strong consumption in NdFeB magnets, which hold the largest segment share, driven by EV motors, wind turbines, and industrial automation. Expanding use in catalysts, aerospace alloys, and photonic materials further strengthens overall market growth.
- Key trends include rapid adoption of recycling and urban mining, advanced separation technologies, and rising investments in non-China refining hubs to improve supply-chain resilience.
- Competition intensifies as players such as Lynas, China Minmetals, Baotou Jinmeng, Iluka, Arafura, and Northern Minerals expand mining capacity and downstream processing; however, environmental regulations, high capital costs, and supply concentration remain major restraints.
- Asia-Pacific accounts for over 70% of global share, followed by North America at 14% and Europe at 12%, reflecting strong downstream magnet manufacturing and growing regional diversification efforts.
Market Segmentation Analysis:
By Metal
Neodymium remains the dominant metal segment, capturing the largest share due to its critical role in manufacturing high-performance NdFeB permanent magnets used in EV traction motors, industrial automation systems, and direct-drive wind turbines. The rising deployment of electric powertrains and high-efficiency generators strengthens demand for neodymium and its co-dependencies with praseodymium and dysprosium, which enhance thermal stability. Lanthanum and cerium maintain steady consumption in catalysts and polishing powders, while scandium gains traction in aerospace-grade alloys. Heavy rare earths such as terbium and ytterbium expand gradually, driven by advanced imaging, photonics, and magnetic-cooling research.
- For instance, Hitachi Metals’ NdFeB magnet lines utilize neodymium-blended alloys achieving coercivity levels above 1,200 kA/m, while Airbus has tested scandium-aluminum alloys containing up to 0.4% scandium to improve tensile strength by more than 50% in aerospace components.
By Application
Magnets represent the leading application segment, accounting for the highest market share as NdFeB and SmCo magnets remain indispensable for EV motors, robotics, wind turbine generators, and high-density electronics. Their superior magnetic strength, lightweight structure, and high coercivity drive consistent adoption in next-generation mobility and renewable energy systems. Catalysts follow as a major segment, supported by lanthanum- and cerium-based formulations used in petroleum refining and emissions control. Alloys show rising demand from aerospace and additive manufacturing, while optical instruments and colorants maintain niche but growing usage across lasers, phosphors, and display technologies.
- For instance, Tesla’s permanent-magnet motors rely on NdFeB magnets delivering energy products above 52 MGOe, while GE Vernova’s 12-MW Haliade-X offshore turbine uses magnet assemblies containing more than 600 kg of rare-earth magnet materials per nacelle.
KEY GROWTH DRIVERS:
Expanding Demand from Electric Vehicles and High-Performance Magnets
The accelerating adoption of electric vehicles (EVs), hybrid powertrains, and high-efficiency industrial motors remains the strongest growth driver for the rare earth metals market. Neodymium, praseodymium, dysprosium, and terbium are essential for producing NdFeB permanent magnets, which deliver superior magnetic strength and durability required for traction motors, robotics, and automation systems. As global EV sales surpass tens of millions of units annually, OEMs increase long-term procurement of magnet-grade rare earths to stabilize supply. Wind energy installations further amplify demand, particularly direct-drive turbines that heavily rely on neodymium-enriched magnets for improved torque density and reduced maintenance. Consumer electronics, including smartphones, wearables, and data-center cooling technologies, also require high-precision magnets, driving continuous consumption across multiple sectors. Government mandates supporting electrification, renewable energy expansion, and energy-efficient systems reinforce structural demand growth. Together, these trends solidify high-performance magnet materials as the primary catalyst for long-term rare earth metal consumption.
- For instance, Toyota's latest e-Axle motors use advanced neodymium-reducedNdFeB magnets that achieve typical energy products in the 30-40 MGOe range for commercial automotive use, while Vestas' 15-MW offshore turbine platforms incorporate hundreds of kilograms (potentially over 800 kg in some designs) of rare-earth magnet material per unit to sustain high-torque, low-maintenance operation."
Rising Use of Rare Earths in Catalysts, Alloys, and Advanced Material Systems
Rare earth metals experience significant demand growth in refining catalysts, aerospace alloys, optical systems, and defense technologies, forming a diversified driver base beyond magnets. Cerium and lanthanum remain indispensable for fluid catalytic cracking (FCC) in petroleum refining, supporting cleaner fuel production and emissions control regulations worldwide. Meanwhile, scandium-aluminum alloys enable exceptional strength-to-weight performance for aerospace structures, additive manufacturing, and next-generation mobility platforms. Europium, terbium, and yttrium maintain relevance in phosphors for high-efficiency displays, lasers, and sensor systems used in medical imaging, defense optics, and industrial metrology. As materials science advances, emerging applications such as magnetic refrigeration, solid-state batteries, and quantum communication technologies further expand the addressable market for select rare earth elements. These factors collectively strengthen demand for diversified rare earth-based materials aligned with high-precision, lightweight, and energy-efficient engineering requirements across multiple industries.
- For instance, Rio Tinto’s scandium-aluminum alloy pilot line produces alloy billets containing 0.4–0.6% scandium, increasing yield strength by over 150 MPa, while UOP’s FCC catalyst formulations incorporate cerium oxide levels up to 3 wt% to enhance catalytic activity.
Strategic Government Policies Supporting Supply Chain Security and Regional Mining
Global governments increasingly prioritize rare earth metals as strategic resources due to their indispensable role in defense systems, renewable energy, and advanced electronics. This recognition drives national policies supporting diversified mining, refining, and magnet manufacturing outside traditional supply-dominant regions. The United States, European Union, Japan, Australia, and India have launched incentive programs, tax credits, and public-private partnerships to establish reliable supply chains and reduce import dependence. Investments target new mining operations, separation plants, recycling systems, and end-use manufacturing hubs such as magnet facilities and battery precursor plants. These initiatives help stabilize market availability while fostering technological independence for critical sectors. Defense agencies also integrate rare earth stockpiling strategies to secure uninterrupted supply for missile guidance, radar components, and high-precision sensors. As geopolitical pressures intensify, government-backed supply chain resilience becomes a powerful structural growth driver for the global rare earth metals market.
KEY TRENDS & OPPORTUNITIES:
Expansion of Recycling, Urban Mining, and Circular Magnet Recovery Systems
A major opportunity emerges from large-scale recycling of rare earths from end-of-life electronics, wind turbines, motors, and industrial equipment. Traditional mining faces limitations such as environmental impact, complex ore processing, and long commissioning timelines, making recycled rare earths an increasingly attractive alternative. Advanced hydrometallurgical and solvent-extraction technologies enable selective recovery of neodymium, dysprosium, and terbium from NdFeB magnets with improving purity and efficiency. Urban mining programs across Europe, North America, and East Asia expand collection frameworks for small electronic devices, helping capture significant quantities of magnet materials previously discarded. Companies are also commercializing closed-loop magnet-to-magnet recycling systems that reduce energy intensity and bypass early-stage ore processing steps. As sustainability regulations tighten and manufacturers seek low-carbon raw materials, recycling becomes a major long-term growth opportunity and a stabilizing factor for rare earth supply.
- For instance, Hitachi's rare-earth recycling pilot program in the early 2010s demonstrated technology capable of processing approximately 100 HDD units per hourwith machinery, achieving high neodymium recovery rates from the extracted magnets.
Technological Innovations in Magnet Manufacturing, Separation Chemistry, and Alloy Engineering
Advances in magnet fabrication, separation chemistry, and material engineering create substantial opportunities for specialized rare earth applications. Grain-boundary diffusion technologies reduce dysprosium usage while improving magnet performance at high operating temperatures, enabling cost-effective scaling for EVs and industrial motors. Breakthroughs in solvent extraction, membrane filtration, and ion-exchange systems enhance the efficiency and environmental footprint of refining processes, addressing historical constraints around waste management and chemical intensity. In alloys, scandium integration in aluminum matrices accelerates aerospace adoption thanks to improved tensile strength, weldability, and fatigue resistance. Innovations in photonic materials, luminescent films, and laser crystals open new demand for erbium, ytterbium, europium, and terbium across optical sensing, fiber amplifiers, and precision instrumentation. These technological advancements drive premium-grade rare earth consumption and unlock high-value engineering applications.
- For instance, Shin-Etsu Chemical’s diffusion-treated NdFeB magnets cut dysprosium consumption by nearly 50% while sustaining operational temperatures above 200°C, and Neo Performance Materials’ solvent-extraction circuits process over 14,000 tonnes of rare-earth feedstock annually.
Growth of Defense, Space, and Quantum Technologies Driving Strategic Material Demand
Defense, aerospace, and quantum technology ecosystems continue to generate high-value opportunities for rare earth metals due to their exceptional magnetic, optical, and thermal characteristics. Permanent magnets support missile actuators, aircraft control systems, radar platforms, and guidance components requiring extreme reliability. Rare earth-doped crystals such as ytterbium, erbium, and holmium enable high-power lasers, night-vision optics, and advanced sensor arrays. In the space sector, lightweight rare earth alloys strengthen satellite structures and propulsion components designed for extreme-temperature environments. Emerging quantum communication and computing technologies rely on rare earth-ion dopants for ultra-stable optical transitions and secure information processing. As defense modernization and space exploration intensify globally, demand for high-purity rare earth materials in mission-critical applications grows steadily, presenting substantial long-term market opportunities.
KEY CHALLENGES:
Supply Concentration, Geopolitical Risks, and Limited Refining Capacity
The rare earth metals market faces a major challenge stemming from extreme supply concentration in mining, separation, and processing stages. A single region dominates global refining capacity, creating vulnerabilities for importing countries and industries reliant on magnet-grade oxides and metals. Geopolitical tensions, trade restrictions, or export policy changes can disrupt downstream manufacturing, particularly in EV motors, wind turbine components, and defense technologies. Developing alternative refining hubs requires significant capital expenditure, complex environmental approvals, and long lead times, limiting short-term diversification. These constraints create price volatility, supply insecurity, and long-term risk for industries dependent on stable rare earth availability.
Environmental, Regulatory, and Waste-Management Constraints in Mining and Processing
Rare earth extraction and separation remain environmentally intensive, involving radioactive by-products, high chemical consumption, and complex waste-management requirements. Stricter environmental regulations across multiple regions increase compliance costs, delay project timelines, and limit the feasibility of new mining operations. Communities and regulators demand improved sustainability practices, including wastewater treatment, emissions control, tailings management, and land-restoration commitments. Although modern technologies reduce environmental impact, large-scale implementation remains challenging. These issues constrain the pace of capacity expansion for mining and refining, restricting global supply flexibility. As demand accelerates, environmental constraints pose a significant barrier to achieving balanced rare earth supply chains.
Regional Analysis
Asia-Pacific (APAC)
Asia-Pacific dominates the rare earth metals market, accounting for over 70% of global share, driven by China’s overwhelming leadership in mining, separation, and magnet manufacturing. China controls the majority of global refining capacity and maintains strong domestic demand from its EV, wind energy, consumer electronics, and industrial sectors. Japan and South Korea contribute significantly through high-value magnet production and advanced materials engineering. Growing investments in India and Australia further strengthen the regional supply base. Government policies supporting supply independence, expanded mining licenses, and downstream processing projects keep APAC firmly positioned as the global hub for rare earth production and consumption.
North America
North America holds approximately 14% of the global market, supported by strategic government initiatives to rebuild domestic mining and separation capabilities. The United States leads regional growth with investments in neodymium–praseodymium processing, magnet manufacturing, and defense-grade material supply. Policy frameworks such as the Defense Production Act and clean-energy incentives accelerate demand across EV motors, wind turbines, and high-performance electronics. Collaboration between mining companies, magnet producers, and technology developers strengthens regional supply-chain resilience. Increasing adoption of advanced aerospace alloys and rare earth–dependent defense systems further boosts consumption, positioning North America as a rapidly expanding demand center despite limited refining capacity.
Europe
Europe represents roughly 12% of global market share, supported by strong demand from renewable energy, electric mobility, and industrial automation sectors. Countries such as Germany, France, and the UK drive consumption through expanding EV production and offshore wind installations requiring high-strength NdFeB magnets. The EU’s Critical Raw Materials Act encourages diversified sourcing, recycling infrastructure, and localized magnet production to reduce import dependency. Advanced research in photonics, catalysts, and aerospace alloys strengthens specialty rare earth usage across high-tech industries. Despite limited upstream capacity, Europe’s emphasis on sustainability, circularity, and strategic autonomy fuels steady growth in rare earth consumption.
Latin America
Latin America accounts for 4% of the global market, with demand primarily driven by industrial processing, automotive components, and emerging renewable energy investments. Brazil and Argentina lead regional activity, leveraging growing EV adoption, refinery catalyst demand, and the expansion of local electronics assembly. Geological surveys in Brazil and Chile increasingly highlight promising rare earth deposits, attracting international exploration interest. However, limited refining capacity, regulatory delays, and infrastructure constraints restrict domestic processing scale. As regional governments promote mineral development and clean-energy transitions, Latin America is gradually strengthening its role within global rare earth value chains.
Middle East & Africa (MEA)
MEA holds an estimated 4% market share, supported by rising exploration activities and strategic interest in rare earth resources. African nations-including South Africa, Madagascar, and Tanzania-possess substantial untapped deposits, drawing investment for upstream development. Demand across the Middle East increases steadily due to diversification strategies in aerospace, clean-energy technologies, and high-efficiency industrial systems. However, the region faces challenges in establishing large-scale refining capacity and downstream manufacturing. Government-backed initiatives and partnerships with global mining firms continue to improve project feasibility. MEA’s long-term growth potential remains strong as countries aim to integrate more deeply into the rare earth supply chain.
Market Segmentations:
By Metal
- Cerium
- Dysprosium
- Erbium
- Europium
- Gadolinium
- Holmium
- Lanthanum
- Lutetium
- Neodymium
- Praseodymium
- Promethium
- Samarium
- Scandium
- Terbium
- Thulium
- Ytterbium
- Yttrium
By Application
- Magnets
- Colorants
- Alloys
- Optical Instruments
- Catalysts
By Geography
- North America
- U.S.
- Canada
- Mexico
- Europe
- Germany
- France
- U.K.
- Italy
- Spain
- Rest of Europe
- Asia Pacific
- China
- Japan
- India
- South Korea
- South-east Asia
- Rest of Asia Pacific
- Latin America
- Brazil
- Argentina
- Rest of Latin America
- Middle East & Africa
- GCC Countries
- South Africa
- Rest of the Middle East and Africa
Competitive Landscape:
The competitive landscape of the rare earth metals market is characterized by strong dominance of vertically integrated producers, expanding global mining initiatives, and rising investments in downstream magnet manufacturing. China remains the center of competition through leading companies that control mining, separation, oxide refining, and NdFeB magnet production, allowing cost efficiency and secure supply. International players in Australia, the United States, and Canada continue advancing new mining and processing projects to diversify global sources. Companies increasingly focus on high-purity oxides, recycled magnet materials, and specialty alloys to capture value in EV motors, wind turbines, and defense technologies. Strategic partnerships between miners, magnet manufacturers, and automotive OEMs strengthen supply-chain resilience, while governments accelerate funding and regulatory support for domestic processing hubs. As technology evolves, competition intensifies around high-performance magnets, advanced separation chemistry, and environmentally responsible refining practices, positioning innovation and supply security as the core competitive differentiators in the market.
Key Player Analysis:
- Lynas Corporation Ltd.
- Baotou Jinmeng Rare Earth Co.
- Iluka Resources Limited
- Northern Minerals Limited
- Arafura Resources Ltd
- China Minmetals Rare Earth Co., Ltd
- Greenland Minerals and Energy Ltd
- Alkane Resources Ltd
- Indian Rare Earths Limited
- Canada Rare Earth Corporation
Recent Developments:
- In October 2025, Lynas announced a A$180 million investment to build a dedicated heavy rare-earth separation facility in Malaysia to process ~5,000 tpa of heavy-rare-earth feedstock, aiming to reduce reliance on Chinese refining infrastructure.
- In October 2025, Northern Minerals raised A$60.5 million to advance its Browns Range heavy rare-earth project.
- In August 2025, Arafura had previously completed a capital raise (~A$70.2 million in the first tranche) to support its flagship Nolans Rare Earths Project, a critical step toward final investment decision.
Report Coverage:
The research report offers an in-depth analysis based on Metal, Application and Geography. It details leading market players, providing an overview of their business, product offerings, investments, revenue streams, and key applications. Additionally, the report includes insights into the competitive environment, SWOT analysis, current market trends, as well as the primary drivers and constraints. Furthermore, it discusses various factors that have driven market expansion in recent years. The report also explores market dynamics, regulatory scenarios, and technological advancements that are shaping the industry. It assesses the impact of external factors and global economic changes on market growth. Lastly, it provides strategic recommendations for new entrants and established companies to navigate the complexities of the market.
Future Outlook:
- Global demand for NdFeB magnets will continue rising as EV adoption, robotics, and wind energy installations accelerate worldwide.
- Governments will expand strategic policies to build domestic mining, refining, and magnet manufacturing capabilities.
- Recycling and urban mining will become a major secondary supply source, reducing dependency on primary extraction.
- New refining technologies will improve efficiency, lower environmental impact, and enhance high-purity oxide production.
- Aerospace, defense, and space technologies will increase consumption of heavy rare earths for precision optics and high-performance alloys.
- Supply-chain diversification outside China will intensify through new projects in Australia, the United States, Canada, and Africa.
- Magnet-to-magnet recycling systems will scale up, enabling circular production for EV motors and industrial equipment.
- Quantum technologies and advanced photonics will expand specialty demand for elements such as erbium, ytterbium, and europium.
- Long-term contracts between OEMs and miners will become common to secure material availability.
- Sustainability, traceability, and low-carbon processing will emerge as core competitive differentiators for global suppliers.
Request a Free Sample
Fill in your details and we'll send you a free sample report.
- Sample data tables & charts
- Research methodology
Need a Custom Version of This Report?
Tailor the scope, geography, or segments to your exact requirements.
- Custom geography or segment scope
- Direct access to our analyst team
Frequently Asked Questions
What is the current market size for rare earth metals, and what is its projected size in 2032?
At what Compound Annual Growth Rate is the rare earth metals market expected to grow between 2024 and 2032?
Name few prominent players in the global industry.
Which is the fastest growing Application segment for the global industry?
Who are the leading companies in the rare earth metals market?
Table of Content
Chapter 1. Report Introduction
- 1.1 Report Description & Purpose
- 1.1.1 Report Title & Market Definition
- 1.1.2 Unique Selling Propositions (USP) & Key Differentiators
- 1.1.3 Value Proposition for Stakeholders
- 1.2 Research Objectives
- 1.2.1 Market Sizing Objectives (Volume & Revenue) (Volume Where Applicable)
- 1.2.2 Segmentation Objectives
- 1.2.3 Competitive Intelligence Objectives
- 1.2.4 Forecast & Scenario Objectives
- 1.3 Report Scope
- 1.3.1 Rare Earth Metals Scope – Segments & Subsegments Covered
- 1.3.2 Geographic Scope – Regions & Countries Covered
- 1.3.3 Historical Period, Base Year & Forecast Period (2024; forecast to 2032)
- 1.3.4 Inclusions & Exclusions
- 1.4 Industry Classification & Applicable Codes
- 1.5 Currency, Measurement Units & Valuation Basis
- 1.6 Target Stakeholders
- 1.7 Limitations & Assumptions
Chapter 2. Executive Summary
- 2.1 Global Rare Earth Metals Market Snapshot
- 2.1.1 Market Size – Historical (2024) & Forecast (2024-2032) (2024: USD 6.38 billion → 2032: USD 13.48 billion)
- 2.1.2 Volume & Revenue – Global Totals (Volume Where Applicable)
- 2.1.3 Key Market Highlights – Top Five Facts
- 2.2 Rare Earth Metals Market Segmentation Snapshot
- 2.2.1 Market Split by Region – 2024 vs. 2032
- 2.3 Competitive Snapshot
- 2.3.1 Top 10 Players by Revenue Share – 2024
- 2.3.2 Top 10 Players by Volume Share – 2024 (Volume Where Applicable)
- 2.3.3 Recent Strategic Developments (18-Month Summary)
- 2.4 Key Investment Highlights & Strategic Conclusions
Chapter 3. Rare Earth Metals Market Dynamics & Industry Analysis
- 3.1 Market Overview & Context
- 3.1.1 Rare Earth Metals Market Position in the Broader Industry Value Chain
- 3.1.2 Demand Structure & Purchasing Dynamics
- 3.1.3 Market Maturity & Development Stage by Region
- 3.2 Rare Earth Metals Market Drivers
- 3.3 Rare Earth Metals Market Restraints & Challenges
- 3.4 Rare Earth Metals Market Opportunities
- 3.5 Porter's Five Forces Analysis
- 3.5.1 Threat of New Entrants
- 3.5.2 Bargaining Power of Suppliers
- 3.5.3 Bargaining Power of Buyers
- 3.5.4 Threat of Substitutes
- 3.5.5 Competitive Rivalry – Intensity Assessment
- 3.6 Rare Earth Metals Value Chain Analysis
- 3.6.1 Upstream – Key Inputs, Resources & Suppliers
- 3.6.1.1 Key Input/Resource 1
- 3.6.1.2 Key Input/Resource 2
- 3.6.1.3 Key Input/Resource 3
- 3.6.2 Midstream – Core Operations & Value Creation
- 3.6.2.1 Operating Model & Process Overview
- 3.6.2.2 Key Operating Locations & Capabilities by Company
- 3.6.3 Downstream – Market Channels & End Users
- 3.6.3.1 Direct Sales & Customer Engagement Channels
- 3.6.3.2 Indirect Sales, Intermediaries & Partner Channels
- 3.6.4 Value Chain Profitability Analysis
- 3.6.1 Upstream – Key Inputs, Resources & Suppliers
- 3.7 PESTEL Analysis
- 3.7.1 Political Factors
- 3.7.2 Economic Factors
- 3.7.3 Social Factors
- 3.7.4 Technological Factors
- 3.7.5 Environmental Factors
- 3.7.6 Legal Factors
- 3.8 Rare Earth Metals Supply Chain Analysis
- 3.8.1 Critical Input & Resource Availability Risk Assessment
- 3.8.2 Supplier & Operational Concentration Risk (Geographic Exposure)
- 3.8.3 Supply & Service Disruption Impact Analysis
- 3.9 Regulatory & Policy Landscape
Note: The regulatory and policy landscape section covers regulations based on their applicability to the market, Rare Earth Metals category, geography, and scope of the study. Only regulatory frameworks with a material impact on operations, compliance, trade, sustainability, or market access are analyzed in detail.
Chapter 4. Key Investment Pockets & Opportunity Analysis
- 4.1 Rare Earth Metals Market Attractiveness Analysis
- 4.1.1 By Region – Investment Attractiveness Matrix (Market Size × CAGR)
- 4.2 Absolute Revenue Growth Opportunity
- 4.2.1 By Region – Absolute Revenue Growth Through 2032
- 4.3 Incremental Demand Opportunity
- 4.3.1 By Region – Incremental Demand Through 2032
- 4.3.2 Segment – Incremental Demand
- 4.4 Emerging Submarket Opportunity Deep Dive (Subject to Applicability)
- 4.5 Priority Market Opportunity Scorecards
- 4.5.1 United States
- 4.5.2 Europe
- 4.5.3 Asia
- 4.5.4 Middle East & Africa
Note: Priority market opportunity scorecards reflect the geographic scope and strategic relevance of the study. Listed markets are indicative and may be adapted to the industry.
Chapter 5. Rare Earth Metals Cross-Border Trade & Market Access Analysis
- 5.1 International Trade & Cross-Border Activity Overview
- 5.1.1 Global Export Value by Country (2024)
- 5.1.2 Global Export Volume by Country (2024) (Volume Where Applicable)
- 5.1.3 Global Import Value by Country (2024)
- 5.1.4 Global Import Volume by Country (2024) (Volume Where Applicable)
- 5.1.5 Net Trade Balance by Country (2024)
- 5.2 Export Analysis – Segment
- 5.2.1 Category 1 (Applicable Classification Code)
- 5.2.2 Category 2 (Applicable Classification Code)
- 5.2.3 Category 3 (Applicable Classification Code)
- 5.2.4 Category 4 (Applicable Classification Code)
- 5.2.5 Category 5 (Applicable Classification Code)
- 5.3 Import Analysis – Segment
- 5.3.1 Category 1 (Applicable Classification Code)
- 5.3.2 Category 2 (Applicable Classification Code)
- 5.3.3 Category 3 (Applicable Classification Code)
- 5.3.4 Category 4 (Applicable Classification Code)
- 5.3.5 Category 5 (Applicable Classification Code)
- 5.4 Cross-Border Pricing & Transaction Benchmarks
- 5.4.1 Export Pricing – Segment & Country
- 5.4.2 Import Pricing – Segment & Source Country
- 5.4.3 Price Trends (2024)
- 5.5 Key Cross-Border Trade & Delivery Routes
- 5.5.1 Cross-Border Trade/Delivery Route 1
- 5.5.2 Cross-Border Trade/Delivery Route 2
- 5.5.3 Cross-Border Trade/Delivery Route 3
- 5.5.4 Cross-Border Trade/Delivery Route 4
- 5.5.5 Cross-Border Trade/Delivery Route 5
- 5.6 Trade Policy & Market Access Impact Assessment
- 5.6.1 Tariff & Non-Tariff Barriers
- 5.6.2 Regional Trade & Economic Integration Frameworks
- 5.6.3 Bilateral & Multilateral Trade Agreements
- 5.6.4 Cross-Border Operating, Licensing & Localization Requirements
Note: This chapter applies where cross-border trade or delivery is relevant to Rare Earth Metals. Goods, services, and digital offerings are assessed using applicable classifications and transaction measures. Import-export volumes, trade balances, and route analyses are included only where meaningful to the market.
Chapter 6. Competitive Landscape & Company Benchmarking
- 6.1 Rare Earth Metals Market Concentration & Structure
- 6.1.1 Herfindahl-Hirschman Index (HHI) – vs. 2024
- 6.1.2 Leading, Mid-Sized & Emerging Player Structure
- 6.1.3 Global, Regional & Local Player Dynamics
- 6.2 Rare Earth Metals Market Share Analysis – 2024
- 6.2.1 Global Revenue Share by Company
- 6.2.2 Global Volume Share by Company (Volume Where Applicable)
- 6.2.3 Regional Revenue Share
- 6.2.4 Market Share Evolution ( vs. 2024)
- 6.2.5 Company Market Share by Key Segment
- 6.2.6 Company Market Share by Customer Group
- 6.3 Operating Scale, Capacity & Infrastructure Analysis
- 6.3.1 Global Operating Scale & Supply Capacity
- 6.3.2 Resource Utilization & Operating Efficiency
- 6.3.3 Output, Service Delivery & Activity Metrics
- 6.3.4 Operating Footprint & Infrastructure Map
- 6.3.5 Planned Operational & Capacity Expansion
- 6.4 Rare Earth Metals Competitive Benchmarking Matrix
- 6.4.1 Revenue, Growth, Profitability & Operating Metric Comparison
- 6.4.2 Channel Revenue Mix
- 6.4.3 Geographic Revenue Exposure
- 6.4.4 R&D Intensity
- 6.4.5 Sustainability Maturity
- 6.5 Strategic Developments in Rare Earth Metals (Last 24 Months)
- 6.5.1 Mergers, Acquisitions & Divestments
- 6.5.2 New Products, Services & Solutions in Rare Earth Metals
- 6.5.3 Operational & Infrastructure Expansions
- 6.5.4 Strategic Alliances, Joint Ventures & Partnerships
- 6.5.5 Distribution Expansion & Market Entry
- 6.5.6 Sustainability & ESG Initiatives
- 6.6 Competitive Strategy Mapping
- 6.6.1 Leader, Challenger, Follower & Niche Classification
- 6.6.2 Pricing Strategy Comparison
- 6.6.3 Channel Strategy Matrix
Note: Strategic developments are included based on their materiality and the availability of reliable information.
Chapter 7. Global Rare Earth Metals Market – By Sales & Delivery Channel
- 7.1 Segment Overview
- 7.1.1 Volume & Revenue Split by Channel (2024 & 2032) (Volume Where Applicable)
- 7.1.2 Channel Mix Evolution (2024-2032)
Chapter 8. Regional Market Analysis – Global Overview
- 8.1 Global Regional Overview
- 8.1.1 Regional Volume Share (Volume Where Applicable)
- 8.1.2 Regional Revenue Share
- 8.1.3 Regional Volume by Region (Volume Where Applicable)
- 8.1.4 Regional Revenue by Region
- 8.1.5 Regional Forecast Through 2032
- 8.2 Cross-Regional Segment Analysis
- 8.2.1 By Sales & Delivery Channel
- 8.2.2 By Competitive Positioning & Price Tier
Chapter 9. North America Rare Earth Metals Market
- 9.1 United States
- 9.2 Canada
- 9.3 Mexico
Chapter 10. Europe Rare Earth Metals Market
- 10.1 Germany
- 10.2 France
- 10.3 Italy
- 10.4 United Kingdom
- 10.5 Spain
- 10.6 Poland
- 10.7 Russia
- 10.8 Netherlands
- 10.9 Belgium
- 10.10 Sweden
- 10.11 Denmark
- 10.12 Norway
- 10.13 Rest of Europe
Chapter 11. Asia Pacific Rare Earth Metals Market
- 11.1 China
- 11.2 India
- 11.3 Japan
- 11.4 South Korea
- 11.5 Thailand
- 11.6 Indonesia
- 11.7 Vietnam
- 11.8 Malaysia
- 11.9 Australia
- 11.10 Rest of Asia Pacific
Chapter 12. Latin America Rare Earth Metals Market
- 12.1 Brazil
- 12.2 Argentina
- 12.3 Colombia
- 12.4 Chile
- 12.5 Rest of Latin America
Chapter 13. Middle East Rare Earth Metals Market
- 13.1 Saudi Arabia
- 13.2 United Arab Emirates
- 13.3 Turkey
- 13.4 Israel
- 13.5 Iran
- 13.6 Rest of the Middle East
Chapter 14. Africa Rare Earth Metals Market
- 14.1 South Africa
- 14.2 Egypt
- 14.3 Nigeria
- 14.4 Morocco
- 14.5 Rest of Africa
Chapter 15. Rare Earth Metals Company Profiles
- 15.1 [Company 01]
- 15.1.1 Company Overview
- 15.1.2 Key Management Personnel
- 15.1.3 Products & Services Portfolio
- 15.1.4 Financial Performance
- 15.1.5 Key Market Focus & Geographic Presence
- 15.1.6 Recent Developments & Strategic Initiatives
Note: The company profile list is preliminary and may change based on research findings, market developments, data availability, and client requirements.
Chapter 16. Appendices
- Appendix A – List of Abbreviations & Acronyms
- Appendix B – Industry Classification Code Reference – Full Series
- Appendix C – Supply, Output & Operating Capacity Data Tables
- Appendix D – End-Use & Demand Base Tables
- Appendix E – Demand, Adoption & Usage Assumptions
- Appendix F – Pricing & Revenue Metric Reference Tables
- Appendix G – Company Operations & Infrastructure Database
- Appendix H – Cross-Border Trade & Activity Data Tables (Where Applicable)
- Appendix I – Regulatory Summary Tables
- Appendix J – Primary Research Participant List (Anonymized)
- Appendix K – Primary Research Questionnaire Framework
- Appendix L – Data Sources & Bibliography
- Appendix M – Market Size Divergence & Source Comparison
Chapter 17. Research Methodology
- 17.1 Research Framework & Philosophy
- 17.2 Secondary Research – Sources, Hierarchy & Data Extraction
- 17.3 Data Modeling – Bottom-Up & Top-Down Market Sizing
- 17.4 Primary Research – Stakeholder Framework, LOI & Sample Sizes
- 17.5 Forecast Methodology – Regression, Scenario & Sensitivity Analysis
- 17.6 Quality Control – Four-Layer Validation Framework
- 17.7 Limitations & Standard Assumptions
- 17.8 Disclaimer
