
Market Overview
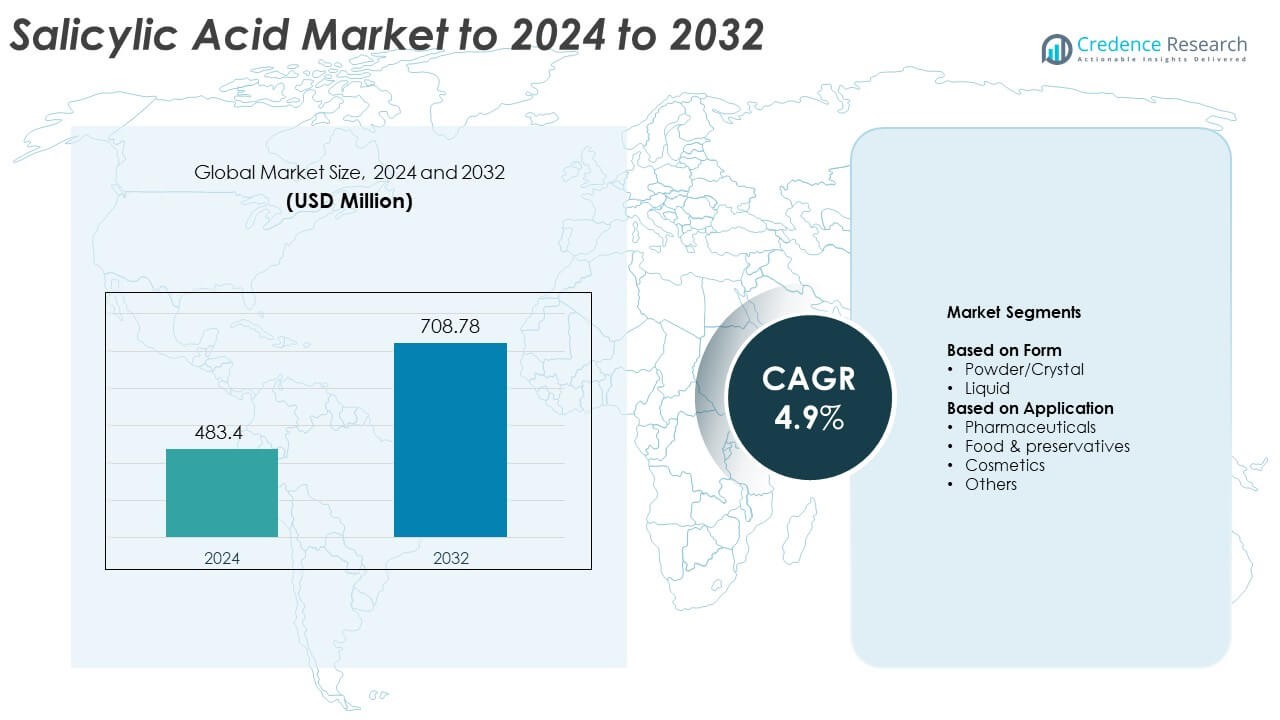
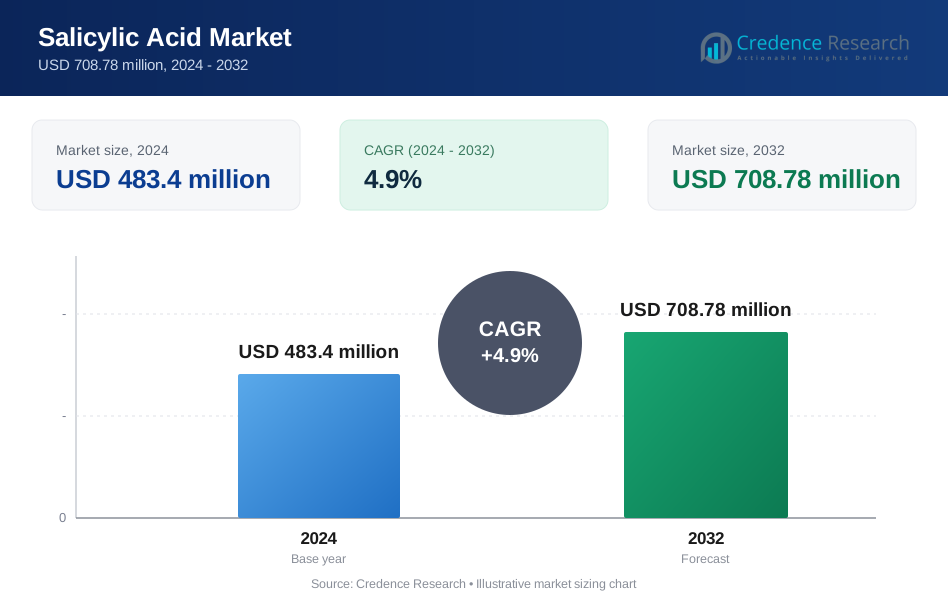
Salicylic Acid Market size was valued at USD 483.4 million in 2024 and is anticipated to reach USD 708.78 million by 2032, at a CAGR of 4.9% during the forecast period.
| REPORT ATTRIBUTE | DETAILS |
|---|---|
| Historical Period | 2020-2023 |
| Base Year | 2024 |
| Forecast Period | 2025-2032 |
| Salicylic Acid Market Size 2024 | USD 483.4 Million |
| Salicylic Acid Market, CAGR | 4.9% |
| Salicylic Acid Market Size 2032 | USD 708.78 Million |
The salicylic acid market includes key players such as Thermo Fisher Scientific Inc, Flychem, Hebei Jingye Medical Technology Co., Dove, Re’equil, Novocap SA, Alta Laboratories Ltd, Siddharth Carbochem Products Ltd, and Zhenjiang Gaopeng Pharmaceutical Co., Ltd. These companies strengthened their positions by improving purity grades, expanding production capacity, and supporting rising demand from pharmaceuticals, cosmetics, and food-preservative applications. Producers focused on stable supply and regulatory compliance, which helped maintain strong partnerships with global buyers. Asia Pacific emerged as the leading region in 2024 with a 34% market share, supported by large-scale manufacturing bases and growing consumption in dermatology and personal-care products.
Market Insights
- The salicylic acid market reached USD 483.4 million in 2024 and is projected to reach USD 708.78 million by 2032, growing at a CAGR of 4.9%.
- Rising demand for acne-care formulas and pharmaceutical-grade topical treatments drives steady consumption across major end-use industries.
- Skincare trends favor exfoliating, clean-label, and multifunctional products, increasing use of high-purity salicylic acid in cosmetics.
- Market competition intensifies as producers enhance purity levels and expand capacity, while powder or crystal form leads the form segment with about 62% share.
- Asia Pacific holds the highest regional share at 34%, followed by North America at 32% and Europe at 29%, supported by strong pharmaceutical and cosmetic production.
 Market Segmentation Analysis:
By Form
Powder or crystal form dominated the salicylic acid market in 2024 with about 62% share. Manufacturers preferred this form because it offers high stability, easy blending, and better suitability for pharmaceutical and cosmetic formulations. Strong adoption came from acne-care products, wart-removal treatments, and topical anti-inflammatory medicines that require precise concentration levels. Liquid form expanded at a steady pace due to rising use in chemical processing and food-preservative blends, but powder or crystal form stayed ahead as healthcare brands increased production of dermatology-focused products across global facilities.
- For instance, Shandong Xinhua Pharmaceutical I&E Co., Ltd., a major producer of pain relievers, has a current production capacity of 10,000 metric tons annually for Aspirin (Acetyl Salicylic Acid), a derivative of salicylic acid, and exports 5,000 metric tons of this product globally.
By Application
Pharmaceuticals led the application segment in 2024 with nearly 46% share. Demand grew as drug makers used salicylic acid for acne therapies, keratolytic creams, analgesic intermediates, and anti-inflammatory preparations. The segment benefited from rising dermatology consultations and wider access to prescription and OTC skin-treatment products. Cosmetics followed closely due to growth in exfoliating serums and deep-cleansing formulations, while food and preservatives and other industrial uses advanced steadily. Pharmaceuticals remained dominant because regulated drug formulations require consistent purity and high-grade salicylic acid for targeted therapeutic action.
- For instance, Almirall’s Actikerall cutaneous solution contains 100 mg of salicylic acid in each gram of formulation, used topically for hyperkeratotic actinic keratosis in regulated prescription therapy.
Key Growth Drivers
Rising demand for dermatology and skincare products
Growing demand for acne-care and exfoliation products increased global use of salicylic acid in 2024. Dermatology brands relied on the compound for its keratolytic action, which supports skin renewal and reduces breakouts. Expanding consumer focus on facial cleansing, deep-pore treatment, and anti-blemish solutions strengthened market growth across retail and online channels. Wider access to OTC treatment options and rising awareness about preventive skincare further pushed demand from cosmetic and pharmaceutical manufacturers.
- For instance, Neutrogena Oil-Free Acne Wash is labeled with 2% salicylic acid, a standard and effective concentration for treating acne.
Expansion of pharmaceutical applications
Pharmaceutical companies used salicylic acid as a key intermediate in producing analgesics, anti-inflammatory drugs, and topical therapeutic creams. Rising cases of skin disorders and musculoskeletal pain increased consumption across developed and emerging markets. The compound’s versatility supported multiple formulations, which encouraged drug makers to scale procurement. Strong investment in dermatology research and wider availability of prescription therapies helped sustain ongoing demand in regulated markets.
- For instance, Bayer’s regular-strength Aspirin tablets each contain 325 mg of acetylsalicylic acid, and the product is supplied globally in multiple strengths for analgesic and cardiovascular indications.
Growing adoption in food preservation and industrial processes
Food processors used salicylic acid in controlled applications to extend product shelf life and maintain stability. Industrial users adopted the compound for dye manufacturing, rubber processing, and chemical synthesis. Growing packaged-food consumption and rising production volumes in chemical plants supported market uptake from non-pharma sectors. Consistent regulatory focus on product quality encouraged companies to use high-purity grades, which added momentum to the segment.
Key Trends and Opportunities
Growth in clean-label and multifunctional cosmetic formulations
Cosmetic companies shifted toward clean-label and multifunctional skincare solutions, increasing use of salicylic acid in gentle exfoliators, toners, and serums. Demand rose for formulations that combined salicylic acid with plant extracts and hydrating agents to deliver balanced skin treatment. Brands capitalized on consumer interest in non-irritating, science-backed ingredients, creating new product lines across premium and mass segments. This trend opened opportunities for high-purity and sustainably sourced salicylic acid.
- For instance, COSRX BHA Blackhead Power Liquid is formulated with 4% betaine salicylate in a 100 ml bottle, pairing a salicylic-acid derivative with willow bark extract to deliver gentle exfoliation for acne-prone skin.
Rising manufacturing capacity in Asia Pacific
Producers expanded salicylic acid output in India, China, and Southeast Asia to meet strong domestic and export demand. Competitive production costs and improving chemical-grade quality standards allowed regional companies to attract global buyers. Growing pharmaceutical and cosmetic manufacturing clusters created a wide opportunity for suppliers to offer customized purity levels. This shift strengthened Asia Pacific’s role as a key sourcing hub for multiple end-use industries.
- For instamce, Aarti Drugs Ltd. in India started production at its Tarapur facility at the beginning of FY25. Initial salicylic acid output was around 100 tonnes per month due to start-up issues.
Key Challenges
Stringent regulatory requirements across end-use industries
Pharmaceutical, cosmetic, and food industries follow strict regulations on concentration levels, purity grades, and approved applications of salicylic acid. Compliance with these standards increases operational cost and slows product development cycles. Companies face periodic changes in safety guidelines, which require reformulation or re-validation of existing products. These compliance barriers limit rapid market expansion and demand consistent investment in quality-control systems.
Availability of alternative active ingredients
The market faces pressure from alternative ingredients such as glycolic acid, benzoyl peroxide, lactic acid, and natural exfoliants. These substitutes often appeal to consumers seeking milder or more natural formulations. Competing compounds reduce dependence on salicylic acid in several skincare and pharmaceutical applications. This competition forces manufacturers to innovate and maintain product differentiation, especially in regions where consumer preferences shift toward botanical or low-acid solutions.
Regional Analysis
North America
North America held about 32% share of the salicylic acid market in 2024. Strong demand came from pharmaceutical manufacturers producing topical treatments and pain-relief formulations. Skincare brands increased the use of salicylic acid in exfoliating cleansers and acne-care products, supported by high consumer awareness. The region also saw wider adoption in food-grade preservatives and industrial applications. Steady investment in dermatology research and strong retail presence across the U.S. and Canada helped maintain regional dominance during the review period.
Europe
Europe accounted for nearly 29% share in 2024, driven by strong cosmetic and personal-care product consumption. Major skincare companies expanded clean-label formulations, boosting demand for high-purity salicylic acid. Pharmaceutical usage remained consistent across Germany, France, and the U.K. due to high dermatology treatment rates. The region also adopted salicylic acid in controlled food-preservative applications and niche chemical processes. Strict quality regulations encouraged manufacturers to focus on premium and compliant grades, sustaining stable long-term growth.
Asia Pacific
Asia Pacific held the largest share after North America and Europe, reaching about 34% in 2024. The region grew rapidly due to strong production capacity in China and India and rising use in pharmaceuticals and cosmetics. Expanding skincare markets in South Korea, Japan, and Southeast Asia pushed demand for exfoliating and acne-care formulas. Local chemical manufacturers increased output to support global supply chains. Lower production costs and high export volumes positioned Asia Pacific as a major growth hub.
Latin America
Latin America captured around 3% share in 2024, supported by growing demand for acne-treatment products and rising consumer spending on beauty and personal care. Pharmaceutical distributors in Brazil and Mexico increased purchases due to higher availability of affordable OTC dermatology products. Food-preservative applications expanded gradually with growth in packaged foods. However, limited local manufacturing and reliance on imports slowed broader market expansion. Regional demand continued to rise as urban consumers adopted global skincare routines.
Middle East and Africa
Middle East and Africa held nearly 2% share in 2024. Consumption grew in pharmaceuticals for topical and anti-inflammatory treatments, particularly in Gulf countries with strong healthcare infrastructure. Cosmetic brands expanded their presence in urban markets, raising demand for exfoliating products. Industrial applications and preservative uses developed slowly due to limited chemical manufacturing. Despite low overall share, rising retail penetration and increasing awareness of skincare benefits supported gradual market progression across the region.
Market Segmentations:
By Form
- Powder/Crystal
- Liquid
By Application
- Pharmaceuticals
- Food & preservatives
- Cosmetics
- Others
By Geography
- North America
- U.S.
- Canada
- Mexico
- Europe
- Germany
- France
- U.K.
- Italy
- Spain
- Rest of Europe
- Asia Pacific
- China
- Japan
- India
- South Korea
- South-east Asia
- Rest of Asia Pacific
- Latin America
- Brazil
- Argentina
- Rest of Latin America
- Middle East & Africa
- GCC Countries
- South Africa
- Rest of the Middle East and Africa
Competitive Landscape
The salicylic acid market features companies such as Thermo Fisher Scientific Inc, Flychem, Hebei Jingye Medical Technology Co., Dove, Re’equil, Novocap SA, Alta Laboratories Ltd, Siddharth Carbochem Products Ltd, and Zhenjiang Gaopeng Pharmaceutical Co., Ltd. Competition remained strong as producers focused on purity, safety, and consistent supply for pharmaceutical and cosmetic applications. Manufacturers expanded production lines to support rising demand from acne-care, exfoliation, and topical treatment products. Global suppliers improved quality standards to meet strict regulations across major markets. Many companies upgraded technology to increase yield and reduce energy use during processing. Brands with flexible-grade offerings gained an advantage because buyers required tailored purity for diverse uses. Market players also worked on sustainable sourcing strategies to align with clean-label trends in cosmetics. Firms strengthened distribution across Asia Pacific, North America, and Europe to reduce delivery gaps and support contract manufacturing demand. Strategic partnerships, capacity scaling, and stable logistics networks supported competitive positioning.
Key Player Analysis
- Thermo Fisher Scientific Inc
- Flychem
- Hebei Jingye Medical Technology Co.
- Dove
- Re’equil
- Novocap SA
- Alta Laboratories Ltd
- Siddharth Carbochem Products Ltd.
- Zhenjiang Gaopeng Pharmaceutical Co., Ltd.
Recent Developments
- In 2024 Flychem, introduced KOSAVA™, a new high-purity encapsulated salicylic acid product using ProbiCap™ encapsulation technology for personal care and pharmaceutical formulations.
- In 2024, Re’equil announced the launch of its Skin Clarifying Serum with Encapsulated Salicylic Acid and Granactive ACNE.
- In 2024, Dove introduced its range of serum body washes, which included Acne Clear, which contained a 1% clearing salicylic acid acne treatment that can help clear and prevent acne.
Report Coverage
The research report offers an in-depth analysis based on Form, Application and Geography. It details leading market players, providing an overview of their business, product offerings, investments, revenue streams, and key applications. Additionally, the report includes insights into the competitive environment, SWOT analysis, current market trends, as well as the primary drivers and constraints. Furthermore, it discusses various factors that have driven market expansion in recent years. The report also explores market dynamics, regulatory scenarios, and technological advancements that are shaping the industry. It assesses the impact of external factors and global economic changes on market growth. Lastly, it provides strategic recommendations for new entrants and established companies to navigate the complexities of the market.
Future Outlook
- Demand for high-purity salicylic acid will rise as dermatology products expand globally.
- Pharmaceutical companies will increase usage in topical and anti-inflammatory formulations.
- Clean-label skincare trends will boost adoption in exfoliating and acne-treatment products.
- Asia Pacific will strengthen its position as a major production and export hub.
- Cosmetic brands will launch multifunctional formulas that integrate salicylic acid with mild actives.
- Food-preservative applications will grow with rising packaged and processed food consumption.
- Industrial uses in dyes, rubber, and chemical synthesis will continue to diversify.
- Manufacturers will invest in sustainable and energy-efficient production processes.
- Regulatory compliance will push companies toward improved quality-control systems.
- Expanding e-commerce channels will support wider distribution of salicylic acid-based consumer products.
Request a Free Sample
Fill in your details and we'll send you a free sample report.
- Sample data tables & charts
- Research methodology
Need a Custom Version of This Report?
Tailor the scope, geography, or segments to your exact requirements.
- Custom geography or segment scope
- Direct access to our analyst team
Frequently Asked Questions
What is the current market size for the salicylic acid market, and what is its projected size in 2032?
At what Compound Annual Growth Rate is the salicylic acid market projected to grow between 2025 and 2032?
Which salicylic acid market segment held the largest share in 2024?
What are the primary factors fueling the growth of the salicylic acid market?
Who are the leading companies in the salicylic acid market?
Which region commanded the largest share of the salicylic acid market in 2024?
Table of Content
Chapter 1. Report Introduction
- 1.1 Report Description & Purpose
- 1.1.1 Report Title & Market Definition
- 1.1.2 Unique Selling Propositions (USP) & Key Differentiators
- 1.1.3 Value Proposition for Stakeholders
- 1.2 Research Objectives
- 1.2.1 Market Sizing Objectives (Volume & Revenue)
- 1.2.2 Segmentation Objectives
- 1.2.3 Competitive Intelligence Objectives
- 1.2.4 Forecast & Scenario Objectives
- 1.3 Report Scope
- 1.3.1 Salicylic Acid Scope – Types & Subtypes Covered
- 1.3.2 Geographic Scope – Regions & Countries Covered
- 1.3.3 Historical Period, Base Year & Forecast Period (2024; forecast to 2032)
- 1.3.4 Inclusions & Exclusions
- 1.4 HS Code & Classification Framework
- 1.5 Currency, Units & Pricing Basis
- 1.6 Target Stakeholders
- 1.7 Limitations & Assumptions
Chapter 2. Executive Summary
- 2.1 Global Salicylic Acid Market Snapshot
- 2.1.1 Market Size – Historical (2024) & Forecast (2024-2032) (2024: USD 483.4 million → 2032: USD 708.78 million)
- 2.1.2 Volume & Revenue – Global Totals
- 2.1.3 Key Market Highlights – Top Five Facts
- 2.2 Salicylic Acid Market Segmentation Snapshot
- 2.2.1 Market Split by Region – 2024 vs. 2032
- 2.3 Competitive Snapshot
- 2.3.1 Top 10 Players by Revenue Share – 2024
- 2.3.2 Top 10 Players by Volume Share – 2024
- 2.3.3 Recent Strategic Developments (18-Month Summary)
- 2.4 Key Investment Highlights & Strategic Conclusions
Chapter 3. Salicylic Acid Market Dynamics & Industry Analysis
- 3.1 Market Overview & Context
- 3.1.1 Salicylic Acid Market Position in the Broader Automotive Value Chain
- 3.1.2 OEM vs. Replacement Market Dynamics
- 3.1.3 Market Maturity & Development Stage by Region
- 3.2 Salicylic Acid Market Drivers
- 3.3 Salicylic Acid Market Restraints & Challenges
- 3.4 Salicylic Acid Market Opportunities
- 3.5 Porter's Five Forces Analysis
- 3.5.1 Threat of New Entrants
- 3.5.2 Bargaining Power of Suppliers
- 3.5.3 Bargaining Power of Buyers
- 3.5.4 Threat of Substitutes
- 3.5.5 Competitive Rivalry – Intensity Assessment
- 3.6 Salicylic Acid Value Chain Analysis
- 3.6.1 Upstream – Raw Material/Input Suppliers
- 3.6.1.1 Raw Material/Input 1
- 3.6.1.2 Raw Material/Input 2
- 3.6.1.3 Raw Material/Input 3
- 3.6.2 Midstream – Production/Manufacturing/Service Delivery
- 3.6.2.1 Production/Process Overview
- 3.6.2.2 Key Facility Locations & Capacity by Manufacturer
- 3.6.3 Downstream – Distribution & End Consumer
- 3.6.3.1 Primary Channel – B2B/OEM
- 3.6.3.2 Secondary Channels – Dealer, Retail, Online, Direct
- 3.6.4 Value Chain Profitability Analysis
- 3.6.1 Upstream – Raw Material/Input Suppliers
- 3.7 PESTEL Analysis
- 3.7.1 Political Factors
- 3.7.2 Economic Factors
- 3.7.3 Social Factors
- 3.7.4 Technological Factors
- 3.7.5 Environmental Factors
- 3.7.6 Legal Factors
- 3.8 Salicylic Acid Supply Chain Analysis
- 3.8.1 Raw Material/Input Supply Risk Assessment
- 3.8.2 Manufacturing Concentration Risk (Geographic Exposure)
- 3.8.3 Trade Disruption Impact Analysis
- 3.9 Regulatory & Policy Landscape
Note: The regulatory and policy landscape section covers regulations based on their applicability to the market, Salicylic Acid category, geography, and scope of the study. Only regulatory frameworks with a material impact on operations, compliance, trade, sustainability, or market access are analyzed in detail.
Chapter 4. Key Investment Pockets & Opportunity Analysis
- 4.1 Salicylic Acid Market Attractiveness Analysis
- 4.1.1 By Region – Investment Attractiveness Matrix (Volume × CAGR)
- 4.2 Absolute Revenue Growth Opportunity
- 4.2.1 By Region – Absolute USD Growth Through 2032
- 4.3 Incremental Volume Opportunity
- 4.3.1 By Region – Incremental Volume Through 2032
- 4.3.2 Segment – Incremental Volume
- 4.4 Emerging Submarket Opportunity Deep Dive (Subject to Applicability)
- 4.5 Emerging Market Opportunity Scorecards
- 4.5.1 United States
- 4.5.2 Europe
- 4.5.3 Asia
- 4.5.4 Middle East & Africa
Note: Emerging Market Opportunity Scorecards will be included based on relevance and strategic importance. Regions listed are indicative and may vary depending on data availability and market dynamics.
Chapter 5. Salicylic Acid Import-Export Analysis & Trade Flows
- 5.1 Global Trade Overview
- 5.1.1 Global Export Value by Country (2024)
- 5.1.2 Global Export Volume by Country (2024)
- 5.1.3 Global Import Value by Country (2024)
- 5.1.4 Global Import Volume by Country (2024)
- 5.1.5 Net Trade Balance by Country (2024)
- 5.2 Export Analysis – Segment
- 5.2.1 Type 1 (HS Code)
- 5.2.2 Type 2 (HS Code)
- 5.2.3 Type 3 (HS Code)
- 5.2.4 Type 4 (HS Code)
- 5.2.5 Type 5 (HS Code)
- 5.3 Import Analysis – Segment
- 5.3.1 Type 1 (HS Code)
- 5.3.2 Type 2 (HS Code)
- 5.3.3 Type 3 (HS Code)
- 5.3.4 Type 4 (HS Code)
- 5.3.5 Type 5 (HS Code)
- 5.4 Average Unit Trade Prices
- 5.4.1 Average Export Price – Segment & Country
- 5.4.2 Average Import Price – Segment & Source Country
- 5.4.3 Price Trends (2024)
- 5.5 Key Trade Route Analysis
- 5.5.1 Trade Route 1
- 5.5.2 Trade Route 2
- 5.5.3 Trade Route 3
- 5.5.4 Trade Route 4
- 5.5.5 Trade Route 5
- 5.6 Trade Policy Impact Assessment
- 5.6.1 US Anti-Dumping & Section 301 Tariffs
- 5.6.2 EU Customs Union Impact
- 5.6.3 Major Free Trade Agreements
- 5.6.4 USMCA Rules of Origin
Note: Trade policy analysis will be included only where relevant to the Salicylic Acid market.
Chapter 6. Competitive Landscape & Company Benchmarking
- 6.1 Salicylic Acid Market Concentration & Structure
- 6.1.1 Herfindahl-Hirschman Index (HHI) – vs. 2024
- 6.1.2 Tier 1, Tier 2 & Tier 3 Market Structure
- 6.1.3 Global, Regional & Local Player Dynamics
- 6.2 Salicylic Acid Market Share Analysis – 2024
- 6.2.1 Global Revenue Share by Company
- 6.2.2 Global Volume Share by Company
- 6.2.3 Regional Revenue Share
- 6.2.4 Market Share Evolution ( vs. 2024)
- 6.2.5 OEM Segment Share by Company
- 6.2.6 Replacement Segment Share by Company
- 6.3 Production/Delivery Capacity & Facility Analysis
- 6.3.1 Global Installed Capacity
- 6.3.2 Capacity Utilization Rates
- 6.3.3 Production/Output Volume
- 6.3.4 Facility Locations & Capacity Map
- 6.3.5 Planned Capacity Additions
- 6.4 Salicylic Acid Competitive Benchmarking Matrix
- 6.4.1 Revenue, Volume, CAGR & Profitability Comparison
- 6.4.2 Channel Revenue Mix
- 6.4.3 Geographic Revenue Exposure
- 6.4.4 R&D Intensity
- 6.4.5 Sustainability Maturity
- 6.5 Strategic Developments in Salicylic Acid (Last 24 Months)
- 6.5.1 Mergers, Acquisitions & Divestments
- 6.5.2 New Salicylic Acid Launches
- 6.5.3 Facility Expansions
- 6.5.4 Strategic Alliances, Joint Ventures & Partnerships
- 6.5.5 Distribution Expansion & Market Entry
- 6.5.6 Sustainability & ESG Initiatives
- 6.6 Competitive Strategy Mapping
- 6.6.1 Leader, Challenger, Follower & Niche Classification
- 6.6.2 Pricing Strategy Comparison
- 6.6.3 Channel Strategy Matrix
Note: Strategic developments are included based on their materiality and the availability of reliable information.
Chapter 7. Global Salicylic Acid Market – By Distribution Channel
- 7.1 Segment Overview
- 7.1.1 Volume & Revenue Split by Channel (2024 & 2032)
- 7.1.2 Channel Mix Evolution (2024-2032)
Chapter 8. Regional Market Analysis – Global Overview
- 8.1 Global Regional Overview
- 8.1.1 Regional Volume Share
- 8.1.2 Regional Revenue Share
- 8.1.3 Regional Volume by Region
- 8.1.4 Regional Revenue by Region
- 8.1.5 Regional Forecast Through 2032
- 8.2 Cross-Regional Segment Analysis
- 8.2.1 By Distribution Channel
- 8.2.2 By Brand/Price Tier
Chapter 9. North America Salicylic Acid Market
- 9.1 United States
- 9.2 Canada
- 9.3 Mexico
Chapter 10. Europe Salicylic Acid Market
- 10.1 Germany
- 10.2 France
- 10.3 Italy
- 10.4 United Kingdom
- 10.5 Spain
- 10.6 Poland
- 10.7 Russia
- 10.8 Netherlands
- 10.9 Belgium
- 10.10 Sweden
- 10.11 Denmark
- 10.12 Norway
- 10.13 Rest of Europe
Chapter 11. Asia Pacific Salicylic Acid Market
- 11.1 China
- 11.2 India
- 11.3 Japan
- 11.4 South Korea
- 11.5 Thailand
- 11.6 Indonesia
- 11.7 Vietnam
- 11.8 Malaysia
- 11.9 Australia
- 11.10 Rest of Asia Pacific
Chapter 12. Latin America Salicylic Acid Market
- 12.1 Brazil
- 12.2 Argentina
- 12.3 Colombia
- 12.4 Chile
- 12.5 Rest of Latin America
Chapter 13. Middle East Salicylic Acid Market
- 13.1 Saudi Arabia
- 13.2 United Arab Emirates
- 13.3 Turkey
- 13.4 Israel
- 13.5 Iran
- 13.6 Rest of the Middle East
Chapter 14. Africa Salicylic Acid Market
- 14.1 South Africa
- 14.2 Egypt
- 14.3 Nigeria
- 14.4 Morocco
- 14.5 Rest of Africa
Chapter 15. Salicylic Acid Company Profiles
- 15.1 [Company 01]
- 15.1.1 Company Overview
- 15.1.2 Key Management Personnel
- 15.1.3 Products & Services Portfolio
- 15.1.4 Financial Performance
- 15.1.5 Key Market Focus & Geographic Presence
- 15.1.6 Recent Developments & Strategic Initiatives
Note: The company profile list is preliminary and may change based on research findings, market developments, data availability, and client requirements.
Chapter 16. Appendices
- Appendix A – List of Abbreviations & Acronyms
- Appendix B – Industry Classification Code Reference – Full Series
- Appendix C – Production & Capacity Data Tables
- Appendix D – End-Use & Demand Base Tables
- Appendix E – Consumption & Replacement Rate Assumptions
- Appendix F – ASP Reference Tables
- Appendix G – Manufacturing & Facility Database
- Appendix H – Import-Export Data Tables
- Appendix I – Regulatory Summary Tables
- Appendix J – Primary Research Participant List (Anonymized)
- Appendix K – Primary Research Questionnaire Framework
- Appendix L – Data Sources & Bibliography
- Appendix M – Market Size Divergence & Source Comparison
Chapter 17. Research Methodology
- 17.1 Research Framework & Philosophy
- 17.2 Secondary Research – Sources, Hierarchy & Data Extraction
- 17.3 Data Modeling – Bottom-Up & Top-Down Market Sizing
- 17.4 Primary Research – Stakeholder Framework, LOI & Sample Sizes
- 17.5 Forecast Methodology – Regression, Scenario & Sensitivity Analysis
- 17.6 Quality Control – Four-Layer Validation Framework
- 17.7 Limitations & Standard Assumptions
- 17.8 Disclaimer
