Market overview
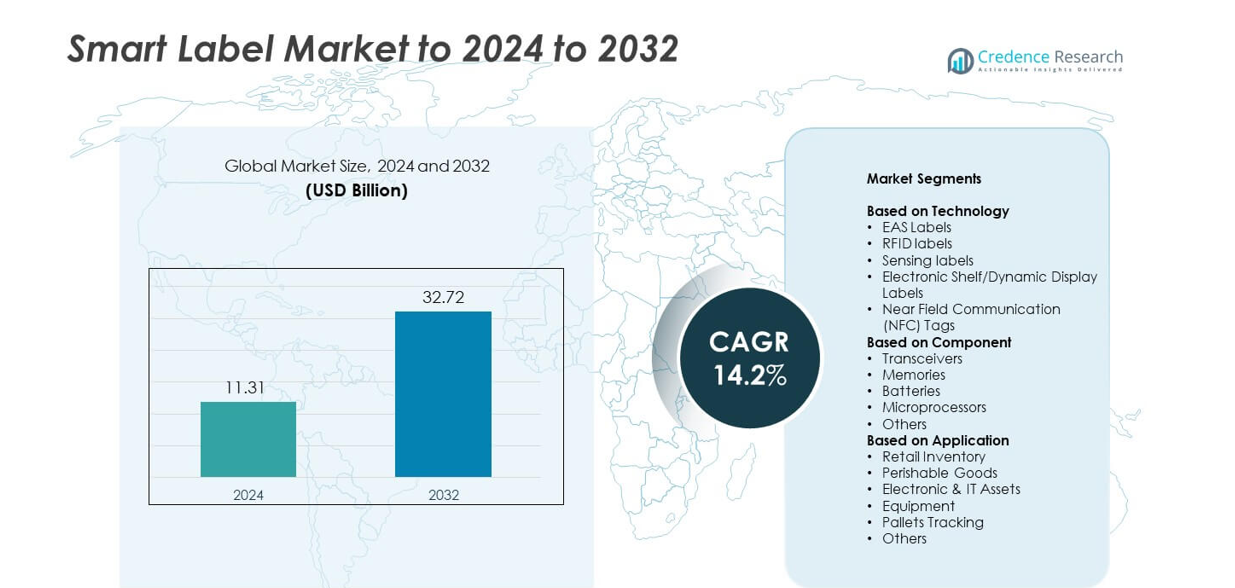
Smart Label Market size was valued USD 11.31 Billion in 2024 and is anticipated to reach USD 32.72 Billion by 2032, at a CAGR of 14.2% during the forecast period.
| REPORT ATTRIBUTE |
DETAILS |
| Historical Period |
2020-2023 |
| Base Year |
2024 |
| Forecast Period |
2025-2032 |
| Smart Label Market Size 2024 |
USD 11.31 Billion |
| Smart Label Market, CAGR |
14.2% |
| Smart Label Market Size 2032 |
USD 32.72 Billion |
The SMART LABEL Market features key players such as Checkpoint Systems, Inc., Avery Dennison Corporation, Invengo Information Technology Co., Ltd., MPI Labels, NXP Semiconductors, Zebra Technologies Corporation, Murata Manufacturing Co., Ltd., CCL Industries, Impinj, Inc., and Alien Technology, LLC. These companies strengthen market growth through advanced RFID platforms, sensing technologies, and integrated label solutions that support real-time tracking and automation. Their focus on accuracy, supply-chain transparency, and embedded intelligence drives adoption across retail, logistics, and perishable goods. North America led the SMART LABEL Market in 2024 with an estimated 38% share, supported by high digital adoption, strong retail automation, and early RFID uptake. Europe followed with rising smart packaging investments, while Asia Pacific recorded fast expansion driven by manufacturing scale and rapid IoT integration.
Market Insights
- The Smart Label Market reached USD 11.31 Billion in 2024 and is projected to hit USD 32.72 Billion by 2032, advancing at a CAGR of 14.2%.
- Market growth is driven by high adoption of RFID labels, which held the largest share in 2024 due to rising demand for real-time tracking, automated inventory cycles, and enhanced supply-chain visibility.
- Key trends include wider use of electronic shelf labels in retail, expansion of sensing labels in cold-chain logistics, and increasing NFC tag deployment for consumer engagement across packaged goods.
- Competitive activity remains strong as players expand portfolios with IoT-enabled labels, integrated software platforms, and advanced semiconductor components, while pricing pressure and integration complexity restrain rapid adoption for small retailers.
- North America led the market with about 38% share, followed by Europe at around 32%, Asia Pacific close to 24%, and the rest of the world accounting for smaller contributions, reflecting strong retail digitization and industrial automation.
Access crucial information at unmatched prices!
Request your sample report today & start making informed decisions powered by Credence Research Inc.!
Download Sample
Market Segmentation Analysis:
By Technology
RFID labels dominated the smart label market in 2024 with about 46% share. RFID gained strong traction because retailers, logistics firms, and manufacturers used these tags for fast scanning, real-time tracking, and improved accuracy across large inventories. Adoption rose as companies shifted to automated workflows and omnichannel fulfilment. Sensing labels advanced in food and pharma due to rising demand for freshness and condition monitoring. Electronic shelf labels expanded in supermarkets as dynamic pricing improved margin control, while NFC tags grew in consumer goods for product authentication.
- For instance, the entire RAIN RFID industry shipped approximately 44.8 billion tag chips in 2023, confirming large-scale RFID adoption across retail and logistics.
By Component
Transceivers led the market in 2024 with nearly 38% share. Their leadership came from rising installations of RFID systems across retail, warehouses, and transport hubs. Transceivers enabled fast data exchange between tags and readers, which improved supply-chain visibility. Memories grew due to expanding data-rich labels used for compliance and traceability. Microprocessors advanced in high-value assets where advanced processing was needed. Batteries saw adoption in active smart labels used for long-range tracking and temperature-logging tasks.
- For instance, Infineon disclosed that it has shipped over 10 billion security controllers using its Integrity Guard architecture, which are widely embedded as core chips in secure RFID and smart label solutions.
By Application
Retail inventory held the largest share in 2024 with around 41% of the global market. Growth came from strong demand for accurate stock tracking, loss prevention, and automated checkout systems. Retailers adopted item-level tagging to reduce shrinkage and improve replenishment cycles across stores and warehouses. Perishable goods gained attention due to rising need for freshness monitoring. Electronic and IT assets grew as firms tracked expensive equipment, while pallet tracking expanded in logistics networks focused on reducing manual scanning and improving shipment visibility.
Key Growth Drivers
Rising demand for real-time inventory visibility
Rising demand for real-time inventory visibility remains a key growth driver in the smart label market. Retailers, logistics firms, and warehouses adopted smart labels to achieve faster cycle counts and improve stock accuracy across large networks. Real-time tracking reduced stockouts, strengthened demand planning, and enhanced fulfillment speed for high-volume operations. RFID-based systems also minimized manual labor and improved order precision, which encouraged broader installation across supermarkets, e-commerce hubs, and distribution centers that rely on automated workflows.
- For instance, Myer in Australia cut its daily inventory counting time for Apple products from 2.5 hours to just 15 minutes at RFID-enabled pilot stores after deploying item-level RFID across selected categories. For an entire apparel department, a full stocktake that previously took 24 labor hours was reduced to just 30 minutes with one person.
Expansion of omnichannel retail operations
Expansion of omnichannel retail operations continues to drive strong adoption of smart labels. Retailers require unified inventory data across online and offline channels to support click-and-collect services, same-day delivery, and multi-location order routing. Smart labels enable synchronized item visibility, faster restocking, and improved customer service during peak demand periods. As brands scale digital commerce, streamlined inventory coordination becomes essential, which increases smart label usage across global retail chains and strengthens long-term demand.
- For instance, Fabletics has rolled out its RFID-driven gStore inventory application in 74 stores and is adding about 20 locations each month, targeting coverage of more than 100 outlets to support real-time stock visibility for omnichannel fulfillment.
Growth in smart packaging and product authentication
Growth in smart packaging and authentication supports rising market demand as brands seek stronger protection and consumer engagement. Smart labels verify product integrity, detect tampering, and prevent counterfeiting in categories such as pharmaceuticals, premium beverages, and electronics. Sensing labels enhance freshness monitoring for food and cold-chain goods, improving safety and shelf-life control. The combined benefits strengthen brand trust, enable regulatory compliance, and expand adoption in sectors that require high security and product transparency.
Key Trend & Opportunity
Rapid shift toward electronic shelf labels and dynamic pricing
Rapid adoption of electronic shelf labels creates a major trend and opportunity as retailers push toward automated pricing systems. Dynamic displays allow stores to adjust prices instantly based on demand, inventory levels, or seasonal changes, reducing manual labor and printing waste. These labels improve price accuracy, enhance customer transparency, and support real-time promotions. Large hypermarkets and convenience chains accelerated deployments to boost margins and streamline store operations, opening strong opportunities for display-integrated smart label solutions.
- For instance, Pricer reports having sold more than 350 million electronic shelf labels to over 28,000 stores in more than 70 countries, underlining the rapid global shift to digital price labeling.
Growing adoption of IoT-enabled sensing labels
Growing adoption of IoT-enabled sensing labels creates significant opportunities across cold-chain logistics, pharmaceuticals, and industrial assets. These labels monitor temperature, humidity, vibration, and product condition with higher precision, supporting safer handling and regulatory compliance. IoT connectivity enhances decision-making during storage and transport, reducing spoilage and improving quality control. Expanding use in perishable foods, vaccines, biologics, and high-value equipment strengthens demand for intelligent monitoring labels with cloud-enabled analytics.
- For instance, Identiv received an initial order to manufacture 25 million IoT Pixel tags for a major ambient IoT platform, supporting item-level sensing and real-time monitoring across large supply chains.
Rising use of NFC tags for consumer engagement
Rising use of NFC tags offers strong opportunities for direct brand-to-consumer interaction. NFC-enabled packaging allows buyers to access product details, loyalty programs, authenticity checks, and promotional content with a simple smartphone tap. This enhances user experience and strengthens customer engagement during purchase and post-purchase stages. Growing interest in interactive packaging and digital marketing pushes brands to integrate NFC tags across cosmetics, apparel, beverages, and premium goods.
Key Challenge
High deployment and integration costs
High deployment and integration costs remain a major challenge, especially for small and medium retailers. RFID systems, electronic shelf labels, and sensing technologies require investment in hardware, software platforms, network infrastructure, and continuous maintenance. Staff training and system integration further raise expenses, slowing adoption in cost-sensitive markets. Many businesses delay full-scale deployment due to budget limits, which restricts fast expansion in emerging regions and reduces speed of digital transformation.
Concerns about data security and privacy
Concerns about data security and privacy hinder adoption as smart labels generate large volumes of tracking and product-level information. Unauthorized access, data leaks, and misuse pose risks for retailers, logistics companies, and consumers. Firms must secure communication channels, encrypt data, and meet regional privacy regulations, which raises deployment complexity and operating costs. These concerns force organizations to invest in advanced cybersecurity measures and slow adoption among users wary of data vulnerabilities.
Regional Analysis
North America
North America held the highest share of the smart label market in 2024 with about 38%. Strong adoption came from large retailers, logistics providers, and e-commerce fulfillment centers seeking accurate and real-time inventory tracking. RFID expansion across hypermarkets, electronics chains, and warehouse automation systems boosted demand. Electronic shelf labels gained traction as brands focused on dynamic pricing and reduced labor costs. Widespread use of sensing labels in cold-chain food, pharmaceuticals, and healthcare supported consistent growth. The region continued to advance due to mature digital infrastructure, strong IoT integration, and rapid investment in automated retail technologies.
Europe
Europe accounted for nearly 30% of the smart label market in 2024. High regulatory focus on product transparency, traceability, and sustainability supported adoption across food, pharmaceuticals, and consumer goods. Retailers embraced electronic shelf labels to manage dynamic pricing, especially in France, Germany, and the Nordics. RFID deployment expanded as brands strengthened anti-counterfeit protection and logistics efficiency. Growth accelerated through rising use of NFC-enabled packaging for customer engagement. Strong digital transformation across supply chains helped increase deployment in supermarkets, fashion chains, and industrial inventory systems across major European economies.
Asia Pacific
Asia Pacific captured around 22% share of the smart label market in 2024. Rapid expansion in retail, e-commerce, and manufacturing created strong demand for RFID and sensing labels. China, Japan, and South Korea led adoption due to large-scale automation, strict quality control needs, and growth in omnichannel retail. Rising logistics activity and cold-chain modernization supported wider use of condition-monitoring labels. NFC-enabled packaging gained momentum in consumer electronics and premium goods. Faster digitalization, rising disposable incomes, and strong government support for smart supply-chain technologies continued to boost market penetration across the region.
Latin America
Latin America held close to 6% of the smart label market in 2024. Adoption grew steadily as retail chains and logistics operators modernized inventory tracking systems. Brazil, Mexico, and Chile led regional demand due to expanding supermarkets, rising e-commerce penetration, and stronger focus on product authentication. RFID-based systems helped reduce shrinkage and improve stock accuracy. Growth in cold-chain distribution encouraged use of sensing labels for perishables. Despite cost barriers, improving digital infrastructure supported gradual adoption of electronic shelf labels across urban retail markets.
Middle East & Africa
Middle East & Africa accounted for about 4% share of the smart label market in 2024. Demand increased in retail, food distribution, and pharmaceuticals as businesses strengthened tracking accuracy and supply-chain visibility. The UAE, Saudi Arabia, and South Africa led adoption due to rising smart retail investments and expansion of automated warehouses. RFID labels supported asset tracking in logistics hubs, while sensing labels gained interest in temperature-sensitive goods. Although penetration remained lower than other regions, ongoing digital transformation and growth in organized retail contributed to steady market expansion.
Market Segmentations:
By Technology
- EAS Labels
- RFID labels
- Sensing labels
- Electronic Shelf/Dynamic Display Labels
- Near Field Communication (NFC) Tags
By Component
- Transceivers
- Memories
- Batteries
- Microprocessors
- Others
By Application
- Retail Inventory
- Perishable Goods
- Electronic & IT Assets
- Equipment
- Pallets Tracking
- Others
By Geography
- North America
- Europe
- Germany
- France
- U.K.
- Italy
- Spain
- Rest of Europe
- Asia Pacific
- China
- Japan
- India
- South Korea
- South-east Asia
- Rest of Asia Pacific
- Latin America
- Brazil
- Argentina
- Rest of Latin America
- Middle East & Africa
- GCC Countries
- South Africa
- Rest of the Middle East and Africa
Competitive Landscape
The SMART LABEL Market features leading players such as Checkpoint Systems, Inc., AVERY DENNISON CORPORATION, Invengo Information Technology Co., Ltd., MPI Labels, NXP Semiconductors, Zebra Technologies Corporation, Murata Manufacturing Co., Ltd., CCL Industries, Impinj, Inc., and Alien Technology, LLC. Market competition intensified as companies focused on expanding RFID, NFC, and sensing label portfolios to meet rising demand across retail, logistics, healthcare, and manufacturing. Vendors invested in integrated software platforms that linked label data with enterprise systems to improve automation and traceability. Partnerships with retailers, packaging converters, and supply-chain providers supported wider deployment across warehouses and stores. Firms accelerated innovation in low-power chips, thinner label structures, and eco-friendly materials to address sustainability priorities. Global expansion strategies, including new production units and regional distribution partnerships, helped strengthen access to growing markets in Asia Pacific, Europe, and North America.
Shape Your Report to Specific Countries or Regions & Enjoy 30% Off!
Key Player Analysis
Recent Developments
- In 2025, Avery Dennison showcased its latest smart labeling and digital identification solutions at the Retail Leadership Summit 2025 in Mumbai, India.
- In 2025, Zebra Technologies introduced Aurora Velocity scan tunnel solutions aimed at enhancing automation and accuracy in smart label reading applications for warehouses and supply chains.
- In 2025, NXP partnered with Linxens IoT Solutions and UnaBiz to launch a smart label program aimed at transforming logistics, supply chain sustainability, and real-time item-level tracking with IoT connectivity integration.
Report Coverage
The research report offers an in-depth analysis based on Technology, Component, Application and Geography. It details leading market players, providing an overview of their business, product offerings, investments, revenue streams, and key applications. Additionally, the report includes insights into the competitive environment, SWOT analysis, current market trends, as well as the primary drivers and constraints. Furthermore, it discusses various factors that have driven market expansion in recent years. The report also explores market dynamics, regulatory scenarios, and technological advancements that are shaping the industry. It assesses the impact of external factors and global economic changes on market growth. Lastly, it provides strategic recommendations for new entrants and established companies to navigate the complexities of the market.
Future Outlook
- The smart label market will expand as retailers adopt automated tracking systems.
- RFID labels will gain wider use due to rising need for faster stock verification.
- Electronic shelf labels will grow as stores shift toward digital pricing models.
- NFC-enabled labels will see higher demand as brands focus on consumer engagement.
- IoT-linked sensing labels will increase adoption in cold-chain and pharma logistics.
- Supply-chain operators will enhance real-time visibility by integrating cloud-based smart label platforms.
- Growth will accelerate in e-commerce due to multi-location inventory needs.
- Manufacturers will deploy smart labels to strengthen product authentication and reduce counterfeiting.
- Adoption will rise in developing regions as hardware costs gradually fall.
- Sustainability goals will push companies to adopt energy-efficient and recyclable smart label designs.


