Market Overview:
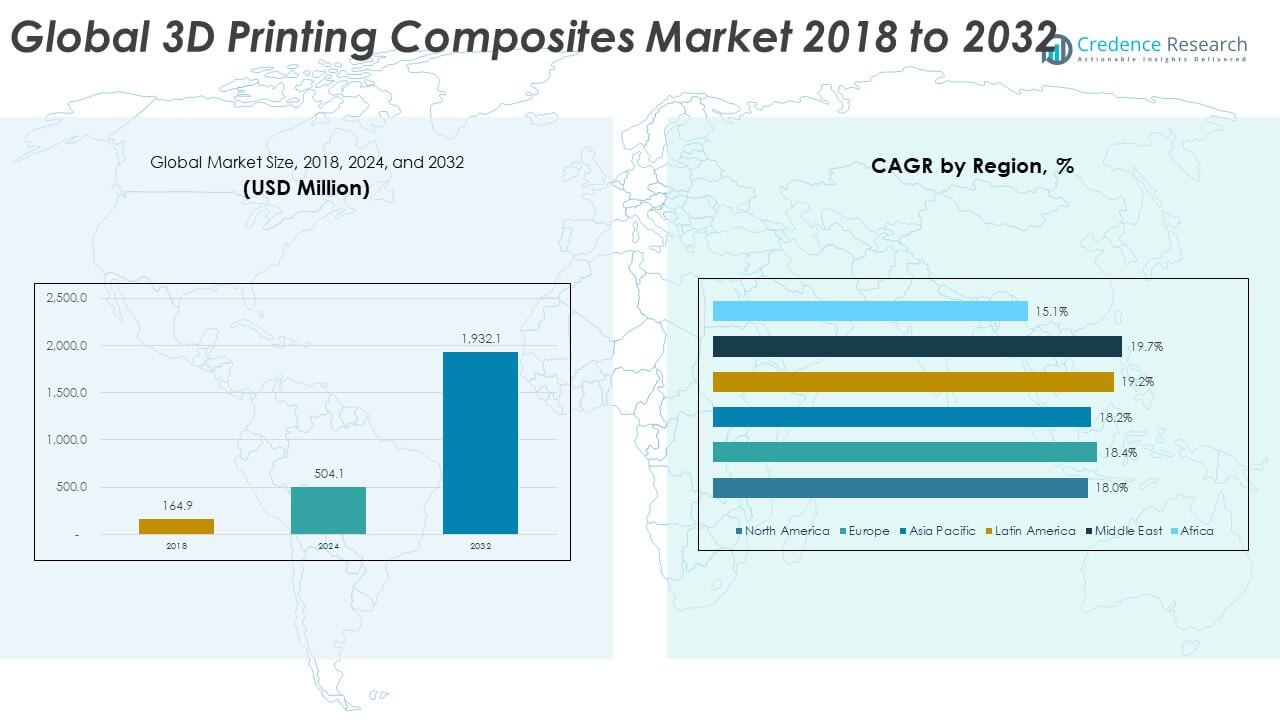
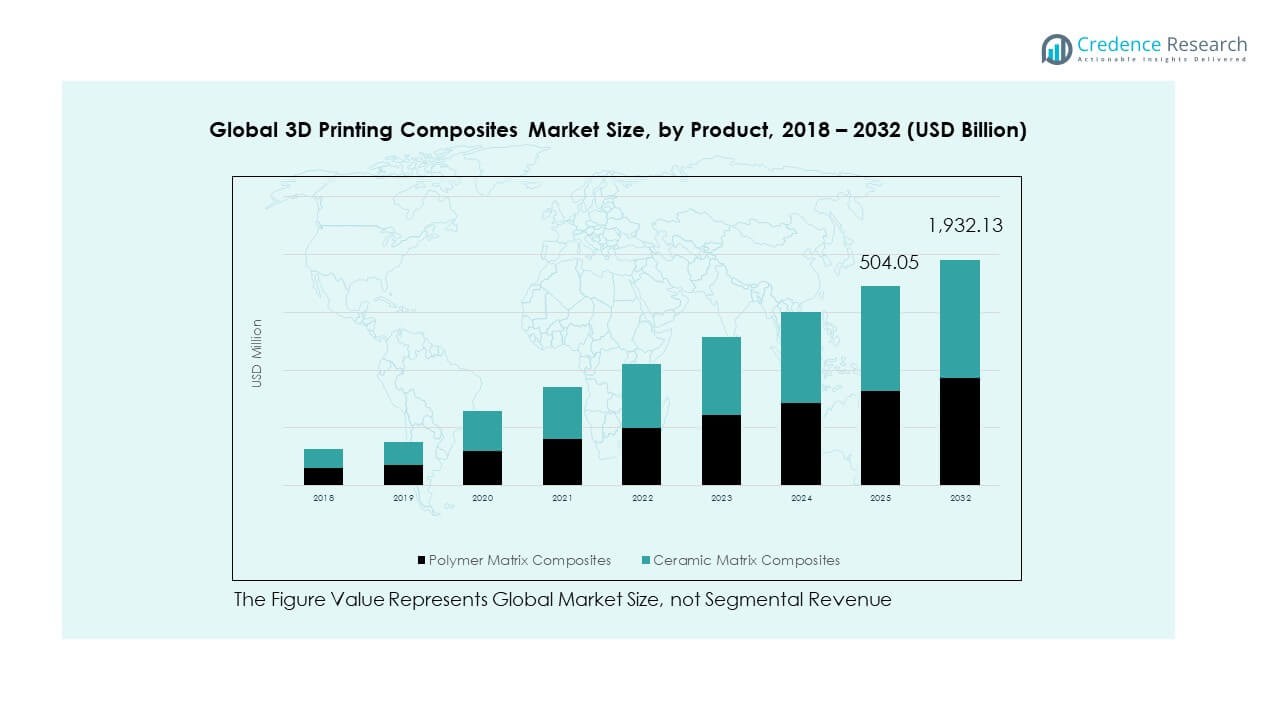
The Global 3D Printing Composites Market size was valued at USD 164.9 million in 2018 to USD 504.1 million in 2024 and is anticipated to reach USD 1,932.1 million by 2032, at a CAGR of 18.34% during the forecast period.
| REPORT ATTRIBUTE |
DETAILS |
| Historical Period |
2020-2023 |
| Base Year |
2024 |
| Forecast Period |
2025-2032 |
| 3D Printing Composites Market Size 2024 |
USD 504.1 Million |
| 3D Printing Composites Market, CAGR |
18.34% |
| 3D Printing Composites Market Size 2032 |
USD 1,932.1 Million |
The market growth is driven by the increasing adoption of lightweight and high-strength materials across aerospace, automotive, and defense industries. Rising demand for customized components, reduced production costs, and shorter lead times through additive manufacturing are key drivers. Continuous advancements in composite filaments and reinforcement materials such as carbon and glass fibers further enhance mechanical performance, encouraging broader industrial use.
North America leads the Global 3D Printing Composites Market due to strong aerospace and defense manufacturing capabilities and early technology adoption. Europe follows, supported by innovation in automotive and industrial design applications. The Asia-Pacific region is emerging rapidly, driven by expanding manufacturing infrastructure, growing 3D printing startups, and supportive government initiatives in countries such as China, Japan, and South Korea.
Access crucial information at unmatched prices!
Request your sample report today & start making informed decisions powered by Credence Research Inc.!
Download Sample
Market Insights:
- The Global 3D Printing Composites Market was valued at USD 164.9 million in 2018, reached USD 504.1 million in 2024, and is projected to hit USD 1,932.1 million by 2032, growing at a CAGR of 18.34%.
- Asia Pacific holds the largest share at 35%, driven by strong manufacturing ecosystems, government support, and rapid industrialization in China, Japan, and India.
- Europe accounts for 27% of the market, supported by R&D investments, sustainable composite initiatives, and widespread adoption in automotive and aerospace industries. North America follows with 19%, led by early technology integration and a robust defense and aerospace base.
- The Middle East is the fastest-growing region, representing 5% of global share, supported by industrial diversification, smart manufacturing initiatives, and increased investments in aerospace and defense.
- Polymer matrix composites dominate the product mix with around 75% share, while ceramic matrix composites represent approximately 25%, reflecting their specialized use in high-temperature and performance-critical applications.
Market Drivers:
Rising Demand for Lightweight and High-Strength Materials Across Industries
The Global 3D Printing Composites Market is driven by strong demand for lightweight and durable materials across sectors such as aerospace, automotive, and defense. Manufacturers are using composite materials to reduce component weight while maintaining structural integrity. These materials offer superior strength-to-weight ratios, helping achieve better fuel efficiency and design flexibility. Aerospace companies use carbon fiber composites to produce high-performance aircraft components. The automotive sector adopts these materials to enhance vehicle performance and reduce emissions. This shift supports cost reduction in assembly and operational efficiency. It helps industries meet sustainability and performance goals effectively. The demand continues to grow with technological improvements in composite filament production.
- For instance, Boeing’s 787 Dreamliner features an airframe made of 50% carbon fiber reinforced composite by weight, enabling up to 25% greater fuel efficiency compared to previous-generation aircraft. BMW’s i3 electric car utilizes carbon fiber-reinforced plastic to reduce body weight by up to 770 pounds (approx. 350 kg) versus conventional materials, demonstrating the impact on vehicle efficiency.
Expanding Adoption of Additive Manufacturing in Prototyping and End-Use Production
Industries are shifting toward additive manufacturing to reduce design cycles and improve customization. The Global 3D Printing Composites Market benefits from increasing use of this technology for producing prototypes and final parts. It helps engineers design complex geometries without traditional manufacturing limitations. The adoption enables faster product development and reduced tooling costs. Automotive and aerospace firms integrate 3D printing to enhance precision and design optimization. The flexibility to print composite materials directly enhances production scalability. It drives competitiveness among component suppliers globally. The growing focus on low-volume, high-value production further supports its penetration across industries.
- For instance, Airbus produced over 1,000 flight-ready parts for its A350 XWB aircraft using Stratasys FDM 3D printers, significantly reducing production time and supporting delivery deadlines. In healthcare, SmileDirectClub manufactures more than 50,000 personalized dental aligners per day using HP Multi Jet Fusion 3D printing technology, streamlining patient-specific component production.
Advancements in Material Development and Reinforcement Technologies
Continuous innovation in reinforcement fibers and resin systems is propelling the Global 3D Printing Composites Market. Researchers are developing hybrid materials with improved strength, heat resistance, and durability. These composites help achieve mechanical stability and lightweight designs in demanding environments. Carbon and glass fiber-based materials dominate due to superior rigidity and surface finish. The integration of nano-fillers enhances electrical and thermal conductivity, expanding use cases in electronics and defense. Material suppliers are focusing on expanding the range of printable composites. It allows users to achieve better performance consistency in end-use applications. Such innovation enhances product reliability and widens commercial adoption across manufacturing ecosystems.
Integration of Automation and Digital Manufacturing Ecosystems
The integration of automation and digital design tools strengthens the efficiency of 3D printing composite workflows. The Global 3D Printing Composites Market benefits from software-driven design optimization, real-time monitoring, and quality control systems. Automation reduces waste and ensures repeatable production outcomes. Manufacturers use simulation tools to optimize part orientation and strength before printing. The integration of robotics in post-processing improves operational throughput. This convergence supports industrial-scale production of composite parts across multiple sectors. It creates a streamlined workflow from design to deployment. The adoption of smart manufacturing principles enables better precision and reduced human dependency in fabrication.
Market Trends:
Emergence of Continuous Fiber Reinforcement and Multi-Material Printing
The Global 3D Printing Composites Market is witnessing growing adoption of continuous fiber reinforcement techniques. These processes improve mechanical strength and durability over short-fiber composites. Manufacturers are experimenting with multi-material printing, combining polymers with carbon or glass fibers. This trend allows production of complex components with tailored mechanical properties. Aerospace, marine, and automotive sectors use these techniques for load-bearing structures. The precision achieved enhances design possibilities for engineers. Continuous fiber deposition enables stronger and lighter parts than traditional molding methods. It sets a new benchmark for advanced material printing standards globally.
- For instance, Markforged’s composite 3D printers deliver carbon fiber-reinforced parts with tensile strengths up to 700 MPa, over twice that of aluminum, used for high-performance tooling and industrial components. Lockheed Martin and Arconic have developed 3D printed lightweight structures for both NASA’s Orion spacecraft and the F-35 Joint Strike Fighter program, supporting advanced aerospace requirements.
Rising Customization and On-Demand Manufacturing in Key Industries
The rise of customization is reshaping industrial production strategies. The Global 3D Printing Composites Market benefits from industries seeking flexible, on-demand production models. Companies produce tools, fixtures, and small-batch parts without long setup times. This helps minimize inventory costs and improves operational agility. Healthcare and automotive sectors rely on on-demand printing for specialized components. The trend supports decentralized manufacturing, reducing supply chain dependency. It empowers localized production hubs with efficient lead-time management. This customization-driven approach increases consumer value and enhances industrial responsiveness to design changes.
- For instance, Ford leverages its advanced manufacturing centers and partnerships to rapidly prototype and produce end-use automotive components using additive manufacturing, reducing development time. While it is not yet suitable for all mass production, the technology supports the production of tools, fixtures, and components for specialized or lower-volume vehicles, such as brackets for the Mustang GT500 or parts for electric vehicles.
Growing Focus on Sustainability and Material Recyclability
Sustainability goals are influencing material innovation across additive manufacturing. The Global 3D Printing Composites Market is evolving toward recyclable and bio-based composite materials. Researchers are developing eco-friendly filaments and resins with reduced environmental impact. Manufacturers aim to minimize waste during the production process. Lightweight designs contribute to lower energy consumption during product use. The industry is exploring closed-loop recycling for composite waste management. Such initiatives align with corporate carbon reduction goals. The adoption of green materials strengthens brand reputation and regulatory compliance in global markets.
Increasing Collaboration Between OEMs and Material Developers
Collaborations between original equipment manufacturers and material developers are shaping future advancements. The Global 3D Printing Composites Market benefits from partnerships that merge design expertise with material science. Joint ventures accelerate product testing and certification processes. Aerospace and defense companies work closely with composite producers to ensure quality and durability. Universities and research labs contribute through material innovation and design simulation. These collaborations reduce the development timeline for new filament technologies. They also promote global standardization and compatibility across different printers. It enhances the overall ecosystem and market accessibility for industrial users.
Market Challenges Analysis:
High Material and Production Costs Limiting Wider Industrial Adoption
The Global 3D Printing Composites Market faces cost-related challenges that restrict large-scale implementation. High prices of composite filaments and reinforcement materials limit affordability for small manufacturers. Specialized equipment and advanced software add further expenses. Many industries find it difficult to justify these investments compared to traditional manufacturing methods. The lack of economies of scale keeps per-unit costs higher. Limited material suppliers and complex processing parameters also increase operational expenses. It slows adoption in price-sensitive sectors like consumer goods. Companies continue to explore cost-effective materials and improved printer efficiencies to overcome these barriers.
Lack of Standardization and Technical Expertise in Composite Additive Manufacturing
The absence of global standards in composite 3D printing processes creates quality consistency issues. The Global 3D Printing Composites Market struggles with variations in strength, porosity, and surface finish among products. Limited workforce expertise adds to the challenge, especially in precision-driven industries. Training and certification programs remain scarce, slowing technology diffusion. Differences in printer calibration and material properties affect repeatability. The sector also lacks unified guidelines for testing and validation. This hampers industrial certification in aerospace and automotive applications. Standardization efforts and skill development programs are essential to establish trust and scalability across industries.
Market Opportunities:
Expansion in Aerospace, Defense, and Electric Vehicle Manufacturing Applications
The Global 3D Printing Composites Market is witnessing expanding opportunities in high-performance sectors. Aerospace and defense companies are adopting composite additive manufacturing for lightweight structural components. Electric vehicle manufacturers use printed composites for battery enclosures and interior parts. These applications enhance energy efficiency and design flexibility. The ability to create customized parts supports maintenance and repair operations. It also helps reduce lead times and logistics costs in global production networks. Continuous government support for advanced manufacturing boosts commercial prospects. The rising adoption in these sectors creates long-term growth pathways for composite suppliers.
Technological Innovation and Growing Penetration in Emerging Markets
Technological innovation presents vast opportunities for expanding composite printing applications. The Global 3D Printing Composites Market benefits from automation, AI integration, and next-generation printer designs. Emerging markets in Asia-Pacific and Latin America are adopting additive manufacturing for industrial modernization. Supportive policies and investment incentives are accelerating adoption. Local manufacturers are collaborating with international technology providers to strengthen capabilities. Educational institutions are promoting research in composite material development. It helps bridge knowledge gaps and fosters ecosystem growth. This expansion into new regions enhances accessibility and drives sustained market progress.
Market Segmentation Analysis:
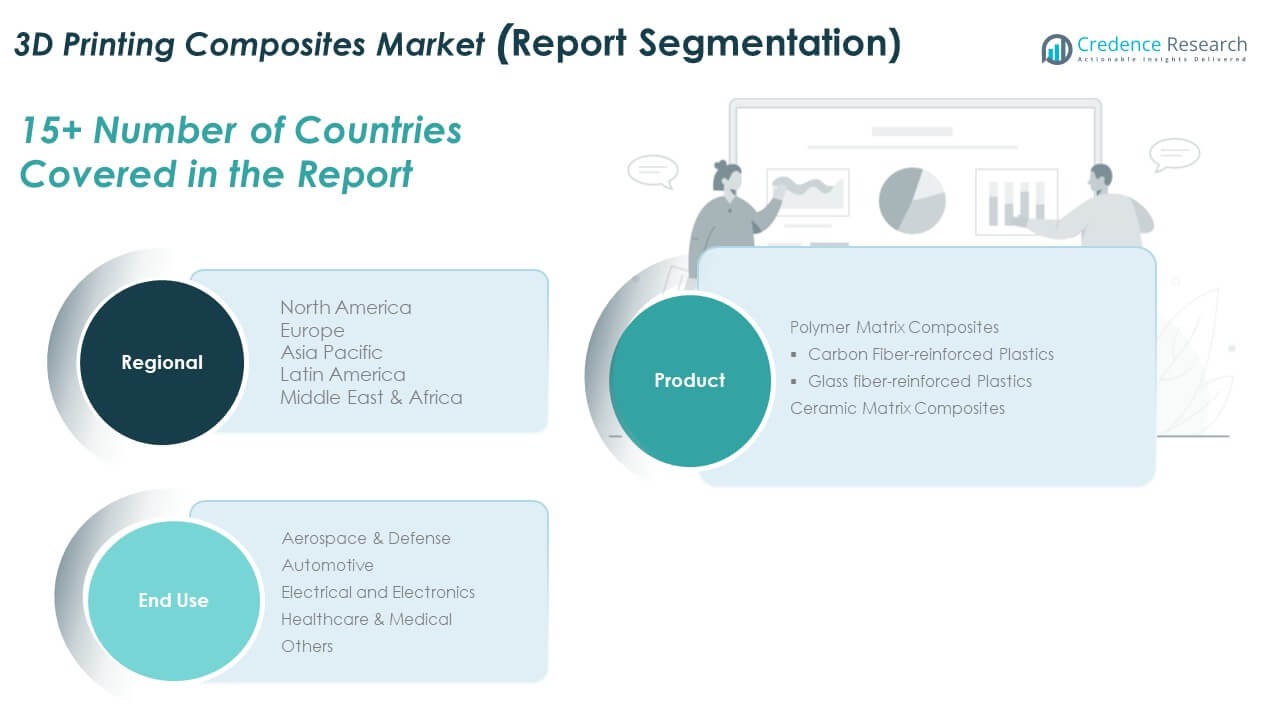
By Product Segment
The Global 3D Printing Composites Market is segmented into polymer matrix composites and ceramic matrix composites. Polymer matrix composites dominate due to their high strength, lightweight properties, and easy printability. Within this category, carbon fiber-reinforced plastics hold the largest share, driven by demand for superior stiffness and mechanical performance in aerospace and automotive applications. Glass fiber-reinforced plastics are gaining traction for their cost-effectiveness and versatility in consumer and industrial products. Ceramic matrix composites cater to high-temperature and corrosion-resistant applications, especially in aerospace and electronics. It continues to witness innovations in filament formulation and reinforcement technology to improve durability and processing efficiency across complex design applications.
- For instance, GE Aerospace’s LEAP jet engines use silicon carbide (SiC) ceramic matrix composites (CMCs) for the turbine shrouds, not the nozzles. These CMCs are made from silicon carbide ceramic fibers and are one-third the weight of traditional metal alloys, leading to a lighter, more fuel-efficient engine with lower emissions.
By End User Segment
End-use segmentation of the Global 3D Printing Composites Market includes aerospace and defense, automotive, electrical and electronics, healthcare and medical, and others. Aerospace and defense lead due to growing use of lightweight materials for structural and interior components. The automotive sector adopts composites for enhanced fuel efficiency and design flexibility. Electrical and electronics manufacturers rely on composites for high-performance enclosures and heat-resistant parts. Healthcare applications expand rapidly with patient-specific prosthetics and medical device components. Other end users include consumer goods and industrial equipment producers seeking improved strength-to-weight performance. It continues to evolve with advancing material science and broader industrial integration.
- For instance, the Boeing 787 achieves 50% composites by weight in its airframe to reduce weight and increase efficiency. The healthcare sector expands with companies like Materialise, which partners with Johnson & Johnson to provide millions of patient-specific medical components and surgical guides each year through 3D printing.
Segmentation:
- By Product Segment
- Polymer Matrix Composites
- Carbon Fiber-reinforced Plastics
- Glass Fiber-reinforced Plastics
- Ceramic Matrix Composites
- By End User Segment
- Aerospace & Defense
- Automotive
- Electrical and Electronics
- Healthcare & Medical
- Others
- By Region
- North America
- Europe
- UK
- France
- Germany
- Italy
- Spain
- Russia
- Rest of Europe
- Asia Pacific
- China
- Japan
- South Korea
- India
- Australia
- Southeast Asia
- Rest of Asia Pacific
- Latin America
- Brazil
- Argentina
- Rest of Latin America
- Middle East
- GCC Countries
- Israel
- Turkey
- Rest of Middle East
- Africa
- South Africa
- Egypt
- Rest of Africa
Regional Analysis:
North America
The North America Global 3D Printing Composites Market size was valued at USD 32.61 million in 2018 to USD 98.08 million in 2024 and is anticipated to reach USD 367.68 million by 2032, at a CAGR of 18.0% during the forecast period. North America holds a market share of around 19% of the global revenue in 2024. The region is driven by strong adoption in aerospace, defense, and automotive manufacturing. The United States leads due to advanced R&D capabilities and widespread industrial use of additive manufacturing technologies. It benefits from the presence of key companies specializing in composite material innovation and 3D printing solutions. Canada supports the regional growth with expanding aerospace production and government-backed innovation programs. High demand for lightweight components and the growing EV sector continue to strengthen regional competitiveness. Investments in automation and material development enhance scalability across industries.
Europe
The Europe Global 3D Printing Composites Market size was valued at USD 44.07 million in 2018 to USD 135.32 million in 2024 and is anticipated to reach USD 521.67 million by 2032, at a CAGR of 18.4% during the forecast period. Europe accounts for nearly 27% of the global market share in 2024. The region leads in integrating sustainable composite materials for manufacturing and design. Germany, France, and the UK drive growth through innovation in aerospace and automotive sectors. The EU’s support for advanced manufacturing and green technology accelerates adoption. It benefits from well-established industrial infrastructure and strong academic collaboration. Companies across Europe are investing in R&D to enhance performance and recyclability of composite filaments. The focus on energy-efficient materials aligns with the region’s carbon-neutral goals, fostering long-term market strength.
Asia Pacific
The Asia Pacific Global 3D Printing Composites Market size was valued at USD 58.81 million in 2018 to USD 178.35 million in 2024 and is anticipated to reach USD 676.24 million by 2032, at a CAGR of 18.2% during the forecast period. Asia Pacific contributes around 35% of the global market share in 2024, making it the largest regional hub. The region benefits from rapid industrialization, rising government support for additive manufacturing, and cost-efficient production. China leads with large-scale adoption across automotive and electronics industries. Japan and South Korea contribute through material innovation and precision engineering. India’s growing manufacturing ecosystem also enhances regional expansion. It experiences rising investments in R&D and 3D printing infrastructure. Expanding collaborations between local manufacturers and global technology providers strengthen Asia Pacific’s global position.
Latin America
The Latin America Global 3D Printing Composites Market size was valued at USD 17.59 million in 2018 to USD 56.44 million in 2024 and is anticipated to reach USD 229.92 million by 2032, at a CAGR of 19.2% during the forecast period. Latin America holds a 11% share of the global market in 2024. The region’s growth is supported by expanding automotive, aerospace, and healthcare sectors. Brazil and Mexico are leading markets with growing interest in lightweight materials and rapid prototyping. It benefits from increased awareness of additive manufacturing in industrial design. The growing focus on localized production helps reduce dependence on imports. Government-backed innovation policies are improving technology accessibility. Advancements in education and research partnerships promote knowledge transfer and industrial modernization.
Middle East
The Middle East Global 3D Printing Composites Market size was valued at USD 7.16 million in 2018 to USD 23.52 million in 2024 and is anticipated to reach USD 98.54 million by 2032, at a CAGR of 19.7% during the forecast period. The Middle East accounts for nearly 5% of the global market share in 2024. The region is embracing additive manufacturing in aerospace, oil and gas, and defense applications. The UAE and Saudi Arabia lead with national strategies promoting 3D printing adoption. It benefits from rising infrastructure investments and smart manufacturing initiatives. Local production of composite materials is increasing, supported by global partnerships. The establishment of advanced research centers drives regional technology growth. Expanding industrial diversification beyond oil enhances demand for 3D printing composites.
Africa
The Africa Global 3D Printing Composites Market size was valued at USD 4.63 million in 2018 to USD 12.35 million in 2024 and is anticipated to reach USD 38.06 million by 2032, at a CAGR of 15.1% during the forecast period. Africa represents around 3% of the global market share in 2024. The region is emerging with gradual adoption in construction, healthcare, and industrial applications. South Africa leads the regional market with growing research and innovation centers. It experiences early adoption in medical prosthetics and low-cost industrial components. Limited infrastructure and high material costs remain challenges. International collaborations and university-led programs are supporting knowledge expansion. Expanding access to digital manufacturing tools is expected to boost future regional participation in composite 3D printing.
Shape Your Report to Specific Countries or Regions & Enjoy 30% Off!
Key Player Analysis:
Competitive Analysis:
The Global 3D Printing Composites Market is characterized by moderate consolidation, with several global and regional players competing through material innovation and technological integration. It is driven by companies investing in advanced composite filaments and reinforcement fibers to enhance product performance and print quality. Firms such as Stratasys, EOS, and 3D Systems focus on expanding production capabilities and customizing solutions for aerospace and automotive applications. Strategic alliances between material suppliers and printer manufacturers strengthen the competitive landscape. It emphasizes research collaboration, cost optimization, and sustainability to achieve market differentiation.
Recent Developments:
- In late September 2025, 3D Systems Corp. provided a significant update on its software strategy. The company entered into a strategic partnership with Hubb Global Holdings to accelerate industry-wide adoption of metal 3D printing. This move includes the divestment of its Oqton MOS and 3DXpert software platforms to Hubb Global Holdings, while 3D Systems retains a strategic focus on integrating AI-driven advancements in its proprietary 3D Sprint software for polymer systems. The transaction is set to close in the fourth quarter of 2025.
- In August 2025, EnvisionTEC (ETEC), a longstanding leader in polymer 3D printing, was acquired by Anzu Partners, a U.S. industrial technology investment firm. The acquisition, approved by a U.S. court, ensures stability across operations and is designed to provide continued reliable service to EnvisionTEC’s customers and suppliers. Anzu Partners has promised continuity in collaboration and operations throughout the transition.
- In July 2025, Stratasys acquired a collection of assets from Nexa3D to expand its additive manufacturing capabilities as the company aims to strengthen its position in production 3D printing and broaden its technology portfolio. Meanwhile, in March 2025, Stratasys launched AIS™ Antero® 800NA and AIS™ Antero 840CN03—advanced composite materials for its Stratasys F900® platform.
- In September 2025, EOS (Electro Optical Systems) was selected by Ursa Major, an aerospace and defense company, as their preferred partner for scaling hypersonics and defense production. Ursa Major expanded its investment in EOS metal additive manufacturing by acquiring three new AMCM M 450-4 FLX systems, bringing its EOS fleet to six and positioning itself to scale production at its facility in Ohio.
Report Coverage:
The research report offers an in-depth analysis based on product and end-user segments. It details leading market players, providing an overview of their business, product offerings, investments, revenue streams, and key applications. Additionally, the report includes insights into the competitive environment, SWOT analysis, current market trends, as well as the primary drivers and constraints. Furthermore, it discusses various factors that have driven market expansion in recent years. The report also explores market dynamics, regulatory scenarios, and technological advancements that are shaping the industry. It assesses the impact of external factors and global economic changes on market growth. Lastly, it provides strategic recommendations for new entrants and established companies to navigate the complexities of the market.
Future Outlook:
- Rising use of composite materials in aerospace and automotive manufacturing will enhance industrial adoption.
- Increased focus on recyclable and bio-based composites will strengthen sustainability goals.
- Continuous fiber-reinforced composites will gain more traction for structural applications.
- Technological integration with automation and AI will improve production efficiency.
- Expanding 3D printing applications in healthcare will boost demand for precision composites.
- Growing government support for additive manufacturing will drive R&D funding.
- Collaboration between material developers and OEMs will create high-value innovation ecosystems.
- Emerging markets in Asia Pacific and Latin America will experience strong manufacturing expansion.
- Cost reduction in filament production will improve accessibility for SMEs.
- Strategic mergers and acquisitions will redefine the competitive balance among global players.


