Market Overview:
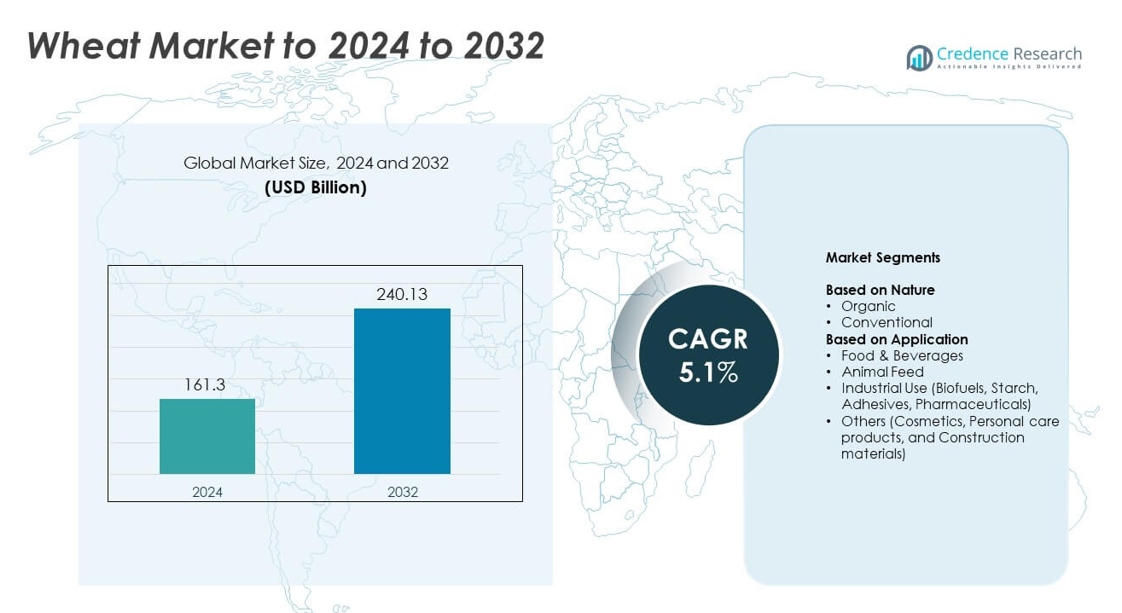
Wheat Market size was valued at USD 161.3 Billion in 2024 and is anticipated to reach USD 240.13 Billion by 2032, at a CAGR of 5.1% during the forecast period.
| REPORT ATTRIBUTE |
DETAILS |
| Historical Period |
2020-2023 |
| Base Year |
2024 |
| Forecast Period |
2025-2032 |
| Wheat Market Size 2024 |
USD 161.3 Billion |
| Wheat Market, CAGR |
5.1% |
| Wheat Market Size 2032 |
USD 240.13 Billion |
The Wheat Market includes major players such as Cargill, Inc., Louis Dreyfus Company, Glencore, Ardent Mills, Bunge, CHS Inc., The Scoular Company, China National Cereals, Oils and Foodstuffs Corporation (COFCO), and Archer-Daniels-Midland (ADM). These companies strengthen global supply through wide grain networks, advanced milling units, and integrated logistics systems. North America leads the market with about 32% share due to strong production and export capacity, followed by Asia Pacific with nearly 34% share driven by high consumption in China and India. Europe holds around 29% share supported by a large milling industry and established wheat-processing infrastructure.
Market Insights
- Wheat Market size reached USD 161.3 Billion in 2024 and is projected to hit USD 240.13 Billion by 2032, expanding at a CAGR of 5.1%.
- Rising consumption of bakery goods, noodles, and ready meals drives strong demand, with the food and beverages segment holding about 72% share in 2024.
- Trends include the growing shift toward whole grain, fortified, and specialty wheat products, along with wider adoption of precision farming and climate-resilient seed varieties.
- Competition intensifies as global grain traders expand storage networks, enhance milling efficiency, and adopt digital tools for traceability and supply chain visibility.
- Asia Pacific leads with nearly 34% share, followed by North America at about 32% and Europe at roughly 29%, while Latin America and Middle East & Africa maintain smaller but stable contributions.
Access crucial information at unmatched prices!
Request your sample report today & start making informed decisions powered by Credence Research Inc.!
Download Sample
Market Segmentation Analysis:
By Nature
Conventional wheat held the dominant share in 2024 with about 88% due to large-scale farming, lower production cost, and strong global availability. Farmers preferred conventional wheat because established seed varieties support stable yields across diverse climates. Demand stayed high as major food processors relied on consistent supply for flour, bakery goods, and packaged foods. Organic wheat grew at a steady pace due to rising interest in clean-label foods, but limited certified farmland and higher pricing kept conventional wheat in clear lead.
- For instance, Archer Daniels Midland operated more than 270 processing plants and 420 crop procurement facilities worldwide that handle cereal grains such as wheat for food and feed markets, as a general company description used around and prior to 2022.
By Application
Food and beverages dominated the application segment in 2024 with nearly 72% share, driven by heavy use in bakery products, noodles, pasta, breakfast cereals, and confectionery. Food manufacturers used wheat for its versatile gluten structure that ensures texture, elasticity, and volume in processed foods. Rising demand for packaged bakery items, ready-to-cook meals, and fortified wheat products supported significant consumption. Animal feed and industrial uses expanded, yet food and beverages remained the primary demand center due to strong household and commercial intake worldwide.
- For instance, Ardent Mills supports bakery and packaged food manufacturers through approximately 40 locations across North America, including flour mills, a specialty bakery, a mix facility, and a quinoa processing plant
Key Growth Drivers
Rising demand for staple food products
Global consumption of bakery goods, pasta, noodles, and ready-to-eat meals continues to expand, lifting demand for wheat as a core ingredient. Urban households choose wheat-based foods due to convenience and stable pricing, which strengthens long-term use across markets. Expanding retail chains and wider availability of packaged foods also support steady growth. Many developing regions increase wheat imports to meet rising food needs, making staple food demand a major driver for market expansion.
- For instance, Barilla’s expanded pasta plant and integrated durum mill in Ames, Iowa can produce 200,000 metric tons of dry pasta per year to meet growing wheat-based staple demand.
Expansion of animal feed and industrial applications
Feed producers use wheat as a reliable energy source, especially during price fluctuations in other grains. Growing livestock populations across Asia and the Middle East raise demand for wheat-based feed blends. Industrial sectors boost usage as wheat starch supports adhesives, paper, textiles, and pharmaceuticals. Biofuel units also adopt wheat as a supplementary raw material when crop supply aligns with production needs. This widening industrial footprint strengthens overall growth momentum.
- For instance, Nutreco operates more than 100 production plants in approximately 40 countries that together produce about 9 million tons of animal nutrition products annually, much of it based on grain inputs such as wheat.
Growth of health-focused and fortified wheat products
Consumers prefer whole grain and high-fiber wheat products due to rising awareness of digestive health, weight management, and nutrient intake. Food brands expand fortified flour and specialty wheat lines to meet these needs, increasing market penetration. Demand increases further as governments promote fortified staples in public nutrition programs. Growth in clean-label and minimally processed foods also raises interest in wheat varieties aligned with wellness trends.
Key Trends & Opportunities
Adoption of advanced farming technologies
Precision agriculture, drought-tolerant seeds, and sensor-based irrigation improve wheat yields and reduce input costs. Farmers use satellite mapping and AI-driven tools to optimize planting schedules and soil health, encouraging higher output. These technologies create opportunities for consistent supply in climate-stress regions. Improved storage and handling systems also cut losses and raise overall market efficiency.
- For instance, Bayer’s Climate FieldView digital platform is used on more than 250 million crop acres in over 20 countries, helping farmers optimize input use and yields with detailed field data.
Rising investment in value-added wheat products
Global brands launch premium wheat items such as specialty flours, organic blends, protein-rich mixes, and artisanal bakery goods. Growth in online grocery channels expands access to diversified wheat-based offerings. Food manufacturers focus on innovation to meet changing taste patterns and lifestyle preferences. This shift supports stronger margins and wider product differentiation across markets.
- For instance, Kellogg documented its total food produced volume as 2,517,956 tonnes across its global manufacturing sites in 2019, reflecting the scale of its grain-based value-added product portfolio.
Growing sustainability initiatives in wheat production
Producers adopt low-carbon farming, regenerative soil practices, and reduced chemical use to align with global sustainability goals. Certification programs create new opportunities for premium pricing in eco-conscious markets. Supply chains integrate traceability solutions to strengthen transparency for buyers. These trends support long-term value creation and help minimize environmental impact.
Key Challenges
High climate vulnerability in major producing regions
Extreme temperatures, droughts, and irregular rainfall patterns reduce crop yields and disrupt supply cycles. Key producing regions face rising weather uncertainty that challenges both planting and harvesting timelines. Climate stress raises production risks and sharpens price volatility for global buyers. Limited irrigation infrastructure in developing regions further amplifies exposure to yield losses.
Volatile global trade policies and supply disruptions
Export restrictions, tariff shifts, and geopolitical tensions affect wheat flows across major markets. Import-dependent countries face supply instability when large producers revise trade rules or stock policies. Logistics constraints, freight cost spikes, and port delays further pressure global supply chains. Such disruptions affect pricing transparency and hinder predictable procurement planning for food and feed industries.
Regional Analysis
North America
North America held about 32% share in 2024, supported by strong production in the United States and Canada. The region benefits from advanced farming systems, high-yield seed varieties, and large-scale export capacity. Food processors drive steady demand due to extensive usage in bakery goods, cereals, and packaged foods. Growing adoption of precision agriculture improves output reliability and reduces production risk. Trade flows remain stable as the U.S. continues as a major global supplier. Rising interest in whole grain and fortified wheat products also strengthens domestic consumption across retail and foodservice channels.
Europe
Europe accounted for nearly 29% share in 2024, driven by strong production in countries such as Russia, France, and Germany. The region maintains a large milling industry that supports demand from bakery, pasta, and confectionery sectors. Sustainability programs encourage low-carbon farming and certified wheat varieties, adding value in premium markets. Stable consumer preference for wheat-based foods keeps domestic consumption high. Export activity remains significant, especially from Eastern Europe, which supplies major global buyers. Ongoing investment in modern grain infrastructure supports efficient handling and storage across key producing nations.
Asia Pacific
Asia Pacific dominated the market with about 34% share in 2024 due to rising consumption in China, India, and Southeast Asia. Population growth, urbanization, and expanding food processing industries lift demand for wheat-based staples such as noodles, bakery goods, and ready meals. Import dependence remains high in several countries, creating strong trade activity across regional ports. Governments support wheat supply through strategic reserves and milling capacity expansion. Rapid growth in packaged foods and bakery chains further strengthens demand. Advancements in high-yield varieties also help improve domestic output in key growing regions.
Latin America
Latin America held around 3% share in 2024, with Argentina and Brazil leading production. Argentina plays a key role as a major exporter due to favorable climate conditions and strong milling capabilities. Regional demand grows with expanding bakery, snack, and foodservice sectors. Currency shifts and trade policies influence export competitiveness across markets. Investments in modern storage, logistics, and quality testing improve supply stability. Rising adoption of advanced farming techniques helps optimize yield potential. Wheat consumption also increases in urban areas as packaged food trends expand across developing economies.
Middle East & Africa
Middle East & Africa captured about 2% share in 2024, driven mainly by high import dependence across Gulf countries and North Africa. Limited arable land and water scarcity reduce domestic production, making the region reliant on suppliers from North America, Europe, and the Black Sea. Demand rises with growing populations, expanding bakery sectors, and increased consumption of wheat-based staples. Governments maintain large strategic reserves to ensure food security. Milling capacity upgrades, port expansions, and grain storage improvements enhance supply reliability. Market growth continues as urban diets shift toward packaged and processed wheat products.
Market Segmentations:
By Nature
By Application
- Food & Beverages
- Animal Feed
- Industrial Use (Biofuels, Starch, Adhesives, Pharmaceuticals)
- Others (Cosmetics, Personal care products, and Construction materials)
By Geography
- North America
- Europe
- Germany
- France
- U.K.
- Italy
- Spain
- Rest of Europe
- Asia Pacific
- China
- Japan
- India
- South Korea
- South-east Asia
- Rest of Asia Pacific
- Latin America
- Brazil
- Argentina
- Rest of Latin America
- Middle East & Africa
- GCC Countries
- South Africa
- Rest of the Middle East and Africa
Competitive Landscape
The Wheat Market features key players such as Cargill, Inc., Louis Dreyfus Company, Glencore, Ardent Mills, Bunge, CHS Inc., The Scoular Company, China National Cereals, Oils and Foodstuffs Corporation (COFCO), and Archer-Daniels-Midland (ADM). Major companies strengthen their position by expanding grain origination networks, upgrading milling infrastructure, and investing in advanced quality-control systems. Leading exporters enhance logistics capabilities to support stable global supply, while processors focus on product consistency to meet rising demand from bakery, packaged food, and industrial sectors. Firms adopt digital tools for traceability, real-time inventory tracking, and predictive commodity planning to improve operational efficiency. Partnerships with farmers and storage operators help secure long-term raw material access and reduce volatility risks. Sustainability initiatives, including regenerative farming and reduced-emission transport, gain traction as companies align with global environmental goals. Together, these strategies drive competitiveness and support steady growth across international wheat supply chains.
Shape Your Report to Specific Countries or Regions & Enjoy 30% Off!
Key Player Analysis
- Cargill, Inc.
- Louis Dreyfus Company
- Glencore
- Ardent Mills
- Bunge
- CHS Inc.
- The Scoular Company
- China National Cereals, Oils and Foodstuffs Corporation (COFCO)
- Archer-Daniels-Midland (ADM)
Recent Developments
- In 2025, Cargill inaugurated a new corn milling plant in Gwalior, India, aimed at meeting growing demand for starch derivatives used across confectionery, infant formula, and dairy industries.
- In 2025, Bunge Global completed a significant merger with grain handler Viterra in July, enhancing its grain export and oilseed processing capacity, particularly in the U.S., Canada, and Australia.
- In 2025, LDC completed the acquisition of grain and oilseed activities in Hungary and parts of Poland from Viterra, strengthening its European presence in grain origination, processing, and distribution.
Report Coverage
The research report offers an in-depth analysis based on Nature, Application and Geography. It details leading market players, providing an overview of their business, product offerings, investments, revenue streams, and key applications. Additionally, the report includes insights into the competitive environment, SWOT analysis, current market trends, as well as the primary drivers and constraints. Furthermore, it discusses various factors that have driven market expansion in recent years. The report also explores market dynamics, regulatory scenarios, and technological advancements that are shaping the industry. It assesses the impact of external factors and global economic changes on market growth. Lastly, it provides strategic recommendations for new entrants and established companies to navigate the complexities of the market.
Future Outlook
- The market will grow steadily as demand for bakery, pasta, and ready meals increases.
- Advancements in high-yield and climate-resistant seed varieties will improve regional output.
- Precision farming tools will enhance efficiency and reduce production risks.
- Governments will expand wheat reserve programs to strengthen food security.
- Demand for whole grain and fortified wheat products will rise with health awareness.
- Milling capacity upgrades will support stronger supply chains in developing regions.
- Import reliance will remain high in Asia and the Middle East as consumption expands.
- Sustainability programs will push farmers toward low-carbon and regenerative practices.
- Wheat-based industrial uses such as starch and biofuels will gain wider adoption.
- Global trade flows will diversify as new exporters strengthen logistics and storage networks.


