Home » Chemicals » Ferric Chloride Market

Ferric Chloride Market By Product Form (Liquid Ferric Chloride, Solid Ferric Chloride, Solution Concentration Variants, Powdered Form); By Application (Water and Wastewater Treatment, Dyes & Pigments Production, Pharmaceutical Synthesis, Metal Etching in Electronics, Surface Treatment of Metals); By Grade (Industrial Grade, Reagent Grade, Food Grade, Pharmaceutical Grade); By End-User Industry (Electronics & Semiconductor Manufacturing, Water Treatment, PCB Manufacturing, Metallurgy, Pharmaceuticals, Chemicals); By Distribution Channel (Direct Sales, Distributors and Wholesalers, Online Retailers, Specialized Chemical Suppliers) – Growth, Share, Opportunities & Competitive Analysis, 2024 – 2032

Report ID: 121712 | Report Format : Excel, PDF

Market Overview

The Ferric Chloride market size was valued at USD 4,560.00 million in 2018 and reached USD 5,322.47 million in 2024. It is anticipated to reach USD 8,231.15 million by 2032, expanding at a CAGR of 5.69% during the forecast period.

REPORT ATTRIBUTE DETAILS
Historical Period 2020-2023
Base Year 2024
Forecast Period 2025-2032
Ferric Chloride Market Size 2024 USD 5,322.47 million
Ferric Chloride Market, CAGR 5.69%
Ferric Chloride Market Size 2032 USD 8,231.15 million


The ferric chloride market is led by major players including Kemira, Tessenderlo Group, PVS Chemicals, BASF, and BorsodChem, alongside regional suppliers such as Malay Sino Chemical Industries, Zhongzheng Chemical, and Gulbrandsen. These companies maintain strong positions through wide product portfolios, global distribution networks, and focus on both industrial-grade and high-purity segments. Asia Pacific emerged as the leading region in 2024, commanding 40% of the global market share, driven by rapid industrialization, large-scale water treatment projects, and expanding electronics manufacturing. Europe followed with 22% share, supported by stringent wastewater regulations, while North America contributed 21%, led by strong demand from municipal treatment facilities and electronics production.

Ferric Chloride Market size

Market Insights

  • The ferric chloride market was valued at USD 5,322.47 million in 2024 and is expected to reach USD 8,231.15 million by 2032, growing at a CAGR of 5.69%.
  • Rising adoption in water and wastewater treatment is the primary driver, supported by stricter environmental regulations and rapid urbanization across developing economies.
  • Key trends include growing demand for high-purity ferric chloride in semiconductor and pharmaceutical applications, along with opportunities in sustainable and eco-friendly water treatment projects worldwide.
  • Competition is moderately consolidated, with global leaders such as Kemira, BASF, Tessenderlo Group, and PVS Chemicals focusing on capacity expansion, strategic partnerships, and customized formulations to maintain market dominance.
  • Asia Pacific leads with a 40% share in 2024, followed by Europe with 22% and North America with 21%, while Latin America, the Middle East, and Africa collectively account for the remaining share, showing steady but smaller growth potential.

Access crucial information at unmatched prices!

Request your sample report today & start making informed decisions powered by Credence Research Inc.!

Download Sample

Market Segmentation Analysis:

By Product Form

The Ferric Chloride market by product form is dominated by liquid ferric chloride, which accounted for the largest revenue share in 2024. Its dominance is driven by extensive use in municipal and industrial water treatment facilities due to easy handling, quick solubility, and cost-effectiveness. Solid ferric chloride is also gaining traction in regions with limited storage infrastructure, while solution concentration variants serve specialized chemical applications. Powdered ferric chloride remains niche but supports laboratory use and small-scale industrial processes. Growing demand for efficient wastewater treatment continues to boost the liquid form segment.

  • For instance, Kemira reported supplying more than 1.2 million tons of ferric chloride annually across Europe by 2022, with a majority in liquid form for municipal water utilities.

By Application

Water and wastewater treatment emerged as the dominant application segment, contributing over 40% of the market share in 2024. The growth is fueled by stricter environmental regulations, rapid urbanization, and rising industrial effluent management requirements. Ferric chloride’s strong coagulation and flocculation properties make it a preferred choice for removing impurities and heavy metals. Beyond this, applications in dyes and pigments, pharmaceutical synthesis, and metal etching in electronics are expanding steadily. Surface treatment of metals also represents a growing segment, particularly within automotive and construction sectors, though it remains secondary to water treatment demand.

  • For instance, BASF produces ferric chloride at its Ludwigshafen site, where the chemical is primarily used for water treatment and catalyst applications. The company’s large-scale manufacturing facilities at this site also produce a wide range of other chemicals for various industries.

By Grade

Industrial grade ferric chloride held the largest share in 2024, driven by widespread adoption across water treatment plants, PCB manufacturing, and metallurgy. Its lower cost and availability make it the preferred choice for bulk applications. Reagent grade is steadily growing due to use in laboratories and research facilities, while pharmaceutical and food grades cater to niche applications with higher purity requirements. Pharmaceutical grade ferric chloride, in particular, supports drug synthesis, but remains limited by regulatory compliance standards. The dominance of industrial grade is expected to continue as global water treatment investments accelerate.

Key Growth Drivers

Expanding Water and Wastewater Treatment Applications

The most significant growth driver for the ferric chloride market is its increasing adoption in water and wastewater treatment. Rising global concerns over water scarcity and pollution have prompted governments and industries to invest heavily in treatment facilities. Ferric chloride is widely used as a coagulant and flocculant, removing impurities, suspended solids, and heavy metals from water. Its cost-effectiveness and proven efficiency compared to alternatives strengthen its position in this segment. Urbanization and industrialization, particularly in Asia-Pacific, continue to fuel demand as municipalities adopt stricter environmental regulations. The expansion of desalination plants and industrial effluent management systems further enhances usage. With water treatment already holding the largest application share, continuous investment in sustainable infrastructure ensures steady market growth. This driver is expected to remain central to demand over the forecast period, supported by public-private partnerships and rising global awareness of clean water access.

  • For instance, Kemira is a significant supplier of various water treatment chemicals, including iron-based coagulants like ferric sulfate and ferric chloride, to municipal water treatment plants in Europe. In 2022, Kemira increased its capacity for these chemicals, and its solutions are used in countries across the continent, such as Germany, France, and the UK, to help customers optimize their water purification processes.

Rising Demand in Electronics and Semiconductor Manufacturing

Another strong driver for the ferric chloride market is its critical role in electronics and semiconductor manufacturing. Ferric chloride is extensively used for etching copper and other metals during the production of printed circuit boards (PCBs), which form the backbone of consumer electronics, automotive electronics, and telecommunication systems. With the rapid adoption of IoT devices, 5G networks, and electric vehicles, the demand for PCBs is growing exponentially. Asia-Pacific, led by China, South Korea, and Taiwan, continues to dominate global semiconductor production, directly boosting ferric chloride consumption. The trend toward miniaturization of electronics and advanced chip designs further necessitates high-purity ferric chloride for precision etching. Moreover, investments in semiconductor supply chain resilience, particularly in the U.S. and Europe, are creating new opportunities for chemical suppliers. As digitalization accelerates, ferric chloride’s role in supporting electronics production remains a long-term growth catalyst.

  • For instance, Ferric chloride is used as a key etchant in the production of printed circuit boards (PCBs). TTM Technologies, a major manufacturer in the industry, utilizes this and other industry-standard practices.

Expanding Role in Pharmaceuticals and Specialty Chemicals

The pharmaceutical sector presents a growing application area for ferric chloride, particularly in drug synthesis and intermediate production. Ferric chloride serves as a catalyst in numerous organic reactions and is also used in preparing iron-based medicines and supplements. Rising global healthcare expenditure, aging populations, and the growing demand for specialty active pharmaceutical ingredients (APIs) are expanding its utilization. The pharmaceutical-grade ferric chloride segment, though smaller in scale, offers higher margins due to strict purity standards. Beyond healthcare, ferric chloride plays a role in specialty chemical synthesis, including dyes, pigments, and surface treatment agents for metals. Growth in construction, automotive coatings, and consumer goods supports these downstream industries. The increasing need for advanced and sustainable chemical processes further amplifies ferric chloride’s importance in specialty sectors. Although regulatory compliance is stringent, these applications provide steady demand growth, diversifying the market beyond traditional water treatment applications.

Ferric Chloride Market share

Key Trend & Opportunity

Shift Toward Sustainable and Eco-Friendly Water Solutions

A major trend shaping the ferric chloride market is the rising emphasis on sustainability in water treatment. Governments and industries are actively seeking eco-friendly solutions to reduce the environmental impact of wastewater discharges. Ferric chloride’s ability to efficiently remove pollutants without generating large volumes of sludge makes it an attractive choice. Growing investment in smart water treatment technologies, including automated dosing systems, enhances the efficiency of ferric chloride usage. Moreover, opportunities exist in regions with underdeveloped water infrastructure, where adoption is expected to grow rapidly as regulations tighten. In addition, ferric chloride aligns with global sustainability goals, such as the UN’s Clean Water and Sanitation initiative, which prioritizes access to safe water. Emerging economies across Asia-Pacific, Latin America, and Africa present untapped potential as urban populations rise and industrial output expands. This trend positions ferric chloride as a key enabler of sustainable water management systems.

  • For instance, Suez uses advanced digital solutions, like its AQUADVANCED® software suite, to optimize its wastewater treatment processes in Europe and around the world, improving efficiency and reducing the use of chemicals.

Growth in High-Purity and Customized Formulations

The demand for high-purity ferric chloride is rising as industries such as pharmaceuticals, semiconductors, and specialty chemicals require stricter quality standards. Customized formulations tailored to specific industrial needs, such as precise concentration levels or reduced impurities, are gaining traction. This trend provides opportunities for chemical manufacturers to differentiate their offerings and capture premium pricing. Pharmaceutical-grade ferric chloride, in particular, is benefiting from the rise of biologics and specialty drugs that rely on complex synthesis processes. In electronics, ultra-pure ferric chloride is critical for advanced semiconductor etching, enabling miniaturization and higher circuit density. Additionally, companies are exploring innovations in packaging, storage, and distribution to extend shelf life and reduce contamination risks. By focusing on specialized applications, producers can expand beyond bulk industrial use and target high-margin markets. This shift toward value-added formulations creates significant opportunities for both established and emerging players in the ferric chloride market.

Key Challenges

Environmental and Health Hazards of Ferric Chloride

One of the major challenges for the ferric chloride market lies in its environmental and health-related risks. Ferric chloride is corrosive and hazardous to handle, requiring strict safety measures during storage, transportation, and usage. Improper handling can cause burns, respiratory irritation, and environmental contamination. Regulatory authorities worldwide impose stringent standards on chemical production, distribution, and disposal, raising operational costs for manufacturers. Waste generated from ferric chloride processes, particularly sludge, also poses treatment and disposal challenges. Environmental activists and policymakers are pushing for safer and greener alternatives, which could limit the long-term adoption of ferric chloride in certain applications. Companies are being forced to invest in safer handling systems, employee training, and waste minimization technologies to comply with regulations. These factors may strain margins and discourage smaller players from entering the market. Addressing sustainability and safety issues remains essential for continued market acceptance.

Price Volatility and Supply Chain Dependence

Another key challenge is the vulnerability of the ferric chloride market to raw material price fluctuations and supply chain disruptions. Ferric chloride is primarily produced from iron ore and chlorine, both of which are subject to volatile pricing due to global demand shifts and geopolitical uncertainties. Rising energy costs also contribute to higher production expenses. Any instability in supply chains, particularly for chlorine gas, can disrupt manufacturing and lead to price surges. Furthermore, the dominance of a few regions in ferric chloride production, such as China, makes global supply dependent on limited sources. Trade restrictions, shipping delays, or environmental crackdowns in these regions could significantly impact availability. This uncertainty challenges end-users, who require stable supply for continuous operations in water treatment and electronics. To overcome this, companies are exploring backward integration, long-term supplier contracts, and regional production expansions, but the risk of volatility remains a pressing concern.

Regional Analysis

North America

North America held a significant position in the ferric chloride market, valued at USD 975.84 million in 2018 and reaching USD 1,115.56 million in 2024. The region is projected to attain USD 1,721.15 million by 2032, growing at a CAGR of 5.7%. In 2024, North America accounted for nearly 21% of the global share, supported by strong demand in municipal water treatment, electronics, and pharmaceuticals. Stringent environmental regulations and rising industrial effluent treatment investments drive market expansion. The U.S. leads regional consumption, with Canada contributing through infrastructure modernization and clean water initiatives.

Europe

Europe represented a key regional market, generating USD 1,071.60 million in 2018 and USD 1,196.35 million in 2024. It is projected to reach USD 1,734.74 million by 2032 at a CAGR of 4.9%. The region commanded around 22% of the global share in 2024, led by Germany, France, and the U.K. Adoption of ferric chloride is driven by advanced wastewater treatment facilities, strict EU environmental standards, and industrial applications such as dyes and surface treatment. The demand for high-purity and reagent grades further supports growth, particularly in the pharmaceutical and specialty chemical industries.

Asia Pacific

Asia Pacific dominates the ferric chloride market, valued at USD 1,834.49 million in 2018 and USD 2,198.96 million in 2024. It is expected to achieve USD 3,618.42 million by 2032, registering the highest CAGR of 6.5%. With a 40% market share in 2024, the region benefits from large-scale water treatment projects, expanding semiconductor manufacturing, and strong demand from chemical industries. China, India, South Korea, and Japan drive growth with rapid urbanization, rising industrial output, and infrastructure investments. The increasing need for sustainable wastewater treatment and electronics manufacturing further reinforces Asia Pacific’s dominant position globally.

Latin America

Latin America’s ferric chloride market stood at USD 320.11 million in 2018 and increased to USD 370.39 million in 2024. It is forecasted to reach USD 535.60 million by 2032, growing at a CAGR of 4.8%. The region accounted for about 7% of the global share in 2024. Brazil and Mexico lead consumption due to growing industrial wastewater treatment requirements and rising chemical production. Government initiatives to expand water treatment facilities are enhancing adoption. Although smaller compared to Asia-Pacific or Europe, the region shows steady growth opportunities in metallurgy and municipal water management.

Middle East

The Middle East ferric chloride market was valued at USD 218.88 million in 2018 and reached USD 242.67 million in 2024. It is expected to attain USD 346.58 million by 2032 at a CAGR of 4.7%. Holding nearly 4% of the global share in 2024, the market is driven by water desalination and wastewater treatment projects, particularly in Saudi Arabia and the UAE. Expansion of chemical and metallurgy sectors also supports demand. Investments in clean water supply to meet rising population needs are fueling consumption, positioning the Middle East as a steady growth contributor.

Africa

Africa recorded USD 139.08 million in 2018 and USD 198.55 million in 2024 in the ferric chloride market. It is projected to reach USD 274.67 million by 2032, reflecting a CAGR of 3.9%. Despite holding only 3% of the global share in 2024, Africa presents growth potential through expanding water treatment infrastructure and urban development. Countries such as South Africa, Nigeria, and Egypt are leading adoption, driven by increasing industrialization and the need for safe drinking water. While growth is moderate compared to other regions, government-led sanitation and clean water projects are creating new opportunities.

Ferric Chloride Market segmentation

Market Segmentations:

By Product Form

  • Liquid Ferric Chloride
  • Solid Ferric Chloride
  • Solution Concentration Variants
  • Powdered Form

By Application

  • Water and Wastewater Treatment
  • Dyes & Pigments Production
  • Pharmaceutical Synthesis
  • Metal Etching in Electronics
  • Surface Treatment of Metals

By Grade

  • Industrial Grade
  • Reagent Grade
  • Food Grade
  • Pharmaceutical Grade

By End-User Industry

  • Electronics & Semiconductor Manufacturing
  • Water Treatment
  • PCB Manufacturing
  • Metallurgy
  • Pharmaceuticals
  • Chemicals

By Distribution Channel

  • Direct Sales
  • Distributors and Wholesalers
  • Online Retailers
  • Specialized Chemical Suppliers

By Geography

  • North America
    • U.S.
    • Canada
    • Mexico
  • Europe
    • UK
    • France
    • Germany
    • Italy
    • Spain
    • Russia
    • Belgium
    • Netherlands
    • Austria
    • Sweden
    • Poland
    • Denmark
    • Switzerland
    • Rest of Europe
  • Asia Pacific
    • China
    • Japan
    • South Korea
    • India
    • Australia
    • Thailand
    • Indonesia
    • Vietnam
    • Malaysia
    • Philippines
    • Taiwan
    • Rest of Asia Pacific
  • Latin America
    • Brazil
    • Argentina
    • Peru
    • Chile
    • Colombia
    • Rest of Latin America
  • Middle East
    • UAE
    • KSA
    • Israel
    • Turkey
    • Iran
    • Rest of Middle East
  • Africa
    • Egypt
    • Nigeria
    • Algeria
    • Morocco
    • Rest of Africa

Competitive Landscape

The ferric chloride market is moderately consolidated, with competition driven by product quality, pricing, and regional presence. Key players such as Kemira, Tessenderlo Group, PVS Chemicals, BorsodChem, and BASF dominate global supply, leveraging strong production capacities and established distribution networks. These companies focus heavily on serving water and wastewater treatment plants, which represent the largest demand segment, while also catering to electronics, metallurgy, and pharmaceuticals. Regional players like Malay Sino Chemical Industries, Sukha Chemical Industries, and Zhongzheng Chemical strengthen their presence in Asia-Pacific, capitalizing on rising industrialization and urban water projects. Companies are actively investing in capacity expansion, technological improvements in purity levels, and sustainable chemical solutions to align with regulatory requirements. Strategic collaborations, acquisitions, and expansion into high-purity ferric chloride for electronics and pharmaceuticals are shaping competition. Continuous innovation in eco-friendly formulations and reliable supply chain management remains critical for maintaining a competitive edge in this evolving market.

Shape Your Report to Specific Countries or Regions & Enjoy 30% Off!

Key Player Analysis

  • Kemira
  • Tessenderlo Group
  • PVS Chemicals
  • BorsodChem
  • Feracid
  • SIDRA Wasserchemie
  • Basic Chemical Industries
  • Chemiflo
  • Gulbrandsen
  • Philbro-Tech
  • Malay Sino Chemical Industries
  • Saf Sulphur Company
  • BASF
  • Sukha Chemical Industries
  • Zhongzheng Chemical

Recent Developments

  • In February 2022, CAC (Chemieanlagenbau Chemnitz) completed the construction of its first Ferric Chloride plant in Kuwait using its proprietary technology. This development marks a significant milestone for the company, as it expands its capabilities in the production of high-quality Ferric Chloride for water treatment applications. The new plant will enhance the local supply of Ferric Chloride, supporting Kuwait’s growing demand for efficient water treatment solutions. This move is expected to strengthen CAC’s presence in the Middle East market and contribute to the region’s environmental sustainability efforts.
  • In January 2022, Renal Business was purchased by Evoqua Water Technologies LLC from the STERIS Group’s Mar Cor Purification and Cantel Medical divisions. The company’s ability to provide tried-and-true water solutions for the healthcare sector in North America was bolstered by the purchase.

Report Coverage

The research report offers an in-depth analysis based on Product Form, Application, Grade, End-User Industry, Distribution Channel and Geography. It details leading market players, providing an overview of their business, product offerings, investments, revenue streams, and key applications. Additionally, the report includes insights into the competitive environment, SWOT analysis, current market trends, as well as the primary drivers and constraints. Furthermore, it discusses various factors that have driven market expansion in recent years. The report also explores market dynamics, regulatory scenarios, and technological advancements that are shaping the industry. It assesses the impact of external factors and global economic changes on market growth. Lastly, it provides strategic recommendations for new entrants and established companies to navigate the complexities of the market.

Future Outlook

  1. The ferric chloride market will continue to expand with steady demand from water treatment.
  2. Industrial-grade ferric chloride will remain the dominant product form due to large-scale applications.
  3. Electronics and semiconductor manufacturing will drive rising demand for high-purity variants.
  4. Pharmaceutical synthesis will grow as specialty drugs and APIs gain global importance.
  5. Asia Pacific will maintain leadership with the fastest growth rate across all regions.
  6. Europe and North America will show stable growth supported by strict environmental norms.
  7. Companies will invest in sustainable and eco-friendly production technologies.
  8. Strategic collaborations and capacity expansions will shape competitive positioning.
  9. Online and specialized distribution channels will expand their role in supply networks.
  10. Regulatory compliance and safety standards will strongly influence market strategies.

CHAPTER NO. 1 :      GENESIS OF THE MARKET           

1.1 Market Prelude – Introduction & Scope

1.2 The Big Picture – Objectives & Vision

1.3 Strategic Edge – Unique Value Proposition

1.4 Stakeholder Compass – Key Beneficiaries

CHAPTER NO. 2 :      EXECUTIVE LENS

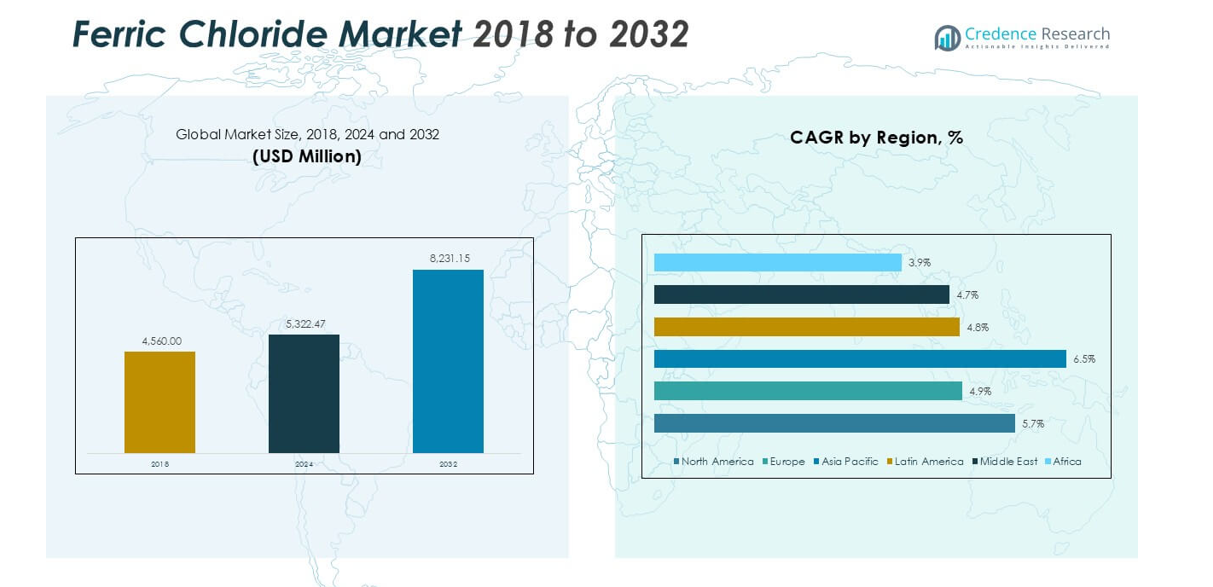
2.1 Pulse of the Industry – Market Snapshot

2.2 Growth Arc – Revenue Projections (USD Million)

2.3. Premium Insights – Based on Primary Interviews  

CHAPTER NO. 3 :      FERRIC CHLORIDE MARKET FORCES & INDUSTRY PULSE

3.1 Foundations of Change – Market Overview
3.2 Catalysts of Expansion – Key Market Drivers
3.2.1 Momentum Boosters – Growth Triggers
3.2.2 Innovation Fuel – Disruptive Technologies
3.3 Headwinds & Crosswinds – Market Restraints
3.3.1 Regulatory Tides – Compliance Challenges
3.3.2 Economic Frictions – Inflationary Pressures
3.4 Untapped Horizons – Growth Potential & Opportunities
3.5 Strategic Navigation – Industry Frameworks
3.5.1 Market Equilibrium – Porter’s Five Forces
3.5.2 Ecosystem Dynamics – Value Chain Analysis
3.5.3 Macro Forces – PESTEL Breakdown

3.6 Price Trend Analysis

3.6.1 Regional Price Trend
3.6.2 Price Trend by product

CHAPTER NO. 4 :      KEY INVESTMENT EPICENTER    

4.1 Regional Goldmines – High-Growth Geographies

4.2 ApplicationFrontiers – Lucrative ApplicationCategories

4.3 ApplicationSweet Spots – Emerging Demand Segments

CHAPTER NO. 5: REVENUE TRAJECTORY & WEALTH MAPPING

5.1 Momentum Metrics – Forecast & Growth Curves

5.2 Regional Revenue Footprint – Market Share Insights

5.3 Segmental Wealth Flow – Product Form & ApplicationRevenue

CHAPTER NO. 6 :      TRADE & COMMERCE ANALYSIS

6.1.      Import Analysis by Region

6.1.1.    Global Ferric Chloride Market Import Revenue By Region

6.2.      Export Analysis by Region

6.2.1.    Global Ferric Chloride Market Export Revenue By Region

CHAPTER NO. 7 :      COMPETITION ANALYSIS 

7.1.      Company Market Share Analysis

7.1.1.    Global Ferric Chloride Market: Company Market Share

7.2.      Global Ferric Chloride Market Company Revenue Market Share

7.3.      Strategic Developments

7.3.1.    Acquisitions & Mergers

7.3.2.    New ApplicationLaunch

7.3.3.    Regional Expansion

7.4.      Competitive Dashboard

7.5.    Company Assessment Metrics, 2024

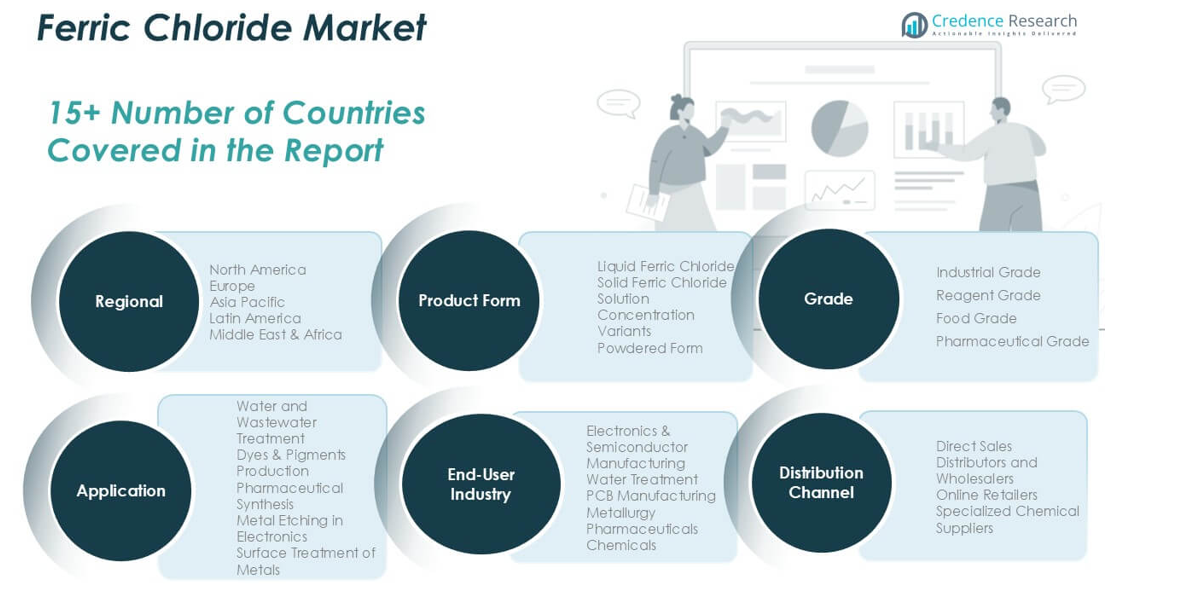
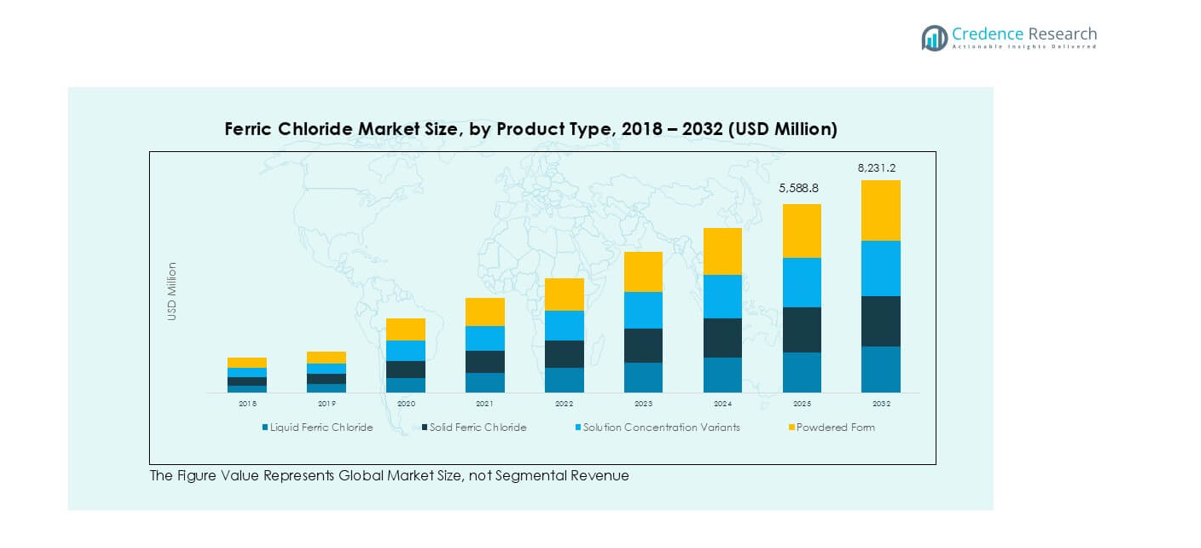
CHAPTER NO. 8 :      FERRIC CHLORIDE MARKET – BY PRODUCT FORM SEGMENT ANALYSIS

8.1.      Ferric Chloride Market Overview by Product Form Segment

8.1.1.    Ferric Chloride Market Revenue Share By Product Form

8.2.      Liquid Ferric Chloride

8.3.      Solid Ferric Chloride

8.4.      Solution Concentration Variants

8.5.      Powdered Form

CHAPTER NO. 9 :      FERRIC CHLORIDE MARKET – BY APPLICATION SEGMENT ANALYSIS

9.1.      Ferric Chloride Market Overview by Application Segment

9.1.1.    Ferric Chloride Market Revenue Share By Application

9.2.      Water and Wastewater Treatment

9.3.      Dyes & Pigments Production

9.4.      Pharmaceutical Synthesis

9.5.      Metal Etching in Electronics

9.6.      Surface Treatment of Metals

CHAPTER NO. 10 :    FERRIC CHLORIDE MARKET – BY GRADE SEGMENT ANALYSIS

10.1.     Ferric Chloride Market Overview by Grade Segment

10.1.1.  Ferric Chloride Market Revenue Share By Grade

10.2.     Industrial Grade

10.3.     Reagent Grade

10.4.     Food Grade

10.5.     Pharmaceutical Grade

CHAPTER NO. 11 :    FERRIC CHLORIDE MARKET – BY END-USER INDUSTRY SEGMENT ANALYSIS

11.1.     Ferric Chloride Market Overview by End-User Industry Segment

11.1.1.  Ferric Chloride Market Revenue Share By End-User Industry

11.2.     Electronics & Semiconductor Manufacturing

11.3.     Water Treatment

11.4.     PCB Manufacturing

11.5.     Metallurgy

11.6.     Pharmaceuticals

11.7.     Chemicals

CHAPTER NO. 12 :    FERRIC CHLORIDE MARKET – BY DISTRIBUTION CHANNEL SEGMENT ANALYSIS

12.1.     Ferric Chloride Market Overview by Distribution Channel Segment

12.1.1.  Ferric Chloride Market Revenue Share By Distribution Channel

12.2.     Direct Sales

12.3.     Distributors and Wholesalers

12.4.     Online Retailers

12.5.     Specialized Chemical Suppliers

CHAPTER NO. 13 :    FERRIC CHLORIDE MARKET – REGIONAL ANALYSIS

13.1.     Ferric Chloride Market Overview by Region Segment

13.1.1.  Global Ferric Chloride Market Revenue Share By Region

13.1.2.  Regions

13.1.3.  Global Ferric Chloride Market Revenue By Region

13.1.4.  Product Form

13.1.5.  Global Ferric Chloride Market Revenue By Product Form

13.1.6.  Application

13.1.7.  Global Ferric Chloride Market Revenue By Application

13.1.8.  Grade

13.1.9.  Global Ferric Chloride Market Revenue By Grade

13.1.10. End-User Industry

13.1.12. Global Ferric Chloride Market Revenue By End-User Industry

13.1.13. Distribution Channel

13.1.14. Global Ferric Chloride Market Revenue By Distribution Channel

CHAPTER NO. 14 :    NORTH AMERICA FERRIC CHLORIDE MARKET – COUNTRY ANALYSIS

14.1.     North America Ferric Chloride Market Overview by Country Segment

14.1.1.  North America Ferric Chloride Market Revenue Share By Region

14.2.     North America

14.2.1.  North America Ferric Chloride Market Revenue By Country

14.2.2.  Product Form

14.2.3.  North America Ferric Chloride Market Revenue By Product Form

14.2.4.  Application

14.2.5.  North America Ferric Chloride Market Revenue By Application

14.2.6.  Grade

14.2.7.  North America Ferric Chloride Market Revenue By Grade

14.2.8.  End-User Industry

14.2.9.  North America Ferric Chloride Market Revenue By End-User Industry

14.2.10. Distribution Channel

14.2.11. North America Ferric Chloride Market Revenue By Distribution Channel

14.3.     U.S.

14.4.     Canada

14.5.     Mexico

CHAPTER NO. 15 :    EUROPE FERRIC CHLORIDE MARKET – COUNTRY ANALYSIS     

15.1.     Europe Ferric Chloride Market Overview by Country Segment

15.1.1.  Europe Ferric Chloride Market Revenue Share By Region

15.2.     Europe

15.2.1.  Europe Ferric Chloride Market Revenue By Country

15.2.2.  Product Form

15.2.3.  Europe Ferric Chloride Market Revenue By Product Form

15.2.4.  Application

15.2.5.  Europe Ferric Chloride Market Revenue By Application

15.2.6.  Grade

15.2.7.  Europe Ferric Chloride Market Revenue By Grade

15.2.8.  End-User Industry

15.2.9.  Europe Ferric Chloride Market Revenue By End-User Industry

15.2.10. Distribution Channel

15.2.11. Europe Ferric Chloride Market Revenue By Distribution Channel

15.3.     UK

15.4.     France

15.5.     Germany

15.6.     Italy

15.7.     Spain

15.8.     Russia

15.9.   Rest of Europe

CHAPTER NO. 16 :    ASIA PACIFIC FERRIC CHLORIDE MARKET – COUNTRY ANALYSIS

16.1.     Asia Pacific Ferric Chloride Market Overview by Country Segment

16.1.1.  Asia Pacific Ferric Chloride Market Revenue Share By Region

16.2.     Asia Pacific

16.2.1.  Asia Pacific Ferric Chloride Market Revenue By Country

16.2.2.  Product Form

16.2.3.  Asia Pacific Ferric Chloride Market Revenue By Product Form

16.2.4.  Application

16.2.5.  Asia Pacific Ferric Chloride Market Revenue By Application

16.2.6.  Grade

16.2.7.  Asia Pacific Ferric Chloride Market Revenue By Grade

16.2.8.  End-User Industry

16.2.9.  Asia Pacific Ferric Chloride Market Revenue By End-User Industry

16.2.10. Distribution Channel

16.2.11. Asia Pacific Ferric Chloride Market Revenue By Distribution Channel

16.3.     China

16.4.     Japan

16.5.     South Korea

16.6.     India

16.7.     Australia

16.8.     Southeast Asia

16.9.     Rest of Asia Pacific

CHAPTER NO. 17 :    LATIN AMERICA FERRIC CHLORIDE MARKET – COUNTRY ANALYSIS

17.1.     Latin America Ferric Chloride Market Overview by Country Segment

17.1.1.  Latin America Ferric Chloride Market Revenue Share By Region

17.2.     Latin America

17.2.1.  Latin America Ferric Chloride Market Revenue By Country

17.2.2.  Product Form

17.2.3.  Latin America Ferric Chloride Market Revenue By Product Form

17.2.4.  Application

17.2.5.  Latin America Ferric Chloride Market Revenue By Application

17.2.6.  Grade

17.2.7.  Latin America Ferric Chloride Market Revenue By Grade

17.2.8.  End-User Industry

17.2.9.  Latin America Ferric Chloride Market Revenue By End-User Industry

17.2.10. Distribution Channel

17.2.11. Latin America Ferric Chloride Market Revenue By Distribution Channel

17.3.     Brazil

17.4.     Argentina

17.5.     Rest of Latin America

CHAPTER NO. 18 :    MIDDLE EAST FERRIC CHLORIDE MARKET – COUNTRY ANALYSIS

18.1.     Middle East Ferric Chloride Market Overview by Country Segment

18.1.1.  Middle East Ferric Chloride Market Revenue Share By Region

18.2.     Middle East

18.2.1.  Middle East Ferric Chloride Market Revenue By Country

18.2.2.  Product Form

18.2.3.  Middle East Ferric Chloride Market Revenue By Product Form

18.2.4.  Application

18.2.5.  Middle East Ferric Chloride Market Revenue By Application

18.2.6.  Grade

18.2.7.  Middle East Ferric Chloride Market Revenue By Grade

18.2.8.  End-User Industry

18.2.9.  Middle East Ferric Chloride Market Revenue By End-User Industry

18.2.10. Distribution Channel

18.2.11. Middle East Ferric Chloride Market Revenue By Distribution Channel

18.3.     GCC Countries

18.4.     Israel

18.5.     Turkey

18.6.     Rest of Middle East

CHAPTER NO. 19 :    AFRICA FERRIC CHLORIDE MARKET – COUNTRY ANALYSIS

19.1.     Africa Ferric Chloride Market Overview by Country Segment

19.1.1.  Africa Ferric Chloride Market Revenue Share By Region

19.2.     Africa

19.2.1.  Africa Ferric Chloride Market Revenue By Country

19.2.2.  Product Form

19.2.3.  Africa Ferric Chloride Market Revenue By Product Form

19.2.4.  Application

19.2.5.  Africa Ferric Chloride Market Revenue By Application

19.2.6.  Grade

19.2.7.  Africa Ferric Chloride Market Revenue By Grade

19.2.8.  End-User Industry

19.2.9.  Africa Ferric Chloride Market Revenue By End-User Industry

19.2.10. Distribution Channel

19.2.11. Africa Ferric Chloride Market Revenue By Distribution Channel

19.3.     South Africa

19.4.     Egypt

19.5.     Rest of Africa

CHAPTER NO. 20 :    COMPANY PROFILES         

20.1.     Kemira

20.1.1.  Company Overview

20.1.2.  ApplicationPortfolio

20.1.3.  Financial Overview

20.1.4.  Recent Developments

20.1.5.  Growth Strategy

20.1.6.  SWOT Analysis

20.2.     Tessenderlo Group

20.3.     PVS Chemicals

20.4.     BorsodChem

20.5.     Feracid

20.6.     SIDRA Wasserchemie

20.7.     Basic Chemical Industries

20.8.     Chemiflo

20.9.     Gulbrandsen

20.10.   Philbro-Tech

20.11.   Malay Sino Chemical Industries

20.12.   Saf Sulphur Company

20.13.   BASF

20.14.   Sukha Chemical Industries

20.15.   Zhongzheng Chemical

Request Free Sample

We prioritize the confidentiality and security of your data. Our promise: your information remains private.

Ready to Transform Data into Decisions?

Request Your Sample Report and Start Your Journey of Informed Choices


Providing the strategic compass for industry titans.

cr-clients-logos

Frequently Asked Questions

What is the current market size for Ferric Chloride, and what is its projected size in 2032?

The market size reached USD 5,322.47 million in 2024 and is projected at USD 8,231.15 million by 2032.

At what Compound Annual Growth Rate is the Ferric Chloride market projected to grow between 2024 and 2032?

The Ferric Chloride Market is expected to grow at a CAGR of 5.69% during the forecast period from 2024 to 2032.

What are the primary factors fueling the growth of the Ferric Chloride market?

Key growth factors include increasing adoption in water and wastewater treatment, stricter environmental regulations, and expanding applications in electronics for printed circuit board etching.

Who are the leading companies in the Ferric Chloride market?

Leading companies include Chemifloc, BPS Products Pvt. Ltd., PVS Chemicals, Kemira, and Tessenderlo Group.

About Author

Shweta Bisht

Shweta Bisht

Healthcare & Biotech Analyst

Shweta is a healthcare and biotech researcher with strong analytical skills in chemical and agri domains.

View Profile

Related Reports

Epoxy Composite Market

Epoxy Composite Market size was valued USD 36074.5 million in 2024 and is anticipated to reach USD 52052.54 million by 2032, at a CAGR of 4.69% during the forecast period.

Epoxy Curing Agents Market

Epoxy Curing Agents Market size was valued USD 3714.5 million in 2024 and is anticipated to reach USD 5282.39 million by 2032, at a CAGR of 4.5% during the forecast period.

Epoxy Grouts Market

Epoxy Grouts Market size was valued USD 1574.5 million in 2024 and is anticipated to reach USD 2511.81 million by 2032, at a CAGR of 6.9% during the forecast period.

Epoxy Surface Coatings Market

Epoxy Surface Coatings Market size was valued USD 38374.5 million in 2024 and is anticipated to reach USD 66503.13 million by 2032, at a CAGR of 6.3% during the forecast period.

Flat Glass Coatings Market

The Flat Glass Coatings Market was valued at USD 2.6 billion in 2024 and is projected to reach USD 11.18 billion by 2032, expanding at a CAGR of 20% during the forecast period.

Hypochlorous Acid Market

The Hypochlorous Acid Market size was valued at USD 5.58 Billion in 2024 and is anticipated to reach USD 7.56 Billion by 2032, at a CAGR of 3.85% during the forecast period.

Glass Bonding Adhesives Market

The Glass Bonding Adhesives Market size was valued at USD 4.08 Billion in 2024 and is anticipated to reach USD 6.24 Billion by 2032, at a CAGR of 5.46% during the forecast period.

Food Coating Ingredients Market

The Food Coating Ingredients Market size was valued at USD 5.17 billion in 2024 and is anticipated to reach USD 8.56 billion by 2032, at a CAGR of 6.5% during the forecast period.

Food Can Coatings Market

The Food Can Coatings Market size was valued at USD 4.55 Billion in 2024 and is anticipated to reach USD 5.68 Billion by 2032, at a CAGR of 2.8% during the forecast period.

Functional Fluids Market

Functional Fluids Market size was valued at USD 48.11 Billion in 2024 and is anticipated to reach USD 64.54 Billion by 2032, at a CAGR of 3.74% during the forecast period.

U.S. Quartz Sleeve Market

U.S. Quartz Sleeve Market size was valued at USD 650.87 million in 2018, reached USD 687.51 million in 2024, and is anticipated to reach USD 1,089.08 million by 2032, at a CAGR of 5.92% during the forecast period.

Vapor Barriers Market

The Vapor Barriers Market size was valued at USD 14.73 billion in 2024 and is anticipated to reach USD 22.08 billion by 2032, at a CAGR of 5.19% during the forecast period (2024-2032).

Licence Option

The report comes as a view-only PDF document, optimized for individual clients. This version is recommended for personal digital use and does not allow printing. Use restricted to one purchaser only.
$4999

To meet the needs of modern corporate teams, our report comes in two formats: a printable PDF and a data-rich Excel sheet. This package is optimized for internal analysis. Unlimited users allowed within one corporate location (e.g., regional office).
$6999

The report will be delivered in printable PDF format along with the report’s data Excel sheet. This license offers 100 Free Analyst hours where the client can utilize Credence Research Inc. research team. Permitted for unlimited global use by all users within the purchasing corporation, such as all employees of a single company.
$12999

Report delivery within 24 to 48 hours

Credence Staff 3

WILLIAM, North America

Support Staff at Credence Research

KEITH PHILLIPS, Europe

Lee - CR Sales Staff

LEE VALLANCE, Asia Pacific

Kieran Jameson

KIERAN JAMESON, Australia

Smallform of Sample request
User Review

Thank you for the data! The numbers are exactly what we asked for and what we need to build our business case.

Materials Scientist
(privacy requested)

User Review

The report was an excellent overview of the Industrial Burners market. This report does a great job of breaking everything down into manageable chunks.

Imre Hof
Management Assistant, Bekaert

cr-clients-logos

Request Sample