Market Overview
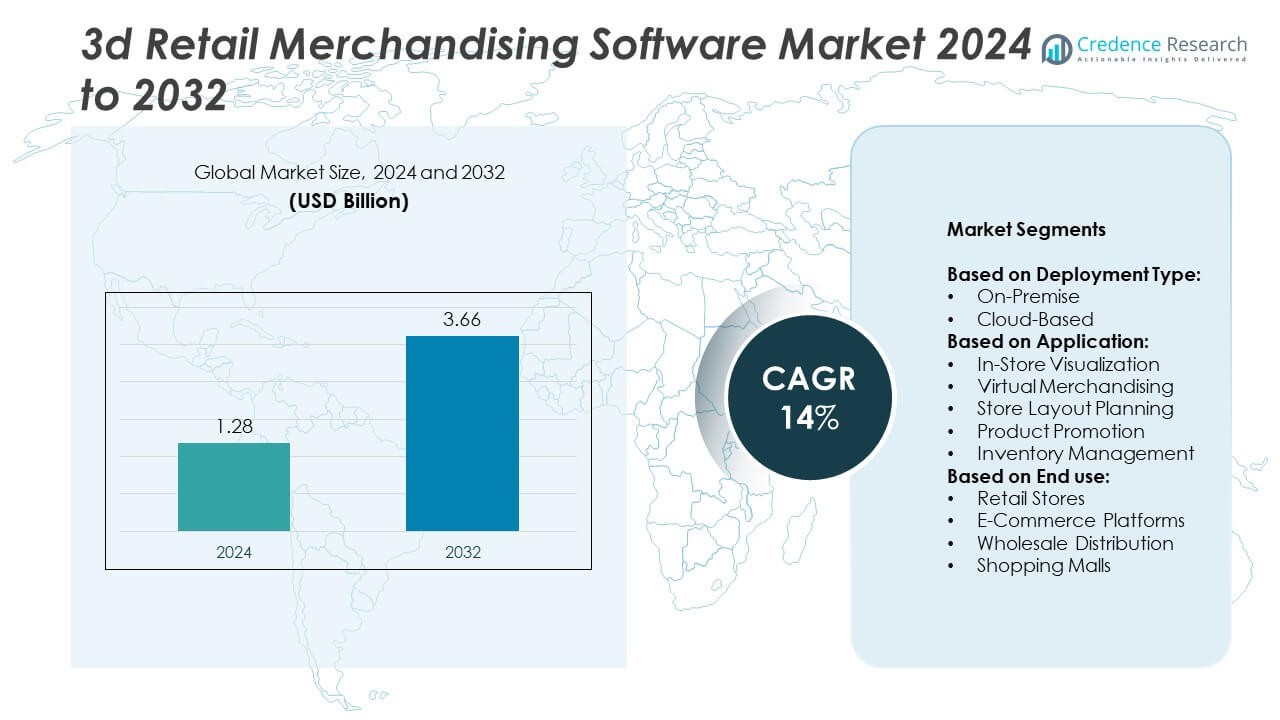
3D Retail Merchandising Software market size was valued at USD 1.28 billion in 2024 and is anticipated to reach USD 3.66 billion by 2032, at a CAGR of 14% during the forecast period.
| REPORT ATTRIBUTE |
DETAILS |
| Historical Period |
2020-2023 |
| Base Year |
2024 |
| Forecast Period |
2025-2032 |
| 3D Retail Merchandising Software Market Size 2024 |
USD 1.28 Billion |
| 3D Retail Merchandising Software Market, CAGR |
14% |
| 3D Retail Merchandising Software Market Size 2032 |
USD 3.66 Billion |
The 3D retail merchandising software market is shaped by major players such as Autodesk, Epic Games, Unity Technologies, Siemens, Oracle, SAP, INFOR, NVIDIA, Adobe, Cin7, PTC, TIBCO Software, Smart and Final, and 3D Inventory. These companies focus on developing cloud-based and AI-driven solutions that enhance visualization, automate planograms, and improve collaboration for retailers. Strategic partnerships with retail chains and e-commerce platforms help expand their reach and meet diverse end-use demands. North America leads the market with over 35% share in 2024, supported by strong digital transformation initiatives and early adoption of AR/VR-enabled merchandising tools.
Access crucial information at unmatched prices!
Request your sample report today & start making informed decisions powered by Credence Research Inc.!
Download Sample
Market Insights
- The 3D retail merchandising software market was valued at USD 1.28 billion in 2024 and is projected to reach USD 3.66 billion by 2032, growing at a CAGR of 14%.
- Rising demand for immersive shopping experiences, faster store rollouts, and omnichannel retail integration are the key drivers fueling market expansion.
- Integration of AI, AR, and VR technologies is a major trend, enabling real-time layout optimization, predictive merchandising, and virtual store prototyping.
- The competitive landscape is marked by innovation, with players focusing on cloud-based platforms, subscription pricing, and analytics-driven merchandising solutions.
- North America leads with over 35% share, followed by Europe with more than 25%, while Asia Pacific is the fastest-growing region; cloud-based deployment dominates with over 60% share.
Market Segmentation Analysis:
By Deployment Type
Cloud-based deployment dominates the 3D retail merchandising software market, holding over 60% share in 2024. Its leadership is driven by scalability, faster implementation, and lower upfront costs compared to on-premise solutions. Retailers prefer cloud-based platforms for their ability to enable real-time updates, remote access, and seamless integration with omnichannel strategies. Growing demand for centralized data management and enhanced collaboration across store networks further supports this segment’s growth. On-premise solutions still serve large enterprises with strict data control needs but are gradually losing share as retailers shift toward subscription-based, flexible cloud models.
- For instance, Lowe’s built digital twins for 1,700 stores and updates them several times daily.
By Application
In-store visualization is the leading application segment, accounting for more than 35% share in 2024. Retailers prioritize realistic 3D visualizations to optimize product placement, improve shopper engagement, and boost sales conversions. This segment benefits from the rising adoption of immersive technologies like AR and VR to create interactive store experiences. Virtual merchandising and store layout planning follow closely, driven by the need to reduce design errors and speed up store rollouts. Product promotion and inventory management applications are gaining traction as retailers integrate merchandising software with marketing and supply chain analytics for improved operational efficiency.
- For instance, In 2018, Macy’s partnered with 3D Cloud (then known as Marxent’s 3D Cloud) to roll out its VR room planner to approximately 70 U.S. stores.
By End Use
Retail stores represent the largest end-use segment, capturing over 50% share in 2024. Brick-and-mortar outlets rely heavily on 3D retail merchandising software to create visually appealing layouts and enhance customer experience. The segment’s dominance is supported by the continued investment of global retail chains in experiential store formats and data-driven merchandising strategies. E-commerce platforms are rapidly growing users, leveraging 3D visualization to improve online product presentation and reduce return rates. Wholesale distribution and shopping malls also adopt these solutions to streamline inventory planning and optimize tenant store layouts for better space utilization and revenue generation.
Key Growth Drivers
Rising Demand for Immersive Shopping Experiences
Growing customer preference for interactive and engaging retail experiences is a major driver. Retailers are investing in 3D visualization tools to create realistic product displays and virtual store tours that improve shopper engagement and boost conversion rates. Technologies like AR and VR allow customers to visualize products before purchase, reducing return rates and enhancing satisfaction. This demand pushes retailers to adopt 3D retail merchandising software as a strategic tool to compete with e-commerce platforms and provide differentiated, experience-driven physical and digital shopping environments.
- For instance, Sephora Virtual Artist logged over 200 million shade try-ons and 8.5 million feature visits by 2018.
Omnichannel Retail Expansion
The shift toward omnichannel strategies is another significant growth driver for the market. Retailers need seamless integration of online and offline channels to provide consistent customer experiences. 3D merchandising software enables unified design across stores and digital platforms, allowing synchronized promotions, layouts, and inventory management. This helps brands maintain consistency, enhance operational efficiency, and speed up decision-making processes. The demand for data-driven merchandising insights from multiple sales channels further fuels adoption, especially among global retailers seeking scalability and quick adaptation to changing consumer behavior.
- For instance, Inditex operated RFID in over 700 Zara stores during its global rollout phase.
Cost Optimization and Faster Time-to-Market
Retailers face increasing pressure to reduce operational costs and accelerate store rollouts. 3D retail merchandising software helps achieve these goals by enabling virtual prototyping, minimizing design errors, and reducing physical mock-up costs. Companies can plan store layouts digitally, simulate product arrangements, and optimize space utilization before implementation. This lowers capital expenditure and shortens the time required to launch new store formats or redesigns. As competition intensifies, retailers see 3D merchandising tools as essential to maintain profitability while meeting evolving consumer expectations quickly and efficiently.
Key Trends & Opportunities
Integration with AI and Predictive Analytics
A key trend shaping the market is the integration of AI and predictive analytics into 3D merchandising software. Retailers leverage AI to analyze shopper behavior, predict product performance, and automate planogram adjustments for better sales outcomes. Machine learning models help optimize store layouts dynamically, ensuring high-performing products receive maximum visibility. This shift toward data-driven decision-making improves merchandising efficiency and drives incremental revenue. The combination of AI and 3D visualization provides retailers with actionable insights and strengthens their ability to adapt to rapidly changing consumer preferences.
- For instance, as of early 2025, H&M operated approximately 4,253 stores globally as part of its strategy to optimize its physical retail network by focusing on key locations. Concurrently, the company is significantly expanding its use of AI for merchandising, to improve demand forecasting and inventory management, as well as for other applications like generative AI for marketing and AI-powered supply chain optimization.
Growth of E-Commerce and Virtual Stores
An important opportunity lies in the rapid growth of e-commerce platforms and virtual stores. Brands are adopting 3D merchandising solutions to enhance online product visualization, enabling shoppers to interact with products virtually. This improves buying confidence and reduces return rates, a critical challenge in online retail. The rise of metaverse initiatives and virtual showrooms also creates new revenue streams, allowing brands to showcase collections digitally to global customers. This opportunity is especially attractive for retailers with limited physical presence seeking to expand reach cost-effectively.
- For instance, In February 2024, Walmart launched its optical virtual try-on (VTO) feature with an initial offering of 750 eyewear styles. By May 2025, the company had expanded its selection to offer over 1,700 styles through the VTO feature. This was part of a broader expansion of its optical business, which included growing its network of Vision Centers across the U.S.
Key Challenges
High Implementation Costs
One of the primary challenges for market adoption is the high initial cost of implementation. Developing or deploying 3D retail merchandising software often requires significant investment in hardware, software licenses, and employee training. Small and mid-sized retailers may find these costs prohibitive, slowing adoption rates. While cloud-based solutions offer lower upfront expenses, integration with existing enterprise systems can still be complex and costly. This cost barrier can delay decision-making and limit the ability of smaller players to compete with large retail chains already using advanced visualization tools.
Data Security and Privacy Concerns
Data security remains a major concern for retailers adopting 3D merchandising platforms. These solutions require collecting and storing sensitive customer data, including behavioral patterns and store analytics. Any data breach could lead to reputational damage and regulatory penalties, particularly under stringent data protection laws like GDPR. Retailers must invest in secure infrastructure and robust compliance measures, which can increase overall implementation costs. This challenge may discourage risk-averse companies from fully adopting advanced digital tools, slowing market penetration despite clear operational benefits.
Regional Analysis
North America
North America holds over 35% share of the 3D retail merchandising software market in 2024, leading global adoption. The region benefits from strong presence of major retail chains and early adoption of advanced visualization technologies. High investment in digital transformation by players in the U.S. and Canada supports growth. Retailers leverage 3D solutions to enhance customer experience and streamline store operations. Integration with AI and analytics tools is widely adopted, driving higher efficiency. The growing demand for omnichannel strategies and virtual store layouts continues to fuel market expansion across North America.
Europe
Europe accounts for more than 25% market share, driven by rapid digitalization of retail operations. Countries like Germany, the U.K., and France lead adoption with focus on sustainable and efficient store design. Retailers use 3D software to optimize layouts, reduce material waste, and improve compliance with regional regulations. Growth is supported by expansion of experiential retail formats and increased use of virtual merchandising in fashion and grocery sectors. European brands also invest in AR-enabled solutions to strengthen customer engagement, making the region a strong contributor to global market growth.
Asia Pacific
Asia Pacific is the fastest-growing region, holding over 20% share in 2024 and showing significant potential. Rapid urbanization, rising retail investments, and strong e-commerce penetration drive demand for 3D merchandising solutions. China, Japan, and India lead adoption, with retailers focusing on digital-first strategies and interactive shopping experiences. Increasing popularity of virtual stores and adoption of cloud-based platforms support scalability for regional players. Growth is further fueled by increasing smartphone penetration, which enhances consumer interaction with 3D-enabled product displays. Asia Pacific is expected to capture higher market share over the forecast period.
Latin America
Latin America represents nearly 10% of the global market share in 2024, supported by modernization of retail infrastructure. Brazil and Mexico are the key contributors, with retailers adopting 3D solutions to improve store planning and reduce operational costs. Rising investment in e-commerce and omnichannel retail strategies fuels adoption of visualization software. Growing middle-class population and increasing demand for organized retail formats encourage adoption of technology-driven merchandising solutions. Although growth is slower than Asia Pacific, improving internet penetration and cloud adoption create long-term opportunities for regional market expansion.
Middle East and Africa
Middle East and Africa hold under 10% share but present steady growth opportunities for the market. The region is witnessing increasing investments in retail infrastructure, especially in the UAE and Saudi Arabia. Retailers adopt 3D software to create visually appealing layouts in malls and hypermarkets, attracting tech-savvy customers. Growing tourism and luxury retail sectors contribute to demand for immersive store experiences. Limited awareness and higher implementation costs remain challenges, but rising digitalization initiatives and government support for smart city projects are likely to accelerate adoption in the coming years.
Market Segmentations:
By Deployment Type:
By Application:
- In-Store Visualization
- Virtual Merchandising
- Store Layout Planning
- Product Promotion
- Inventory Management
By End use:
- Retail Stores
- E-Commerce Platforms
- Wholesale Distribution
- Shopping Malls
By Geography:
- North America
- Europe
- Germany
- France
- U.K.
- Italy
- Spain
- Rest of Europe
- Asia Pacific
- China
- Japan
- India
- South Korea
- South-east Asia
- Rest of Asia Pacific
- Latin America
- Brazil
- Argentina
- Rest of Latin America
- Middle East & Africa
- GCC Countries
- South Africa
- Rest of the Middle East and Africa
Competitive Landscape
Key players in the 3D retail merchandising software market include Autodesk, Epic Games, Unity Technologies, Siemens, Cin7, Smart and Final, TIBCO Software, PTC, Adobe, Oracle, SAP, INFOR, NVIDIA, and 3D Inventory. The competitive landscape is characterized by continuous innovation and strategic partnerships to enhance software capabilities and user experience. Companies focus on developing scalable, cloud-based platforms that support real-time collaboration and integration with analytics tools. Many vendors are investing in AI-driven features, AR/VR visualization, and predictive merchandising to meet the growing demand for immersive retail experiences. Strategic collaborations with retailers and e-commerce platforms enable providers to expand their global footprint and address diverse end-use requirements. Pricing strategies often emphasize subscription models, making solutions accessible to mid-sized retailers and driving adoption across multiple geographies. Market players also focus on training and support services, ensuring seamless implementation and driving customer loyalty in a highly competitive environment.
Shape Your Report to Specific Countries or Regions & Enjoy 30% Off!
Key Player Analysis
- Autodesk
- Epic Games
- Unity Technologies
- Siemens
- Cin7
- Smart and Final
- TIBCO Software
- PTC
- Adobe
- Oracle
- SAP
- INFOR
- NVIDIA
- 3D Inventory
Recent Developments
- In 2025, Siemens launched “Siemens for Startups,” supporting advanced 3D technologies including manufacturing and 3D printing that influence retail products and merchandising solutions.
- In 2025, Cin7 unveiled AI-driven product updates and enhanced Shopify integration to help SMB retailers scale smarter with better inventory and merchandising software.
- In 2024, Unity offers a suite of XR tools supporting AR/VR retail experiences including 3D product configurators, virtual showrooms, and store layout simulations to enhance retail merchandising.
Report Coverage
The research report offers an in-depth analysis based on Deployment Type, Application, End-Use and Geography. It details leading market players, providing an overview of their business, product offerings, investments, revenue streams, and key applications. Additionally, the report includes insights into the competitive environment, SWOT analysis, current market trends, as well as the primary drivers and constraints. Furthermore, it discusses various factors that have driven market expansion in recent years. The report also explores market dynamics, regulatory scenarios, and technological advancements that are shaping the industry. It assesses the impact of external factors and global economic changes on market growth. Lastly, it provides strategic recommendations for new entrants and established companies to navigate the complexities of the market.
Future Outlook
- The market will see rapid adoption of AI-driven predictive merchandising for real-time layout optimization.
- Cloud-based platforms will continue to dominate due to scalability and cost efficiency.
- Retailers will increasingly use AR and VR to create immersive in-store and online experiences.
- Integration with e-commerce platforms will become a standard feature for omnichannel strategies.
- Demand for virtual store prototyping will rise to reduce time-to-market for new layouts.
- Data analytics will play a larger role in personalizing product placement and promotions.
- Collaboration tools within software will improve cross-functional planning among retail teams.
- Sustainability goals will drive use of 3D tools to minimize waste in physical mock-ups.
- Small and mid-sized retailers will adopt subscription-based models for cost-effective access.
- Global expansion of organized retail will create opportunities in emerging markets.


