Market Overview:
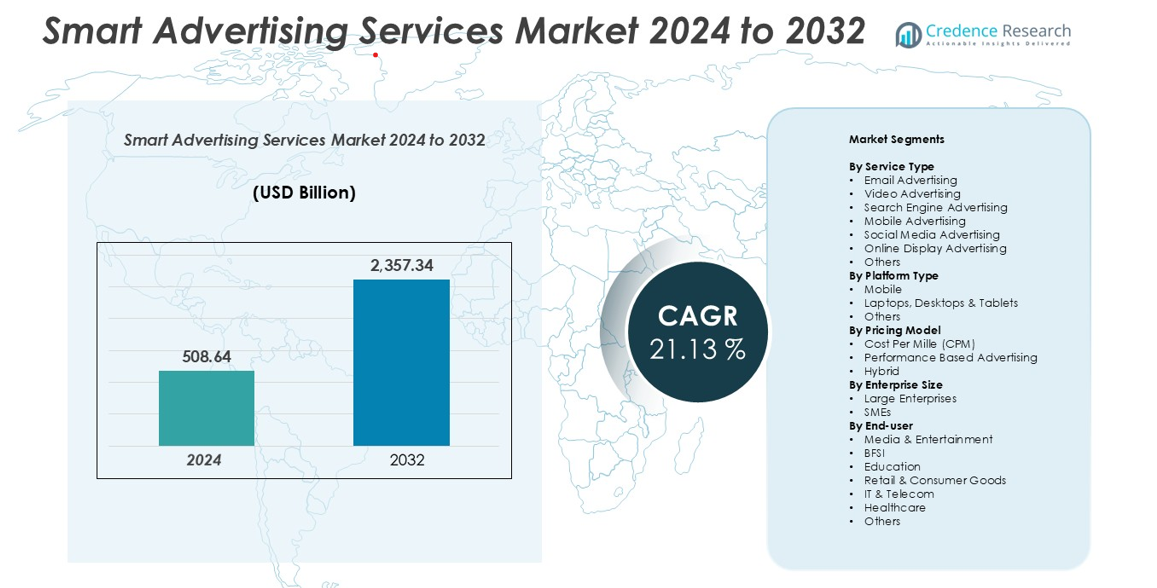
The Smart Advertising Services market size was valued at USD 508.64 billion in 2024 and is anticipated to reach USD 2,357.34 billion by 2032, at a CAGR of 21.13% during the forecast period.
| REPORT ATTRIBUTE |
DETAILS |
| Historical Period |
2020-2023 |
| Base Year |
2024 |
| Forecast Period |
2025-2032 |
| Smart Advertising Services Market Size 2024 |
USD 508.64 billion |
| Smart Advertising Services Market, CAGR |
21.13% |
| Smart Advertising Services Market Size 2032 |
USD 2,357.34 billion |
The Smart Advertising Services market is led by major players such as Google LLC, Meta, Amazon.com, Inc., TikTok, Alibaba Group Holding Limited, and Omnicom Group Inc., which collectively command a substantial share of the global digital advertising landscape. These companies leverage advanced analytics, AI algorithms, and vast user data to deliver personalized, high-impact campaigns across multiple platforms. North America remains the dominant region, holding approximately 38% of the global market share, supported by strong technological infrastructure and early adoption of programmatic advertising. Asia-Pacific follows with around 22%, driven by rapid mobile penetration and social media expansion, while Europe accounts for roughly 25%, supported by regulatory compliance and mature digital ecosystems.
Access crucial information at unmatched prices!
Request your sample report today & start making informed decisions powered by Credence Research Inc.!
Download Sample
Market Insights
- The Smart Advertising Services market was valued at USD 508.64 billion in 2024 and is projected to reach USD 2,357.34 billion by 2032, growing at a CAGR of 21.13% during the forecast period.
- Growing digital transformation, widespread mobile usage, and increasing demand for data-driven and AI-enabled advertising solutions are key drivers fueling market expansion across sectors such as retail, BFSI, and entertainment.
- Emerging trends include the rise of programmatic and automated ad placements, personalized content delivery, and adoption of AR/VR advertising for enhanced audience engagement and brand interaction.
- The competitive landscape is dominated by players like Google LLC, Meta, Amazon.com, TikTok, Alibaba Group, and Omnicom Group Inc., focusing on innovation, partnerships, and automation-driven campaign management.
- North America leads with 38% market share, followed by Europe (25%) and Asia-Pacific (22%); among service types, Social Media Advertising remains the leading segment, driven by high engagement rates.
Market Segmentation Analysis:
By Service Type:
The Smart Advertising Services market, segmented by service type, is dominated by Social Media Advertising, accounting for a major share due to extensive user engagement on platforms like Facebook, Instagram, and TikTok. This sub-segment benefits from precise audience targeting, real-time analytics, and influencer-driven campaigns that enhance brand visibility and conversion rates. Video Advertising is also witnessing rapid adoption as brands leverage interactive and short-form content to attract younger audiences. The growth of programmatic and AI-driven ad placement further boosts overall efficiency across service categories.
- For instance, Meta Platforms Inc. reported in January 2024 that its AI tools, including Advantage+ campaigns, had increased advertiser return on spending by an average of 32%. Advantage+ campaigns use AI to automate and optimize ad placement across Facebook and Instagram, with Meta previously noting the tool’s capacity to test up to 150 creative variations at once.
By Platform Type:
Based on platform type, the Mobile segment holds the largest market share, driven by the widespread use of smartphones, high-speed internet penetration, and the popularity of mobile-first applications. Advertisers are increasingly optimizing campaigns for in-app experiences and mobile browsers to capture users’ attention in real time. Laptops, Desktops & Tablets continue to serve as vital platforms for corporate and e-commerce advertisements, though their share is declining as user engagement shifts toward mobile ecosystems. The trend toward personalized, location-based advertising continues to strengthen mobile dominance.
- For instance, in its Q4 2024 earnings report, Meta Platforms, Inc. announced that ad impressions across its Family of Apps, including mobile placements like feeds and Stories, increased by 6% year-over-year. This growth, along with a 14% rise in the average price per ad, contributed to a 21% year-over-year increase in overall revenue.
By Pricing Model:
In terms of pricing models, Performance-Based Advertising leads the market, supported by its outcome-driven approach and measurable ROI. This model enables advertisers to pay only for desired actions such as clicks, sign-ups, or sales, making it highly cost-efficient for both large enterprises and SMEs. Cost Per Mille (CPM) remains relevant for brand awareness campaigns, while hybrid models are emerging to balance reach and performance goals. The growing use of AI analytics and data-driven optimization tools enhances the effectiveness and accountability of performance-based strategies.
Key Growth Drivers
Rising Digital Transformation Across Industries
The accelerating digital transformation across industries serves as a major driver for the Smart Advertising Services market. Businesses are shifting from traditional marketing channels to data-driven digital platforms to enhance customer engagement and conversion rates. The proliferation of high-speed internet, cloud-based marketing tools, and AI-powered analytics has enabled advertisers to deliver personalized, real-time campaigns. Sectors such as retail, BFSI, and healthcare are increasingly investing in smart advertising solutions to strengthen brand awareness and consumer loyalty. Furthermore, the integration of automation and predictive analytics enhances ad performance tracking and campaign optimization, fueling market expansion globally.
- For instance, according to Decathlon’s official 2022 performance report, the company’s net sales in 2022 reached €15.4 billion, with digital sales accounting for 17% of this total. This marked an increase from the pre-pandemic digital sales share of 8% in 2019.
Growing Adoption of AI and Machine Learning in Advertising
Artificial Intelligence (AI) and Machine Learning (ML) are revolutionizing the advertising ecosystem by enabling smarter audience segmentation, automated bidding, and personalized content delivery. Advertisers leverage AI algorithms to analyze vast datasets, predict consumer behavior, and optimize ad placements for maximum engagement. ML-based tools enhance decision-making by dynamically adjusting campaigns based on user responses and contextual factors. The integration of AI-driven chatbots and virtual assistants further enhances user experience, improving conversion rates. As AI technology becomes more accessible and affordable, its widespread implementation continues to drive efficiency, accuracy, and innovation across smart advertising solutions.
- For instance, Omneky Inc. is an ad-tech startup that uses artificial intelligence (AI), specifically machine learning (ML) and computer vision, to automate the process of generating, testing, and optimizing personalized ad creatives.
Increasing Penetration of Mobile and Social Media Platforms
The exponential growth of mobile devices and social media platforms has transformed advertising strategies, making them more interactive and consumer-centric. Mobile advertising dominates the digital landscape, supported by the rising popularity of short-form video content, app-based promotions, and location-based targeting. Social media giants like Meta, X (Twitter), and TikTok offer advanced advertising tools that allow precise demographic and behavioral targeting. Brands are leveraging influencer marketing and live-streaming features to connect with audiences on a personal level. As user engagement on social media continues to rise globally, mobile-first and social advertising solutions remain crucial drivers of market growth.
Key Trends & Opportunities
Integration of Augmented Reality (AR) and Virtual Reality (VR) Advertising
The adoption of immersive technologies such as AR and VR is creating new opportunities for smart advertising. These technologies enable brands to deliver interactive, experiential marketing campaigns that enhance consumer engagement. Retailers, automotive firms, and real estate developers are increasingly using AR/VR tools to showcase products virtually, allowing users to experience offerings in realistic environments. This innovation not only improves brand recall but also drives purchase intent. As AR/VR devices become more accessible and integrated into mobile ecosystems, advertisers are expected to leverage them extensively to create high-impact, interactive campaigns that differentiate their offerings.
- For instance, IKEA’s “IKEA Place” app uses Apple’s ARKit technology to let customers preview over 2,000 furniture products in real-world home settings.
Expansion of Programmatic and Automated Advertising
Programmatic advertising is emerging as a major trend, offering advertisers the ability to automate the buying and placement of ads through real-time bidding systems. This approach enhances cost efficiency, targeting precision, and scalability. With AI integration, programmatic platforms analyze audience behavior and contextual data to deliver relevant ads at the right time and place. The increasing use of demand-side platforms (DSPs) and data management platforms (DMPs) supports real-time decision-making and campaign optimization. This trend presents a significant opportunity for brands seeking to reduce manual intervention and enhance ROI through automated, data-driven advertising strategies.
Key Challenges
Rising Data Privacy and Security Concerns
The increasing dependence on consumer data for targeted advertising poses significant privacy and security challenges. Stringent data protection regulations such as GDPR and CCPA restrict the collection, storage, and use of personal information, compelling advertisers to revise data-handling practices. Consumers are becoming more aware of data misuse, leading to greater demand for transparency and consent-based marketing. The need for secure data management systems and compliance frameworks adds operational complexity and costs. Balancing personalization with privacy remains a critical challenge for advertisers seeking to maintain trust while delivering effective, data-driven campaigns.
High Competition and Ad Saturation in Digital Channels
The rapid growth of digital advertising has led to oversaturation across major online platforms, reducing campaign effectiveness and increasing competition for audience attention. Consumers are exposed to numerous ads daily, resulting in ad fatigue and declining engagement rates. Additionally, the widespread use of ad-blocking software limits visibility, especially in desktop environments. To overcome this challenge, advertisers must adopt innovative content strategies and advanced analytics to ensure relevance and impact. Differentiation through creative storytelling, contextual targeting, and value-driven content is essential to sustain audience interest in an increasingly competitive digital landscape.
Regional Analysis
North America
The North American market leads the global smart advertising services industry with a commanding market share of approximately 38 % in 2024. This dominance is driven by a well-established digital ecosystem, high internet and smartphone penetration, and major global ad-tech players headquartered in the region. Businesses across retail, media, and technology sectors allocate significant budgets toward programmatic, mobile, and video advertising, enabling faster adoption of advanced formats. The region’s robust infrastructure and data-driven marketing maturity continue to sustain its leadership position.
Europe
Europe holds a strong position in the smart advertising services market, with an estimated share close to ~25 % in 2024. The region benefits from a mature multichannel advertising landscape, strict regulatory frameworks (such as GDPR) that enhance trust, and substantial investments in digital marketing across sectors like retail, banking and automotive. While growth is steady rather than explosive, European advertisers’ increasing use of mobile, interactive video and social-media formats supports expansion. Market shares are maintained via a focus on compliance, localized campaigns, and performance-driven ad strategies.
Asia-Pacific
The Asia-Pacific region is the fastest-growing market for smart advertising services, holding around ~22 % of global market share in 2024 and expected to expand at the highest CAGR. Growth is fueled by massive smartphone adoption, rapid digitalization in countries such as China and India, and a shift toward mobile-first and social-media-driven ad formats. E-commerce growth and increasing investments in AI-powered targeting are unlocking new opportunities. Consequently, the region is rapidly challenging established markets and evolving into a key growth engine for global smart advertising services.
Latin America
Latin America accounts for an estimated ~8 % share of the global smart advertising services market in 2024. Growth here is supported by rising internet and mobile penetration, increasing social-media usage, and a growing e-commerce sector. Leading countries such as Brazil and Mexico are seeing accelerating adoption of mobile and performance-based advertising. However, the region faces challenges such as infrastructure variability and economic volatility. Still, Latin America remains a promising growth region for advertisers aiming to reach younger, digitally-engaged audiences.
Middle East & Africa (MEA)
The Middle East & Africa region represents a smaller but rapidly growing segment of the smart advertising services market, with an approximate share of ~7 % in 2024. Growth is driven by expanded mobile connectivity, rising social-media engagement, and increasing investment in digital media by governments and private enterprises across Gulf states and Africa. However, constrained technological infrastructure in some markets and regulatory complexity moderate adoption. Nevertheless, MEA is emerging as a significant frontier for digital advertising innovation and regional expansion.
Market Segmentations:
By Service Type
- Email Advertising
- Video Advertising
- Search Engine Advertising
- Mobile Advertising
- Social Media Advertising
- Online Display Advertising
- Others
By Platform Type
- Mobile
- Laptops, Desktops & Tablets
- Others
By Pricing Model
- Cost Per Mille (CPM)
- Performance Based Advertising
- Hybrid
By Enterprise Size
By End-user
- Media & Entertainment
- BFSI
- Education
- Retail & Consumer Goods
- IT & Telecom
- Healthcare
- Others
By Geography
- North America
- Europe
- Germany
- France
- U.K.
- Italy
- Spain
- Rest of Europe
- Asia Pacific
- China
- Japan
- India
- South Korea
- South-east Asia
- Rest of Asia Pacific
- Latin America
- Brazil
- Argentina
- Rest of Latin America
- Middle East & Africa
- GCC Countries
- South Africa
- Rest of the Middle East and Africa
Competitive Landscape
The Smart Advertising Services market is highly competitive, characterized by the presence of global technology giants, advertising agencies, and emerging digital marketing firms striving to enhance their market positioning through innovation and strategic partnerships. Leading players such as Google LLC, Meta, Amazon.com, Inc., TikTok, and Alibaba Group Holding Limited dominate the market with advanced AI-driven advertising platforms, extensive user data analytics, and global reach. Agencies like Omnicom Group Inc., Interpublic Group of Companies, Inc., and VaynerMedia focus on integrated digital marketing solutions and cross-platform strategies to deliver measurable results. Additionally, platforms such as YouTube, Hulu LLC, Twitter, Inc., and ibex Limited continue to invest in targeted and video-based advertising formats to improve engagement. Companies are increasingly adopting automation, real-time bidding, and performance-based models to optimize campaign efficiency. Strategic collaborations, mergers, and AI-powered innovations remain central to maintaining competitiveness and driving market growth in this evolving digital ecosystem.\
Shape Your Report to Specific Countries or Regions & Enjoy 30% Off!
Key Player Analysis
- Google LLC
- TikTok
- Omnicom Group Inc.
- Meta
- Alibaba Group Holding Limited
- VaynerMedia
- Hulu LLC
- Interpublic Group of Companies, Inc.
- YouTube
- com, Inc.
- Twitter, Inc.
- ibex Limited
Recent Developments
- In May 2025, Yahoo Inc. acquired Media.net to enhance its native commerce product suite and deepen publisher revenue streams.
- In April 2025, WPP’s Choreograph and Walmart Connect launched a joint cleanroom solution enabling closed-loop attribution for off-site media buys.
- In March 2025, Salesforce Marketing Cloud introduced Einstein Generative Copy, an LLM-based creative variation engine integrated across email, social and display modules.
- In January 2025, Google completed global rollout of Privacy Sandbox relevance APIs to 100% of Chrome traffic, initiating the final phase of third-party-cookie deprecation.
- In June 2024, Google launched a new advertising network aimed at filling free streaming TV channels with ads, known as the Google TV network. This service allows advertisers to place unskippable in-stream ads across more than 125 live channels, many of which are FAST (free ad-supported streaming TV) channels.
- In February 2023, Google, a leading technology company, released a new Artificial Intelligence (AI) tool that has been aimed assist advertisers in creating more targeted advertisements. The new technology assists users in the creation of additional assets that complement the existing assets. The company has already witnessed a 2% increase in conversions of its existing users.
Report Coverage
The research report offers an in-depth analysis based on Service Type, Platform Type, Enterprise Size, End-User and Geography. It details leading market players, providing an overview of their business, product offerings, investments, revenue streams, and key applications. Additionally, the report includes insights into the competitive environment, SWOT analysis, current market trends, as well as the primary drivers and constraints. Furthermore, it discusses various factors that have driven market expansion in recent years. The report also explores market dynamics, regulatory scenarios, and technological advancements that are shaping the industry. It assesses the impact of external factors and global economic changes on market growth. Lastly, it provides strategic recommendations for new entrants and established companies to navigate the complexities of the market.
Future Outlook
- The market will continue to expand rapidly with increasing integration of AI and machine learning in ad optimization and targeting.
- Programmatic advertising will dominate due to its ability to automate ad placement and improve campaign efficiency.
- Mobile and social media platforms will remain the primary channels for audience engagement and revenue generation.
- Video advertising will experience strong growth as consumers prefer interactive and visual content formats.
- Data-driven personalization will become central to improving user experience and conversion rates.
- Integration of AR and VR technologies will enhance immersive and experiential advertising strategies.
- Privacy regulations will encourage the adoption of ethical and transparent data usage practices.
- SMEs will increasingly adopt smart advertising tools to enhance brand visibility and market competitiveness.
- Strategic collaborations between tech giants and ad agencies will drive innovation and cross-platform integration.
- Emerging markets in Asia-Pacific and the Middle East will offer significant growth opportunities for advertisers.


