Connected Toys Market By Toy Type (App-enabled Mechanical Toys & Drones, Voice/Image Recognition Toys and Health Tracking Toys/Wearables), By Device Type (Smartphone & Tablet Connected Toys, Laptop Connected Toys and Console Connected Toys), By Connectivity Type (Wi-Fi, Bluetooth and RFID/NFC)) – Growth, Future Prospects and Competitive Landscape, 2018 – 2026

Price: $4699

Published: | Report ID: 4038 | Report Format : PDF

Overview:

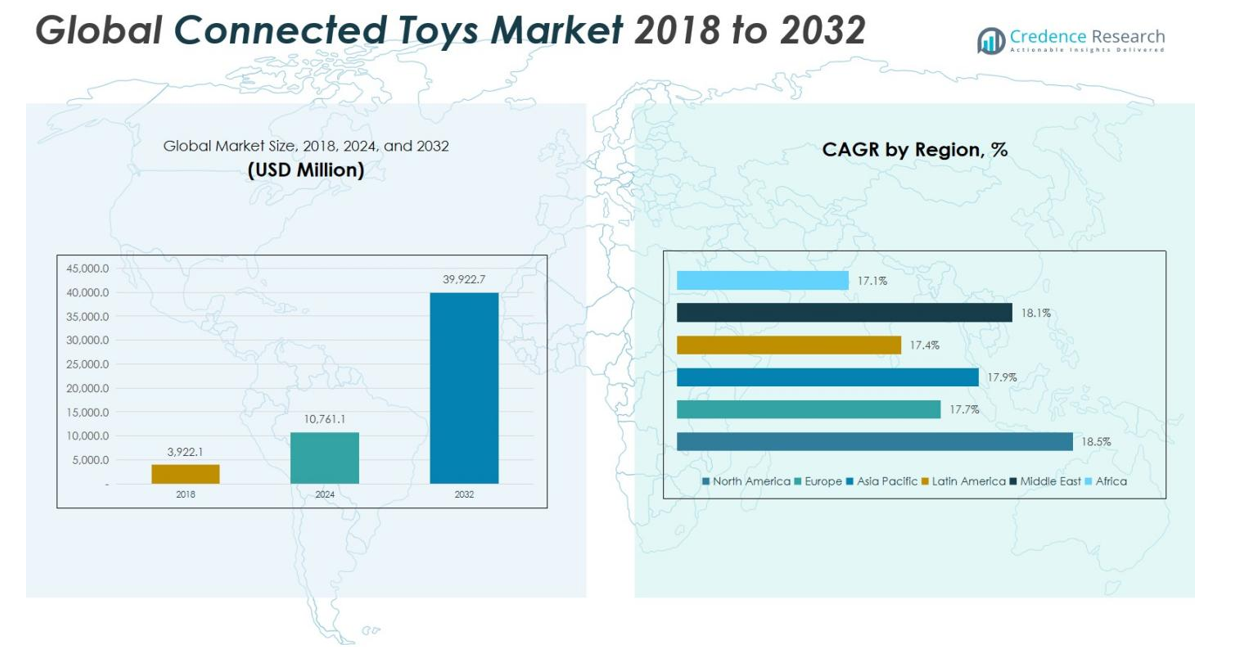
The global connected toys market is expected to reach US$ 69.16 billion by 2026, growing at a CAGR of 14.1% from 2018 to 2026. The dramatic increase in the number of internet-connected devices, including the Internet of Things (IoT), has created numerous benefits for consumers across the globe. Wearable technologies, smart thermostats, and connected home security systems are just a few examples. Similarly, in the recent past, children’s toys have evolved from simply stuffed bears to connected toys.

Connected toys, also known as smart toys, come in all shapes and sizes, but all have some degree of connectivity that allows children to interact with the toy through a smart device. Children’s toys are already computerized and connected to the internet and will continue to evolve in the near future as technology advances. An increase in the number of internet users coupled with the rising popularity of various hand-held devices like smartphones and tablets are driving awareness and growth in the connected toys market worldwide.

Connected toys are everywhere these days and are becoming increasingly popular as they offer a varied range of opportunities and features for interactive play and education. On the other hand, when a toy shifts from being a doll or an action figure to being a child’s interactive friend with the capability to accumulate personal data and offer external information, it becomes necessary to ensure that parents take security and privacy safeguards. Many connected toys have been found to lack sufficient security measures. As a result, the lack of safety and security of these toys is expected to hinder the growth of the connected toys market during the forecast period from 2018 to 2026.

Design Element 2

Access crucial information at unmatched prices!

Request your free sample report today & start making informed decisions powered by Credence Research!

Download Free Sample

CTA Design Element 3

Market Snapshot

App-enabled mechanical toys and drones accounted for the largest market share in 2017.

In 2017, based on product type, app-enabled mechanical toys and drones exhibited the largest market share in the global connected toys market. The segment is expected to grow at a significant rate in the years to come. Advances in the application programming interface (API) for connected toys are expected to enhance the market’s growth in the coming years. The trend is expected to continue as the market evolves, providing significant growth opportunities from 2018 to 2026.

North America held the largest market share in 2017.

The connected toys market, based on geography, was led by North America in 2017 and is expected to remain dominant throughout the forecast period from 2018 to 2026. A growing number of devices in American households, including security systems, televisions, heating and cooling devices, and connected toys, rely on internet connectivity to perform a range of functionalities. Increasing adoption of smart technologies in the region is expected to boost the growth of the connected toys market in the years to come.

Competitive Insights

Connected toy manufacturers are adopting strategies like partnerships and new product development to cater to the needs of their customers and gain a competitive edge over other players. For instance, in May 2018, Lego launched a new line of connected toys known as “Powered Up” and also released its first set in the series, the Batmobile, which gets controlled by pre-built remote interfaces on the companion Powered Up iOS and Android app. The Powered Up line consists of multiple products that differ in complexity instead of one set that can be used to build multiple things. Some of the sets might be battery-powered only, while others can be app-controlled or remotely controlled.

The major players in the global connected toys market include Sphero, Hasbro, Sony Corporation, KidsII Inc., Playmobil, Fisher-Price, Inc., The Lego Group, Mattel Inc., K’NEX Industries Inc., LeapFrog Enterprises, Inc., Tomy Company, Ltd., and Jakks Pacific, Inc., among others.

Periods of History and Forecast

The research report presents the analysis of each segment from 2016 to 2026, considering 2017 as the base year for the research. The compound annual growth rate (CAGR) for each of the respective segments was calculated for the forecast period from 2018 to 2026.

Shape Your Report to Specific Countries or Regions & Enjoy 30% Off!

Report Scope by Segments

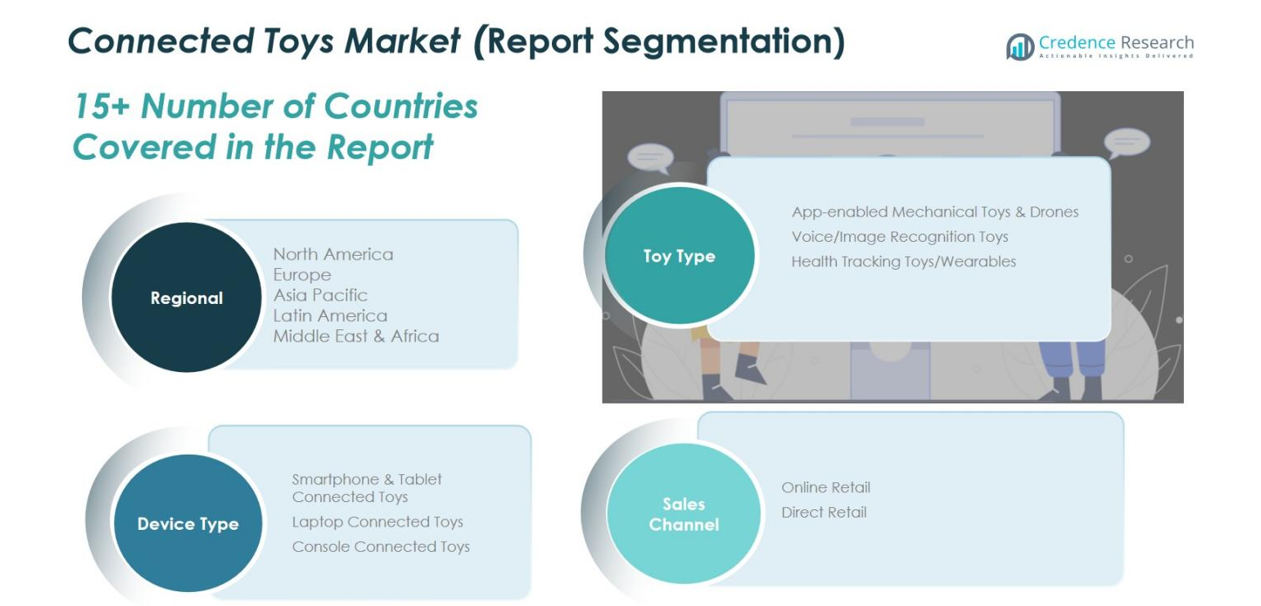
The connected toys market report provides market size and estimates based on market dynamics and key trends observed in the industry. The report provides a holistic view of the global connected toys market based on toy type, device type, connectivity type, sales channel, and geography. Key segments covered in the report are as follows:

Key questions are answered in this report.

  • What was the market size of connected toys in 2017, and what is the forecast up to 2026?
  • What are the key factors driving the global market for connected toys?
  • What are the key market trends and high-growth opportunities observed in the connected toy market?
  • What are the drivers of the connected toy market?
  • Which is the largest regional market for connected toys?
  • Which segment will grow at a faster pace? Why?
  • Which region will drive the market’s growth? Why?
  • Which players are leading the connected toy market?
  • What are the sustainability strategies adopted by the key players operating in the market?

1. Preface
1.1. Report Description
1.1.1. Purpose of the Report
1.1.2. Target Audience
1.1.3. USP and Key Offerings
1.2. Research Scope
1.3. Research Methodology
1.3.1. Phase I – Secondary Research
1.3.2. Phase II – Primary Research
1.3.3. Phase III – Expert Panel Review
1.3.4. Approach Adopted
1.3.4.1. Top-Down Approach
1.3.4.2. Bottom-Up Approach
1.3.5. Assumptions
1.4. Market Segmentation

2. Executive Summary
2.1. Market Snapshot: Global CT Market
2.2. Global CT Market, by Toy Type, 2017 (US$ Bn)
2.3. Global CT Market, by Device Type, 2017 (US$ Bn)
2.4. Global CT Market, by Connectivity Type, 2017 (US$ Bn)
2.5. Global CT Market, by Sales Channel, 2017 (US$ Bn)
2.6. Global CT Market, by Geography, 2017 (US$ Bn)

3. Market Dynamics
3.1. Introduction
3.1.1. Global CT Market Value, 2016 – 2026, (US$ Bn)
3.2. Market Dynamics
3.2.1. Market Drivers
3.2.2. Market Restraints
3.3. Attractive Investment Proposition, by Geography, 2017
3.4. Market Positioning of Key Players, 2017
3.4.1. Major Strategies Adopted by Key Players

4. Global Connected Toys (CT) Market, by Toy Type , 2016 – 2026 (US$ Bn)
4.1. Overview
4.2. App-enabled Mechanical Toys & Drones
4.3. Voice/Image Recognition Toys
4.4. Health Tracking Toys/Wearables

5. Global Connected Toys (CT) Market, by Device Type, 2016 – 2026 (US$ Bn)
5.1. Overview
5.2. Smartphone & Tablet Connected Toys
5.3. Laptop Connected Toys
5.4. Console Connected Toys

6. Global Connected Toys (CT) Market, by Connectivity Type, 2016 – 2026 (US$ Bn)
6.1. Overview
6.2. Wi-Fi
6.3. Bluetooth
6.4. RFID/NFC

7. Global Connected Toys (CT) Market, by Sales Channel, 2016 – 2026 (US$ Bn)
7.1. Overview
7.2. Online Retail
7.3. Direct Retail

8. North America Connected Toys (CT) Market Analysis, 2016 – 2026 (US$ Bn)
8.1. Overview
8.1.1. North America CT Market Value and Growth, 2016 – 2026, (US$ Bn)
8.2. North America CT Market Value, By Toy Type, 2016 – 2026 (US$ Bn)
8.2.1. Market Analysis
8.3. North America CT Market Value, By Device Type, 2016 – 2026 (US$ Bn)
8.3.1. Market Analysis
8.4. North America CT Market Value, By Connectivity Type, 2016 – 2026 (US$ Bn)
8.4.1. Market Analysis
8.5. North America CT Market Value, By Sales Channel, 2016 – 2026 (US$ Bn)
8.5.1. Market Analysis
8.6. North America CT Market Value, By Region/Country, 2016 – 2026 (US$ Bn)
8.6.1. Market Analysis
8.6.2. U.S.
8.6.3. Rest of North America

9. Europe Connected Toys (CT) Market Analysis, 2016 – 2026 (US$ Bn)
9.1. Overview
9.1.1. Europe CT Market Value and Growth, 2016 – 2026, (US$ Bn)
9.2. Europe CT Market Value, By Toy Type, 2016 – 2026 (US$ Bn)
9.2.1. Market Analysis
9.3. Europe CT Market Value, By Device Type, 2016 – 2026 (US$ Bn)
9.3.1. Market Analysis
9.4. Europe CT Market Value, By Connectivity Type, 2016 – 2026 (US$ Bn)
9.4.1. Market Analysis
9.5. Europe CT Market Value, By Sales Channel, 2016 – 2026 (US$ Bn)
9.5.1. Market Analysis
9.6. Europe CT Market Value, By Region/Country, 2016 – 2026 (US$ Bn)
9.6.1. Market Analysis
9.6.2. U.K.
9.6.3. Germany
9.6.4. France
9.6.5. Rest of Europe

10. Asia Pacific Connected Toys (CT) Market Analysis, 2016 – 2026 (US$ Bn)
10.1. Overview
10.1.1. Asia Pacific CT Market Value and Growth, 2016 – 2026, (US$ Bn)
10.2. Asia Pacific CT Market Value, By Toy Type, 2016 – 2026 (US$ Bn)
10.2.1. Market Analysis
10.3. Asia Pacific CT Market Value, By Device Type, 2016 – 2026 (US$ Bn)
10.3.1. Market Analysis
10.4. Asia Pacific CT Market Value, By Connectivity Type, 2016 – 2026 (US$ Bn)
10.4.1. Market Analysis
10.5. Asia Pacific CT Market Value, By Sales Channel, 2016 – 2026 (US$ Bn)
10.5.1. Market Analysis
10.6. Asia Pacific CT Market Value, By Region/Country, 2016 – 2026 (US$ Bn)
10.6.1. Market Analysis
10.6.2. Japan
10.6.3. China
10.6.4. India
10.6.5. Rest of Asia Pacific

11. Rest of the World Connected Toys (CT) Market Analysis, 2016 – 2026 (US$ Bn)
11.1. Overview
11.1.1. Rest of the World CT Market Value and Growth, 2016 – 2026, (US$ Bn)
11.2. Rest of the World CT Market Value, By Toy Type, 2016 – 2026 (US$ Bn)
11.2.1. Market Analysis
11.3. Rest of the World CT Market Value, By Device Type, 2016 – 2026 (US$ Bn)
11.3.1. Market Analysis
11.4. Rest of the World CT Market Value, By Connectivity Type, 2016 – 2026 (US$ Bn)
11.4.1. Market Analysis
11.5. Rest of the World CT Market Value, By Sales Channel, 2016 – 2026 (US$ Bn)
11.5.1. Market Analysis
11.6. Rest of the World CT Market Value, By Region, 2016 – 2026 (US$ Bn)
11.6.1. Market Analysis
11.6.2. Middle East & Africa
11.6.3. Latin America

12. Company Profiles
12.1. Sphero
12.2. Hasbro, Inc.
12.3. Sony Corporation
12.4. KidsII Inc.
12.5. Playmobil
12.6. Fisher-Price, Inc.
12.7. The Lego Group
12.8. Mattel Inc.
12.9. K’NEX Industries Inc.
12.10. LeapFrog Enterprises, Inc.
12.11. Tomy Company, Ltd.
12.12. Jakks Pacific, Inc.

List of Figures

FIG. 1 Global Connected Toys (CT) Market: Research Methodology
FIG. 2 Market Size Estimation – Top-Down and Bottom Up Approach
FIG. 3 Global CT Market Segmentation
FIG. 4 Global CT Market, by Toy Type, 2017 (US$ Bn)
FIG. 5 Global CT Market, by Device Type, 2017 (US$ Bn)
FIG. 6 Global CT Market, by Connectivity Type, 2017 (US$ Bn)
FIG. 7 Global CT Market, by Sales Channel, 2017 (US$ Bn)
FIG. 8 Global CT Market, by Geography, 2017 (US$ Bn)
FIG. 9 Global CT Market Value, 2016 – 2026, (US$ Bn) and (Y-o-Y%)
FIG. 10 Attractive Investment Proposition, by Geography, 2017
FIG. 11 Global Market Positioning of Key Connected Toys Providers, 2017
FIG. 12 Global CT Market Value Share, by Toy Type, 2017 & 2026 (Value %)
FIG. 13 Global App-enabled Mechanical Toys & Drones Toys Market Value, 2016 – 2026, (US$ Bn)
FIG. 14 Global Voice/Image Recognition Toys Market Value, 2016 – 2026, (US$ Bn)
FIG. 15 Global Health Tracking Toys/Wearables Market Value, 2016 – 2026, (US$ Bn)
FIG. 16 Global CT Market Value Share, by Device Type, 2017 & 2026 (Value %)
FIG. 17 Global Smartphone & Tablet CT Market Value, 2016 – 2026, (US$ Bn)
FIG. 18 Global Laptop CT Market Value, 2016 – 2026, (US$ Bn)
FIG. 19 Global Console CT Market Value, 2016 – 2026, (US$ Bn)
FIG. 20 Global CT Market Value Share, by Connectivity Type, 2017 & 2026 (Value %)
FIG. 21 Global Wi-Fi CT Market Value, 2016 – 2026, (US$ Bn)
FIG. 22 Global Bluetooth CT Market Value, 2016 – 2026, (US$ Bn)
FIG. 23 Global RFID/NFC CT Market Value, 2016 – 2026, (US$ Bn)
FIG. 24 Global CT Market Value Share, by Sales Channel, 2017 & 2026 (Value %)
FIG. 25 Global CT Market Value for Online Retail, 2016 – 2026, (US$ Bn)
FIG. 26 Global CT Market Value for Direct Retail, 2016 – 2026, (US$ Bn)
FIG. 27 North America CT Market Value, 2016 – 2026, (US$ Bn)
FIG. 28 Europe CT Market Value, 2016 – 2026, (US$ Bn)
FIG. 29 Asia Pacific CT Market Value, 2016 – 2026, (US$ Bn)
FIG. 30 RoW CT Market Value, 2016 – 2026, (US$ Bn)

List of Tables

TABLE 1 Market Snapshot: Global Connected Toys (CT) Market Value
TABLE 2 Impact Indicators
TABLE 3 Impact Analysis of Drivers and Restraints
TABLE 4 Global CT Market, by Toy Type, 2016 – 2026 (US$ Bn)
TABLE 5 Global CT Market, by Device Type, 2016 – 2026 (US$ Bn)
TABLE 6 Global CT Market, by Connectivity Type, 2016 – 2026 (US$ Bn)
TABLE 7 Global CT Market, by Sales Channel, 2016 – 2026 (US$ Bn)
TABLE 8 Global CT Market, by Geography, 2016 – 2026 (US$ Bn)
TABLE 9 North America CT Market, by Toy Type, 2016-2026 (US$ Bn)
TABLE 10 North America CT Market, by Device Type, 2016 – 2026 (US$ Bn)
TABLE 11 North America CT Market, by Connectivity Type, 2016 – 2026 (US$ Bn)
TABLE 12 North America CT Market, by Sales Channel, 2016 – 2026 (US$ Bn)
TABLE 13 North America CT Market Value, by Region/Country, 2016 – 2026 (US$ Bn)
TABLE 14 Europe CT Market, by Toy Type, 2016-2026 (US$ Bn)
TABLE 15 Europe CT Market, by Device Type, 2016 – 2026 (US$ Bn)
TABLE 16 Europe CT Market, by Connectivity Type, 2016 – 2026 (US$ Bn)
TABLE 17 Europe CT Market, by Sales Channel, 2016 – 2026 (US$ Bn)
TABLE 18 Europe CT Market Value, by Region/Country, 2016 – 2026 (US$ Bn)
TABLE 19 Asia Pacific CT Market, by Toy Type, 2016-2026 (US$ Bn)
TABLE 20 Asia Pacific CT Market, by Device Type, 2016 – 2026 (US$ Bn)
TABLE 21 Asia Pacific CT Market, by Connectivity Type, 2016 -2026 (US$ Bn)
TABLE 22 Asia Pacific CT Market, by Sales Channel, 2016 – 2026 (US$ Bn)
TABLE 23 Asia Pacific CT Market Value, by Region/Country, 2016 – 2026 (US$ Bn)
TABLE 24 Rest of the World CT Market, by Toy Type, 2016 – 2026 (US$ Bn)
TABLE 25 Rest of the World CT Market, by Device Type, 2016 – 2026 (US$ Bn)
TABLE 26 Rest of the World CT Market, by Connectivity Type, 2016 – 2026 (US$ Bn)
TABLE 27 Rest of the World CT Market, by Sales Channel, 2016 – 2026 (US$ Bn)
TABLE 28 Rest of the World CT Market Value, by Region, 2016 – 2026 (US$ Bn)
TABLE 29 Sphero: Company Snapshot (Business Description; Product Portfolio; Financial Information; Business Overview and Recent Development)
TABLE 30 Hasbro, Inc.: Company Snapshot (Business Description; Product Portfolio; Financial Information; Business Overview and Recent Development)
TABLE 31 Sony Corporation: Company Snapshot (Business Description; Product Portfolio; Financial Information; Business Overview and Recent Development)
TABLE 32 KidsII Inc.: Company Snapshot (Business Description; Product Portfolio; Financial Information; Business Overview and Recent Development)
TABLE 33 Playmobil: Company Snapshot (Business Description; Product Portfolio; Financial Information; Business Overview and Recent Development)
TABLE 34 Fisher-Price, Inc.: Company Snapshot (Business Description; Product Portfolio; Financial Information; Business Overview and Recent Development)
TABLE 35 The Lego Group: Company Snapshot (Business Description; Product Portfolio; Financial Information; Business Overview and Recent Development)
TABLE 36 Mattel Inc.: Company Snapshot (Business Description; Product Portfolio; Financial Information; Business Overview and Recent Development)
TABLE 37 K’NEX Industries Inc.: Company Snapshot (Business Description; Product Portfolio; Financial Information; Business Overview and Recent Development)
TABLE 38 LeapFrog Enterprises, Inc.: Company Snapshot (Business Description; Product Portfolio; Financial Information; Business Overview and Recent Development)
TABLE 39 Tomy Company, Ltd.: Company Snapshot (Business Description; Product Portfolio; Financial Information; Business Overview and Recent Development)
TABLE 40 Jakks Pacific, Inc.: Company Snapshot (Business Description; Product Portfolio; Financial Information; Business Overview and Recent Development)

Frequently Asked Questions

What is the size of Connected Toys Market?

The market for Connected Toys is expected to reach US$ 69.16 Bn in 2026.

What is the Connected Toys Market CAGR?

The Connected Toys market is expected to see significant CAGR growth over the coming years, at 14.1%.

What is the Forecast period considered for Connected Toys Market?

The report is forecasted from 2018-2026.

What is the base year considered for Connected Toys Market?

The base year of this report is 2017.

Who are the major players in this market?

Sphero, Hasbro, Inc., Sony Corporation, KidsII Inc., Playmobil are some of the major players in the global market.

WAN Connected Returnable Transport Asset Tracking Market

Published:
Report ID: 63316

Connected Home Appliances Market

Published:
Report ID: 62236

Connected Agriculture Market

Published:
Report ID: 4044

Connected Retail Market

Published:
Report ID: 4039

Connected Medical Device Market

Published:
Report ID: 54357

Grid Connected Battery Energy Storage Market

Published:
Report ID: 52558

Connected and Autonomous Mobility Vehicles Market

Published:
Report ID: 49784

Connected Cars Market

Published:
Report ID: 17006

Connected Healthcare Market

Published:
Report ID: 42118

Artificial Intelligence (AI) Market

Published:
Report ID: 64108

LED Video Walls Market

Published:
Report ID: 12216

Biometrics Technology Market

Published:
Report ID: 1464

Air Transport MRO Market

Published:
Report ID: 1191

Air Separation Plant Market

Published:
Report ID: 1279

Asset Tracking And Inventory Management Solutions Market

Published:
Report ID: 2327

Architectural Services Market

Published:
Report ID: 54588

Advanced Cinema Projector Market

Published:
Report ID: 1576

3D Radar Market

Published:
Report ID: 973

Next Generation Intrusion Prevention System (NGIPS) Market

Published:
Report ID: 63689

Video On-Demand Market

Published:
Report ID: 12034

Vibration Energy Harvesting Systems Market

Published:
Report ID: 11950

Purchase Options

The report comes as a view-only PDF document, optimized for individual clients. This version is recommended for personal digital use and does not allow printing.
$4699

To meet the needs of modern corporate teams, our report comes in two formats: a printable PDF and a data-rich Excel sheet. This package is optimized for internal analysis and multi-location access, making it an excellent choice for organizations with distributed workforce.
$5699

The report will be delivered in printable PDF format along with the report’s data Excel sheet. This license offers 100 Free Analyst hours where the client can utilize Credence Research Inc.’s research team. It is highly recommended for organizations seeking to execute short, customized research projects related to the scope of the purchased report.
$7699

Smallform of Sample request

Have a question?

User Profile

Don’t settle for less – trust Mitul to help you find the best solution.

Report delivery within 24 to 48 hours

– Other Info –

What people say?-

User Review

I am very impressed with the information in this report. The author clearly did their research when they came up with this product and it has already given me a lot of ideas.

Jana Schmidt
CEDAR CX Technologies

– Connect with us –

Phone

+91 6232 49 3207


support

24/7 Research Support


sales@credenceresearch.com

– Research Methodology –

Going beyond the basics: advanced techniques in research methodology

– Trusted By –

Pepshi, LG, Nestle
Motorola, Honeywell, Johnson and johnson
LG Chem, SIEMENS, Pfizer
Unilever, Samsonite, QIAGEN