Market Overview
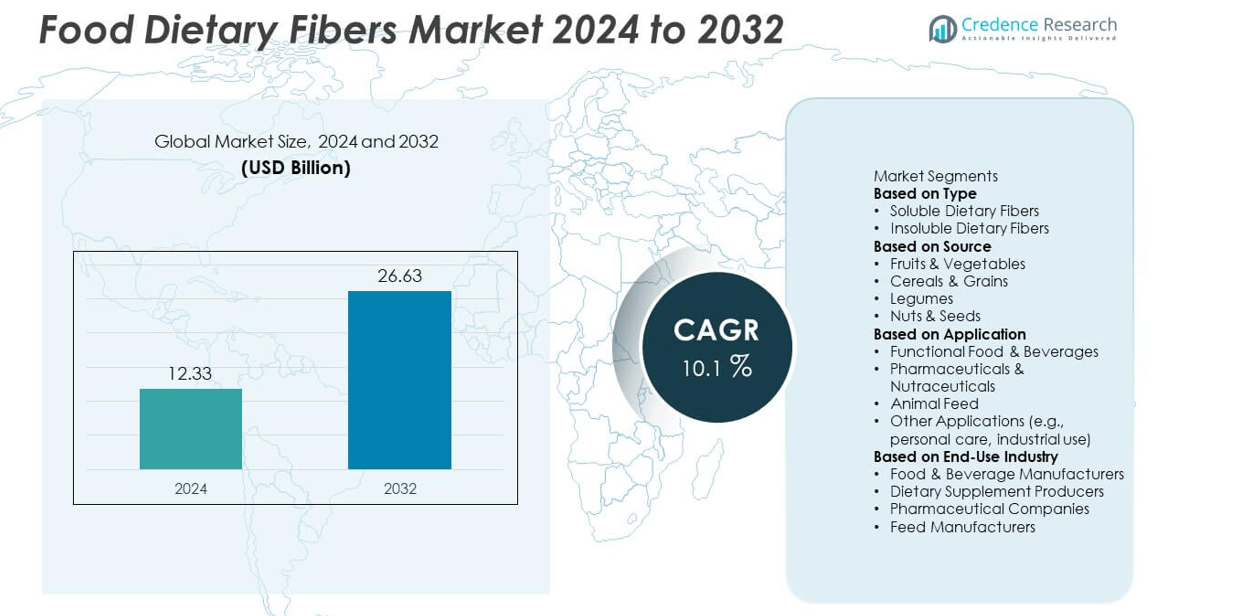
The global food dietary fibers market size was valued at USD 12.33 billion in 2024 and is projected to reach USD 26.63 billion by 2032, growing at a CAGR of 10.1% during the forecast period.
| REPORT ATTRIBUTE |
DETAILS |
| Historical Period |
2020-2023 |
| Base Year |
2024 |
| Forecast Period |
2025-2032 |
| Food Dietary Fibers Market Size 2024 |
USD 12.33 billion |
| Food Dietary Fibers Market, CAGR |
10.1% |
| Food Dietary Fibers Market Size 2032 |
USD 26.63 billion |
The food dietary fibers market is led by major players including Cargill, Archer Daniels Midland Company (ADM), DuPont de Nemours, Ingredion Incorporated, Tate & Lyle, Roquette Frères, Kerry Group, Sudzucker (BENEO), Nexira, and Lonza Group. These companies drive market growth through strong product portfolios, fiber-enriched innovations, and global supply networks catering to functional food, beverage, and nutraceutical industries. Regionally, North America held the largest share at 32% in 2024, supported by high consumer awareness and advanced food processing capabilities. Europe followed with 28% share, driven by stringent health regulations and clean-label demand, while Asia-Pacific accounted for 25% share, emerging as the fastest-growing region due to rising health-conscious consumers and expanding functional food adoption.
Market Insights
- The global food dietary fibers market was valued at USD 12.33 billion in 2024 and is projected to reach USD 26.63 billion by 2032, growing at a CAGR of 10.1% during the forecast period.
- Rising consumer awareness of digestive health, obesity, and diabetes prevention is driving fiber demand, with insoluble fibers holding 55% share due to wide use in bakery, cereals, and snacks.
- Key trends include the shift toward plant-based nutrition, innovation in fiber-enriched functional foods, and increased demand for clean-label products, especially in fortified beverages and dairy alternatives.
- Leading companies such as Cargill, ADM, DuPont, Ingredion, and Tate & Lyle focus on innovation, sustainability, and regulatory compliance, while smaller players face challenges from high processing costs and consumer awareness gaps.
- Regionally, North America leads with 32% share, Europe follows with 28%, and Asia-Pacific holds 25% driven by fast-growing functional food adoption, while Latin America (9%) and Middle East & Africa (6%) show steady growth.
Access crucial information at unmatched prices!
Request your sample report today & start making informed decisions powered by Credence Research Inc.!
Download Sample
Market Segmentation Analysis:
By Type
In 2024, insoluble dietary fibers dominated the market with over 55% share, driven by their extensive use in bakery, cereals, and functional snacks. These fibers are widely recognized for promoting digestive health and weight management, which supports their integration into everyday food products. Soluble fibers also hold strong growth potential due to their role in lowering cholesterol and blood glucose levels, but their adoption remains slightly behind insoluble variants. Rising consumer focus on gut health and clean-label products further strengthens demand for insoluble dietary fibers across developed and emerging markets.
- For instance, Tate & Lyle produces Promitor soluble fibers, which have been shown through multiple verified clinical studies to reduce postprandial blood glucose responses. In one such crossover study involving 12 healthy adults, consumption of the soluble fiber resulted in a significantly lower incremental glucose and insulin response compared to a glucose control.
By Source
Cereals & grains accounted for nearly 40% of the market share in 2024, making them the leading source of dietary fibers. Their dominance is attributed to their high availability, cost-effectiveness, and application in staple foods such as bread, pasta, and breakfast cereals. Fruits and vegetables represent the second-largest category, gaining traction due to consumer preference for natural and plant-based nutrition. Meanwhile, legumes and nuts & seeds contribute niche growth, especially in the premium and health-focused food categories. The versatility and affordability of cereal-derived fibers sustain their leadership.
- For instance, ADM operates large-scale oat processing facilities in North America, supplying a range of oat-based products, including dietary fibers, to bakery and cereal manufacturers worldwide.
By Application
The functional food & beverages segment captured around 50% share in 2024, solidifying its position as the largest application area for dietary fibers. Rising health awareness, coupled with the growing demand for fortified foods, fuels this dominance. These fibers are increasingly incorporated in baked goods, dairy alternatives, and beverages to enhance nutritional profiles and promote digestive health. Pharmaceuticals and nutraceuticals follow as significant contributors, supported by the growing supplement industry. Animal feed and other niche applications add incremental growth, but functional foods remain the primary driver of fiber consumption globally.
Key Growth Drivers
Rising Health Awareness
Increasing awareness of digestive health and chronic disease prevention is driving the demand for dietary fibers. Consumers actively seek products that support weight management, lower cholesterol, and regulate blood sugar. This shift in eating habits has expanded fiber inclusion across functional foods, beverages, and supplements. Manufacturers are responding with fiber-fortified bakery items, snacks, and cereals to meet consumer demand. The global health-conscious population, particularly in developed markets, continues to boost the penetration of dietary fiber-based products in daily diets, strengthening long-term market expansion.
- For instance, BENEO produces inulin and oligofructose fibers from chicory root at its facilities, with clinical trials involving various participant numbers that have shown benefits to digestive health.
Expansion of Functional Food Industry
The rapid growth of functional and fortified food products remains a central driver for dietary fibers. Food companies are developing innovative applications in dairy alternatives, beverages, and nutritional snacks to differentiate their offerings. The inclusion of fibers not only improves nutritional value but also enhances texture and satiety, boosting consumer acceptance. Governments and health organizations encouraging balanced diets further accelerate this growth. With functional food sales expanding globally, dietary fibers gain traction as a critical additive, ensuring consistent demand from both mainstream and premium product segments.
- For instance, Ingredion operates multiple fiber production sites globally, supplying resistant starches (like HI-MAIZE®) and soluble corn fibers (like VERSAFIBE™) that are incorporated into beverages and plant-based dairy alternatives worldwide.
Supportive Regulatory Environment
Regulatory support for healthy food labeling and clean-label products is accelerating the adoption of dietary fibers. Agencies like the FDA and EFSA mandate fiber content claims, driving food manufacturers to integrate more fibers into their products. Consumers increasingly trust regulated fiber-based claims, enhancing product credibility and market acceptance. Favorable dietary guidelines and national health initiatives promoting fiber intake continue to expand the consumer base. This supportive regulatory environment not only strengthens product positioning but also ensures steady innovation, benefiting suppliers and producers across the food and nutraceutical sectors.
Key Trends & Opportunities
Shift Toward Plant-Based Nutrition
The surge in plant-based food consumption creates strong opportunities for dietary fibers sourced from cereals, legumes, fruits, and vegetables. Rising vegan and vegetarian lifestyles, coupled with sustainability concerns, drive demand for plant-derived fibers. Consumers prefer natural, clean-label ingredients, boosting inclusion in dairy alternatives, plant-based meats, and fortified beverages. This trend expands the fiber market across both mainstream and specialty food categories. The alignment with sustainability goals and consumer preference for plant-based diets ensures lasting growth potential for fiber-rich, environmentally friendly product formulations.
- For instance, Kerry Group expanded its plant-based nutrition portfolio by producing soluble fibers from sources like the acacia tree, supplying fiber fortification for a wide range of products including plant-based dairy alternatives in Europe and North America.
Innovation in Fiber-Enriched Products
Product innovation in fiber fortification is a major trend shaping market opportunities. Manufacturers are developing soluble and insoluble fiber blends tailored for specific health outcomes, such as improved gut microbiota or blood sugar regulation. Functional foods, energy bars, and nutraceutical beverages are increasingly marketed with added fiber claims to appeal to health-conscious buyers. Technological advancements also allow better fiber integration without compromising taste or texture. This innovation-driven approach enables companies to expand into premium segments, creating competitive advantages while enhancing consumer trust in fiber-enriched solutions.
- For instance, Cargill offers ActiStar RT resistant tapioca starch, which launched with about 80% total dietary fiber, for use in functional foods and beverages.
Key Challenges
High Processing Costs
The extraction and processing of dietary fibers, particularly from natural and organic sources, involve high costs. Advanced technologies are required to maintain purity, solubility, and functional stability, making production expensive. These costs often translate into higher product prices, which can restrict adoption in price-sensitive markets. Smaller manufacturers face challenges in scaling due to these barriers, limiting competitiveness against large players. Balancing affordability with quality remains a critical challenge for the industry, slowing down broader penetration in developing economies where price sensitivity is high.
Consumer Acceptance and Awareness Gaps
Despite increasing health consciousness, consumer awareness of specific fiber benefits remains limited in many regions. Misunderstanding of soluble versus insoluble fiber advantages reduces adoption in certain categories. Additionally, some fiber-enriched products face acceptance barriers due to texture changes or taste issues. These factors can discourage repeat purchases and slow market growth. Addressing knowledge gaps through effective labeling, education, and product innovation is essential to overcoming consumer hesitancy. Without consistent awareness campaigns and accessible formulations, market expansion potential may remain underutilized in emerging economies.
Regional Analysis
North America
North America held the leading position in the food dietary fibers market in 2024, capturing 32% share. The region’s dominance stems from high health awareness, strong demand for functional foods, and supportive dietary guidelines promoting higher fiber intake. The U.S. remains the largest contributor, with a well-developed food and nutraceutical industry actively fortifying products with fibers. Rising prevalence of obesity, diabetes, and digestive health issues further drives consumption. Product innovation in bakery, beverages, and supplements continues to expand consumer reach, ensuring sustained growth in North America’s dietary fibers market.
Europe
Europe accounted for 28% share of the food dietary fibers market in 2024, supported by strong regulatory backing and widespread adoption of clean-label and plant-based nutrition. Countries such as Germany, the U.K., and France drive regional growth, with consumers preferring fiber-enriched foods to support weight management and cardiovascular health. EU health claims and labeling regulations encourage food manufacturers to fortify cereals, bakery goods, and beverages with dietary fibers. Rising demand for organic and natural products enhances fiber use from fruits, vegetables, and grains, positioning Europe as a key hub for dietary fiber innovation and adoption.
Asia-Pacific
Asia-Pacific represented 25% share of the food dietary fibers market in 2024, with rapid urbanization, shifting dietary habits, and growing middle-class health awareness driving demand. China, Japan, and India lead adoption, supported by expanding functional food, beverage, and supplement industries. Rising prevalence of lifestyle-related diseases such as diabetes and obesity is fueling consumer interest in fiber-rich products. Local manufacturers are increasingly incorporating fibers into traditional foods and modern snacks. Continuous expansion of retail channels and rising disposable incomes make Asia-Pacific one of the fastest-growing regions in the global dietary fibers market.
Latin America
Latin America captured 9% share of the food dietary fibers market in 2024, driven by growing demand for functional foods and fortified products. Brazil and Mexico lead the region, with increasing health awareness encouraging fiber incorporation into bakery, cereals, and beverages. Government nutrition campaigns promoting healthy diets further support adoption. However, price sensitivity and limited consumer knowledge of fiber benefits pose challenges to wider market penetration. Rising urbanization and expansion of supermarket chains are gradually boosting product availability, positioning Latin America as a developing market with steady opportunities for dietary fiber suppliers.
Middle East & Africa
The Middle East & Africa accounted for 6% share of the food dietary fibers market in 2024, reflecting growing but still limited adoption compared to other regions. Rising cases of lifestyle-related diseases such as obesity and diabetes are driving interest in fiber-enriched foods, particularly in Gulf Cooperation Council (GCC) countries. Increased investment in fortified bakery, cereals, and beverages is expanding availability. However, low consumer awareness and affordability issues remain barriers to growth in several African markets. Ongoing health education campaigns and the rise of modern retail outlets create long-term opportunities for dietary fiber expansion.
Market Segmentations:
By Type
- Soluble Dietary Fibers
- Insoluble Dietary Fibers
By Source
- Fruits & Vegetables
- Cereals & Grains
- Legumes
- Nuts & Seeds
By Application
- Functional Food & Beverages
- Pharmaceuticals & Nutraceuticals
- Animal Feed
- Other Applications (e.g., personal care, industrial use)
By End-Use Industry
- Food & Beverage Manufacturers
- Dietary Supplement Producers
- Pharmaceutical Companies
- Feed Manufacturers
By Geography
- North America
- Europe
- Germany
- France
- U.K.
- Italy
- Spain
- Rest of Europe
- Asia Pacific
- China
- Japan
- India
- South Korea
- South-east Asia
- Rest of Asia Pacific
- Latin America
- Brazil
- Argentina
- Rest of Latin America
- Middle East & Africa
- GCC Countries
- South Africa
- Rest of the Middle East and Africa
Competitive Landscape
The competitive landscape of the food dietary fibers market is shaped by leading players such as Cargill, Archer Daniels Midland Company (ADM), DuPont de Nemours, Ingredion Incorporated, Tate & Lyle, Roquette Frères, Kerry Group, Sudzucker (BENEO), Nexira, and Lonza Group. These companies maintain strong market positions through diversified product portfolios, global manufacturing capabilities, and investments in advanced fiber extraction technologies. Strategic initiatives such as mergers, acquisitions, and partnerships enable them to expand product applications across functional foods, beverages, and nutraceuticals. Innovation in soluble and insoluble fiber formulations tailored for gut health, weight management, and cardiovascular benefits strengthens their competitive edge. Regional expansion, supported by efficient distribution networks, ensures wider product reach, especially in emerging economies. Furthermore, sustainability initiatives and clean-label solutions are increasingly prioritized to align with consumer demand for natural and plant-based nutrition. This competitive focus on health-driven innovation and regulatory compliance continues to drive industry growth and differentiation.
Shape Your Report to Specific Countries or Regions & Enjoy 30% Off!
Key Player Analysis
Recent Developments
- In September 2025, Roquette Frères announced its H1 2025 results, underscoring strong performance in its food & nutrition segment amid portfolio diversification.
- In June 2025, Cargill, Incorporated launched ActiStar RT resistant tapioca starches aimed at low-net-carb foods. The ingredient offers at least 80% fiber content on a dry basis.
- In May 2025, Roquette Frères completed the acquisition of IFF Pharma Solutions, restructuring its business group approach and enhancing its nutrition and excipient portfolio
Report Coverage
The research report offers an in-depth analysis based on Type, Source, Application, End-Use Industry and Geography. It details leading market players, providing an overview of their business, product offerings, investments, revenue streams, and key applications. Additionally, the report includes insights into the competitive environment, SWOT analysis, current market trends, as well as the primary drivers and constraints. Furthermore, it discusses various factors that have driven market expansion in recent years. The report also explores market dynamics, regulatory scenarios, and technological advancements that are shaping the industry. It assesses the impact of external factors and global economic changes on market growth. Lastly, it provides strategic recommendations for new entrants and established companies to navigate the complexities of the market.
Future Outlook
- The market will expand steadily with rising demand for functional and fortified foods.
- Insoluble fibers will continue leading due to wide applications in bakery and cereals.
- Soluble fibers will gain faster growth driven by cholesterol and blood sugar management benefits.
- Plant-based and clean-label product trends will boost fiber adoption across food categories.
- Asia-Pacific will emerge as the fastest-growing region with increasing health awareness.
- North America and Europe will maintain dominance supported by regulatory backing and innovation.
- Fiber-enriched beverages and dairy alternatives will see strong consumer acceptance.
- Pharmaceutical and nutraceutical applications will expand with rising supplement consumption.
- Technological advances will improve fiber extraction and integration without affecting taste or texture.
- Sustainability and natural sourcing will become central to competitive strategies of leading players.


