Market Overview
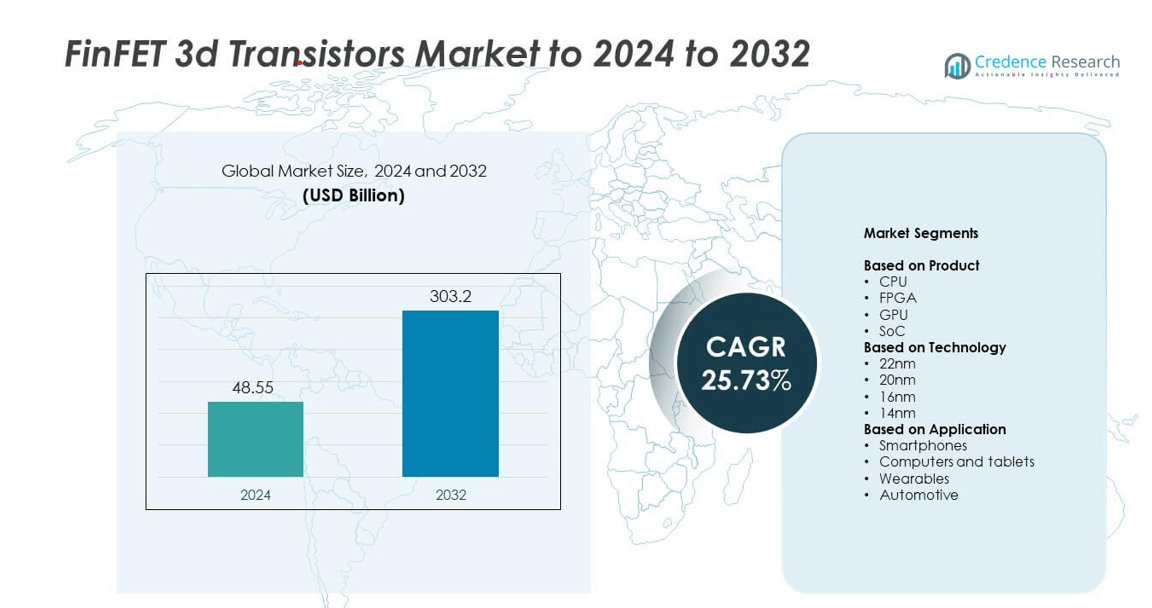
FinFET 3D Transistors market size was valued at USD 48.55 billion in 2024 and is anticipated to reach USD 303.2 billion by 2032, at a CAGR of 25.73% during the forecast period.
| REPORT ATTRIBUTE |
DETAILS |
| Historical Period |
2020-2023 |
| Base Year |
2024 |
| Forecast Period |
2025-2032 |
| FinFET 3D Transistors Market Size 2024 |
USD 48.55 billion |
| FinFET 3D Transistors Market, CAGR |
25.73% |
| FinFET 3D Transistors Market Size 2032 |
USD 303.2 billion |
The FinFET 3D transistors market is led by major players such as Taiwan Semiconductor Manufacturing Company Limited, Intel Corporation, Samsung Electronics Corporation Ltd., NVIDIA Corporation, Advanced Micro Devices, Inc., Broadcom, Inc., Qualcomm Technologies, Inc., MediaTek, Inc., GlobalFoundries, Inc., and Arm Holdings PLC. These companies dominate through strong R&D investments, process node advancements below 5nm, and strategic collaborations with fabless chip designers. North America remains the leading region with a 37% market share, driven by strong semiconductor manufacturing infrastructure and technological innovation. Asia Pacific follows closely, supported by large-scale production from leading foundries and rising demand for high-performance consumer electronics and AI-enabled devices.
Market Insights
- The FinFET 3D transistors market was valued at USD 48.55 billion in 2024 and is projected to reach USD 303.2 billion by 2032, growing at a CAGR of 25.73%.
- Growing demand for high-performance and power-efficient chips in smartphones, data centers, and AI-driven systems is fueling market expansion.
- The market trend is shifting toward sub-5nm node technologies and AI-integrated SoCs, enhancing computing power and energy efficiency.
- Leading companies are investing in advanced fabrication processes, with strong competition among global players focusing on 5G and autonomous systems.
- North America led the market with 37% share in 2024, followed by Asia Pacific with 32%, while the SoC segment dominated with 41% share across global applications.
Access crucial information at unmatched prices!
Request your sample report today & start making informed decisions powered by Credence Research Inc.!
Download Sample
Market Segmentation Analysis:
By Product
The SoC segment dominated the FinFET 3D transistors market in 2024 with a 41% share. The growth is driven by rising demand for compact, power-efficient, and high-performance chips in smartphones, IoT devices, and automotive electronics. SoCs integrate CPU, GPU, and AI accelerators into a single chip, enabling improved processing and reduced latency. Leading semiconductor companies like TSMC and Samsung are investing heavily in advanced SoC designs with FinFET technology to enhance transistor density and performance efficiency across 5G and AI-enabled consumer devices.
- For instance, Qualcomm’s Snapdragon 8 Gen 3 significantly advanced on-device AI capabilities by leveraging its upgraded Hexagon NPU. It was announced with a promise of up to 98% faster AI performance and 40% better performance per watt for AI tasks compared to the previous generation.
By Technology
The 16nm technology segment held the largest share of 38% in 2024, driven by strong adoption in high-performance computing and mobile processors. This node provides a balance between performance, power efficiency, and cost, making it suitable for mass production. Companies such as Intel and GlobalFoundries are leveraging 16nm FinFET processes to improve chip yield and reduce leakage current. The increasing use of this node in AI accelerators and data center processors further strengthens its market dominance over smaller geometries like 14nm and 20nm.
- For instance, NVIDIA’s GP104 (TSMC 16 nm) integrates 7.2 billion transistors on a ~314–317 mm² die.
By Application
The smartphones segment accounted for the largest share of 46% in 2024. The segment’s dominance stems from the growing integration of FinFET-based SoCs in flagship and mid-range smartphones for better power management and processing speed. FinFET transistors enable enhanced battery efficiency, signal integrity, and 5G compatibility. Major chipmakers such as Qualcomm and MediaTek are increasingly using FinFET designs to deliver advanced AI and image processing capabilities, reinforcing the smartphone segment as the key revenue driver within the FinFET 3D transistors market.
Key Growth Drivers
Rising Demand for High-Performance and Energy-Efficient Devices
The increasing use of FinFET 3D transistors in smartphones, computers, and data centers is driving market expansion. These transistors enable improved performance, reduced leakage current, and lower power consumption. The demand for energy-efficient chips is accelerating due to the growing deployment of AI, machine learning, and 5G applications. Semiconductor manufacturers are adopting FinFET structures to meet the processing power and thermal efficiency required in next-generation devices and servers.
- For instance, NVIDIA’s H100 (GH100) uses TSMC 4N with ~80 billion transistors and an ~814 mm² die.
Expansion of AI and IoT Applications
FinFET 3D transistors are increasingly integrated into AI-driven and IoT-enabled systems, enabling faster data processing and real-time analytics. Their superior power efficiency and scalability make them suitable for smart home, industrial automation, and wearable devices. With AI training workloads rising, data center operators are relying on FinFET-based GPUs and SoCs for enhanced parallel processing capabilities. This rapid adoption across AI and IoT ecosystems fuels steady growth in demand for FinFET designs.
- For instance, MediaTek’s Dimensity 9300 lists 22.7 billion transistors on a 4 nm process.
Growing Investments in Semiconductor Fabrication
Governments and private firms are heavily investing in semiconductor manufacturing to secure supply chains and boost technological independence. FinFET technology remains a central focus of these initiatives due to its role in advanced node manufacturing. Key foundries such as TSMC, Samsung, and Intel are expanding fabrication capacities and developing new process nodes below 5nm. These investments are increasing production volumes and driving continuous innovation in transistor performance and miniaturization.
Key Trends and Opportunities
Transition Toward Sub-5nm Process Nodes
The industry is rapidly shifting toward sub-5nm technologies to achieve higher transistor density and improved performance. FinFET structures are being optimized for extreme ultraviolet (EUV) lithography to reduce defect rates and enhance yields. Companies are exploring nanosheet and gate-all-around (GAA) variants to push FinFET scalability limits. This evolution presents opportunities for chipmakers to deliver faster, smaller, and more power-efficient devices across consumer electronics and data infrastructure markets.
- For instance, TSMC moved 3 nm (N3) FinFET into high-volume production in 2022.
Integration in Automotive and Edge Computing Applications
FinFET 3D transistors are increasingly used in automotive electronics, including ADAS and autonomous driving systems. Their ability to support high-speed computing and lower power dissipation makes them ideal for real-time vehicle decision-making. Similarly, edge computing applications benefit from FinFET-based SoCs that handle data processing locally, reducing latency. These advancements create strong opportunities for semiconductor manufacturers targeting smart mobility and distributed computing ecosystems.
- For instance, NXP’s S32G3 on 16 nm FinFET offers up to 20 MB on-chip system SRAM and mixed Cortex-A53/M7 complexes.
Key Challenges
High Manufacturing Complexity and Cost
The fabrication of FinFET transistors involves intricate process steps, demanding advanced lithography and design tools. The rising costs of EUV equipment and cleanroom facilities increase capital expenditure, limiting accessibility for smaller foundries. Additionally, achieving defect-free yields at smaller nodes remains a technical challenge. This cost-intensive environment creates entry barriers and affects profitability, particularly for emerging semiconductor players.
Thermal Management and Design Limitations
As transistor density increases, managing heat dissipation within compact designs becomes difficult. FinFET devices face challenges in maintaining thermal stability during high-frequency operations, which can impact long-term reliability. Design engineers are focusing on new materials and cooling methods to mitigate thermal bottlenecks. However, these innovations add complexity and require significant R&D investment, posing challenges for widespread implementation in cost-sensitive markets.
Regional Analysis
North America
North America held the largest share of 37% in the FinFET 3D transistors market in 2024. The region’s dominance stems from strong presence of semiconductor giants like Intel, AMD, and Qualcomm, driving high adoption of FinFET-based processors in data centers, consumer electronics, and automotive systems. Growing investments in AI and 5G infrastructure continue to strengthen regional demand. The U.S. government’s semiconductor funding initiatives, such as the CHIPS Act, further support production and R&D expansion. Rising demand for high-performance computing and energy-efficient processors keeps North America a leading market for advanced FinFET technologies.
Europe
Europe accounted for a 24% market share in 2024, supported by rising demand for FinFET chips in automotive electronics and industrial automation. Countries such as Germany, France, and the U.K. are accelerating semiconductor innovation through digital transformation projects and strategic partnerships. The growing adoption of electric vehicles and smart manufacturing technologies is fueling the use of FinFET-based SoCs and GPUs. European chip design firms are collaborating with global foundries to improve supply resilience and performance standards, positioning the region as a strong contributor to the FinFET 3D transistors ecosystem.
Asia Pacific
Asia Pacific captured a 32% share of the FinFET 3D transistors market in 2024, driven by expanding electronics manufacturing and strong foundry presence. Nations such as Taiwan, South Korea, Japan, and China host major semiconductor manufacturers like TSMC, Samsung, and SMIC. The growing demand for smartphones, AI chips, and data center processors is accelerating FinFET adoption. Continuous investments in process nodes below 10nm and local fabrication facilities enhance the region’s technological competitiveness. Rapid digitalization and 5G rollout across key economies make Asia Pacific the fastest-growing market for FinFET-based devices.
Middle East, Africa, and Latin America
The rest of the world accounted for a 7% share of the FinFET 3D transistors market in 2024. Growth in the Middle East, Africa, and Latin America is driven by increasing adoption of connected devices and smart infrastructure. Governments are investing in digital transformation projects and data centers to support regional semiconductor demand. Although the manufacturing base is limited, partnerships with global chipmakers are expanding technology access. As energy-efficient electronics and IoT ecosystems evolve, these regions are gradually emerging as promising markets for FinFET-enabled applications.
Market Segmentations:
By Product
By Technology
By Application
- Smartphones
- Computers and tablets
- Wearables
- Automotive
By Geography
- North America
- Europe
- Germany
- France
- U.K.
- Italy
- Spain
- Rest of Europe
- Asia Pacific
- China
- Japan
- India
- South Korea
- South-east Asia
- Rest of Asia Pacific
- Latin America
- Brazil
- Argentina
- Rest of Latin America
- Middle East & Africa
- GCC Countries
- South Africa
- Rest of the Middle East and Africa
Competitive Landscape
The FinFET 3D transistors market is led by companies such as Taiwan Semiconductor Manufacturing Company Limited, Intel Corporation, NVIDIA Corporation, Samsung Electronics Corporation Ltd., Advanced Micro Devices, Inc., Broadcom, Inc., Qualcomm Technologies, Inc., MediaTek, Inc., GlobalFoundries, Inc., Arm Holdings PLC, Huawei Technologies Co., Ltd., United Microelectronics Corporation, Semiconductor Manufacturing International Corporation, and Xilinx, Inc. The competitive landscape is defined by continuous innovation, aggressive R&D investment, and rapid process node advancements. Industry leaders are focusing on scaling transistor geometry below 5nm to enhance performance and energy efficiency. Foundries are strengthening collaborations with fabless design firms to optimize manufacturing throughput and shorten development cycles. Strategic partnerships and mergers are increasing as firms aim to expand chip design capabilities and maintain technological leadership. Additionally, companies are investing heavily in AI, 5G, and data center applications, driving competition in high-performance semiconductor production and advanced packaging technologies across global markets.
Shape Your Report to Specific Countries or Regions & Enjoy 30% Off!
Key Player Analysis
- Taiwan Semiconductor Manufacturing Company Limited
- Intel Corporation
- NVIDIA Corporation
- Samsung Electronics Corporation Ltd.
- Advanced Micro Devices, Inc.
- Broadcom, Inc.
- Qualcomm Technologies, Inc.
- MediaTek, Inc.
- GlobalFoundries, Inc.
- Arm Holdings PLC
- Huawei Technologies Co., Ltd.
- United Microelectronics Corporation
- Semiconductor Manufacturing International Corporation
- Xilinx, Inc.
Recent Developments
- In 2024, Arm Holdings Collaborated with Samsung Foundry to develop an AI CPU chiplet platform for datacenters, showcasing Arm’s ongoing development in advanced technologies.
- In 2023, Intel Corporation launched the Intel 4 node, and it first appeared in the Meteor Lake generation of processors
- In 2022, TSMC became the first foundry to move 3nm FinFET (N3) technology into high-volume production
Report Coverage
The research report offers an in-depth analysis based on Product, Technology, Application and Geography. It details leading market players, providing an overview of their business, product offerings, investments, revenue streams, and key applications. Additionally, the report includes insights into the competitive environment, SWOT analysis, current market trends, as well as the primary drivers and constraints. Furthermore, it discusses various factors that have driven market expansion in recent years. The report also explores market dynamics, regulatory scenarios, and technological advancements that are shaping the industry. It assesses the impact of external factors and global economic changes on market growth. Lastly, it provides strategic recommendations for new entrants and established companies to navigate the complexities of the market.
Future Outlook
- FinFET 3D transistors will continue gaining traction in next-generation AI and 5G processors.
- Demand from data centers and high-performance computing will drive ongoing market expansion.
- Advancements in sub-3nm nodes will enhance transistor density and power efficiency.
- Integration of FinFET technology in automotive electronics will support autonomous driving growth.
- Increasing adoption in IoT and edge computing devices will create new opportunities.
- Governments will boost domestic semiconductor production to strengthen supply security.
- Collaboration between foundries and design firms will speed FinFET innovation.
- Advanced cooling and thermal management solutions will improve design reliability.
- Asia Pacific will emerge as a key production hub for FinFET-based chips.
- Ongoing research into Gate-All-Around transistors may shape the next FinFET evolution phase.


