Market Overview
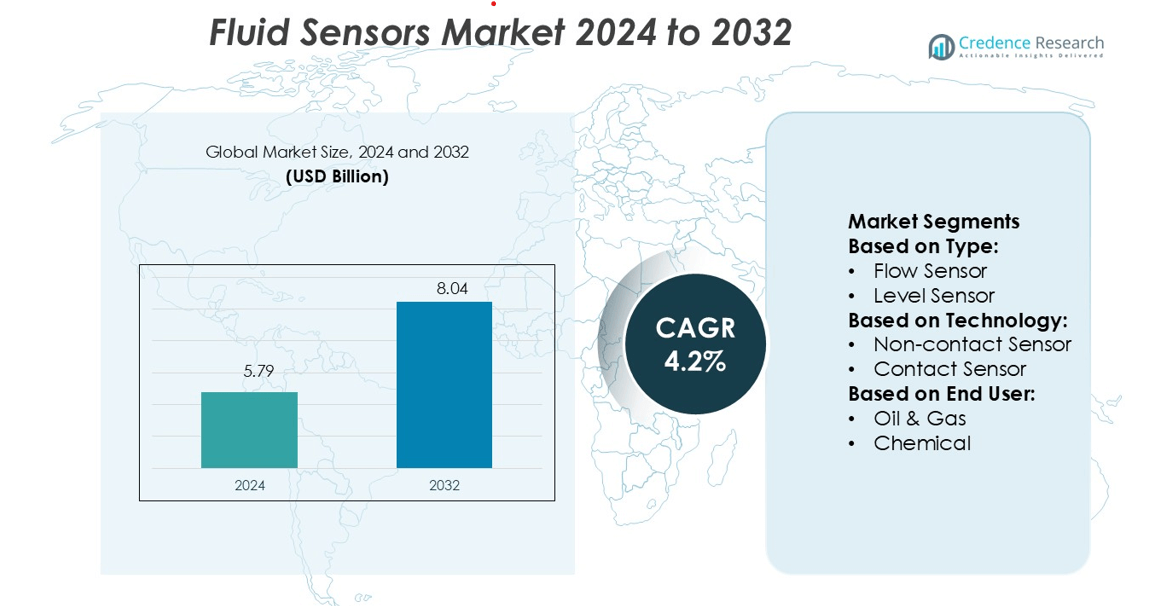
Fluid Sensors Market size was valued USD 5.79 billion in 2024 and is anticipated to reach USD 8.04 billion by 2032, at a CAGR of 4.2% during the forecast period.
| REPORT ATTRIBUTE |
DETAILS |
| Historical Period |
2020-2023 |
| Base Year |
2024 |
| Forecast Period |
2025-2032 |
| Fluid Sensors Market Size 2024 |
USD 5.79 billion |
| Fluid Sensors Market, CAGR |
4.2% |
| Fluid Sensors Market Size 2032 |
USD 8.04 billion |
The fluid sensors market is shaped by major players such as TE Connectivity, Yokogawa Electric Corporation, Siemens AG, NXP Semiconductors N.V., Omron Corporation, SICK AG, Honeywell International, Inc., Infineon Technologies AG, Schneider Electric SE, and FUTEK Advanced Sensor Technology, Inc. These companies focus on developing high-precision, energy-efficient, and IoT-integrated sensor solutions to meet rising demand in industrial, automotive, and water management applications. Strategic collaborations, product innovation, and regional expansion remain core growth strategies. North America leads the global fluid sensors market with a 33.2% share, supported by strong industrial automation, advanced infrastructure, and early technology adoption. The presence of key manufacturers and a mature end-user base further strengthen the region’s leadership.
Market Insights
- The fluid sensors market was valued at USD 5.79 billion in 2024 and is projected to reach USD 8.04 billion by 2032, growing at a CAGR of 4.2%.
- Rising demand for advanced monitoring solutions in automotive, industrial, and water management sectors is driving market expansion.
- IoT integration, miniaturization, and AI-based predictive analytics are emerging as key trends shaping product innovation and adoption.
- Leading companies focus on precision, energy efficiency, and connectivity to strengthen their competitive position through product launches and strategic partnerships.
- North America dominates the market with a 33.2% share, supported by strong industrial automation, while flow sensors hold the largest segment share due to their broad application in process industries.
Access crucial information at unmatched prices!
Request your sample report today & start making informed decisions powered by Credence Research Inc.!
Download Sample
Market Segmentation Analysis:
By Type
Flow sensors hold the dominant share of 57.2% in the fluid sensors market. Their strong position is driven by growing adoption in process industries and automotive applications. These sensors ensure accurate measurement of fluid movement, improving operational efficiency and system reliability. Industries rely on real-time flow monitoring to optimize production and reduce waste. Technological innovations in miniaturized and smart flow sensors further support demand. Their integration with automated control systems enhances precision, making flow sensors the preferred choice across high-volume and critical fluid handling processes.
- For instance, Renesas Electronics’ FS1012 series micro-flow sensors can measure flow rates as low as 0.5 SLPM with a fast response time of under 5 ms, enabling high-accuracy fluid monitoring in automotive and industrial systems.
By Technology
Non-contact sensors account for 61.4% of the market share, leading this segment due to their high accuracy and durability. These sensors reduce wear and maintenance needs since they operate without direct contact with fluids. Their use in harsh and corrosive environments makes them valuable for chemical, oil and gas, and water treatment plants. Non-contact technology also enables real-time monitoring in sealed systems, supporting advanced process automation. Their superior reliability and lower lifecycle costs continue to drive preference over traditional contact-based solutions.
- For instance, Yokogawa’s DTSX distributed temperature sensor uses a fiber-optic cable for direct-contact temperature profiling over sensing spans up to 1,000 meters. The system enables continuous temperature profiling without insertion probes and with a spatial resolution of 1 meter or better, depending on the model.
By End User
The automotive sector dominates with a 28.6% share in the end-user segment. Growing vehicle production and increasing adoption of advanced fluid management systems fuel this dominance. Fluid sensors in vehicles monitor coolant, brake, and transmission fluid levels, ensuring performance and safety. Rising electric vehicle manufacturing further increases sensor integration for thermal management systems. Regulatory focus on safety and emissions standards strengthens demand. Automotive OEMs also adopt smart sensor technologies to support predictive maintenance and enhance vehicle reliability, reinforcing this segment’s leadership.
Key Growth Drivers
Rising Adoption of Automation and Smart Monitoring
The growing demand for automated process control is boosting fluid sensor adoption. Industries use smart sensors to monitor flow, level, and pressure with high accuracy. Automated systems reduce manual intervention and minimize downtime. In manufacturing, power, and water treatment plants, real-time monitoring improves operational efficiency. Smart fluid sensors also enable predictive maintenance and cost optimization. As industries shift toward Industry 4.0 and IoT integration, demand for connected and intelligent sensor solutions continues to rise across multiple end-use sectors.
- For instance, Siemens’ SIWA Leak Finder analyzes flow data from its Sitrans FM Mag8000 sensor and identifies leaks as small as 0.2 liters per second, enabling earlier fault detection.
Expansion of Industrial and Water Infrastructure
Rapid industrialization and water infrastructure development are key growth drivers. Utilities and municipalities increasingly deploy fluid sensors for leak detection, level control, and network optimization. These sensors improve water management efficiency and support compliance with environmental regulations. Industrial sectors such as oil and gas, chemical, and food processing depend on accurate fluid measurement to maintain process quality. Growing investments in water supply, wastewater treatment, and industrial upgrades directly fuel sensor deployment in large-scale networks and production plants.
- For instance, NXP’s MPX5xxx differential pressure sensors—used in flow metering applications—offer sensor spans up to 100 kPa and provide a high-level analog output signal. These sensors feature integrated signal conditioning and temperature compensation, enabling precise pressure measurement in water lines and other industrial applications.
Strong Regulatory Push for Efficiency and Safety
Tighter environmental and safety regulations are accelerating fluid sensor adoption. Industries must ensure safe handling of liquids, gases, and chemicals under regulatory standards. Fluid sensors help maintain critical parameters like pressure, temperature, and flow rates to prevent failures. Compliance-driven monitoring systems reduce emissions, detect leaks early, and improve workplace safety. Energy, chemical, and power industries are increasingly deploying advanced sensor technologies to meet regulatory goals. This push for sustainability and compliance is creating strong market momentum.
Key Trends & Opportunities
Integration of IoT and Wireless Communication
The market is shifting toward connected fluid sensors with IoT-enabled features. Wireless sensors allow remote monitoring, real-time alerts, and cloud-based analytics. This improves flexibility in system design and reduces installation costs. IoT integration supports predictive maintenance and data-driven decision-making. Industries like oil and gas, water treatment, and manufacturing are adopting these solutions to enhance efficiency. The combination of IoT, edge computing, and AI is opening opportunities for advanced, scalable fluid sensing systems.
- For instance, Omron’s E8FC flow sensor supports IO-Link at COM3 (230.4 kbps) while outputting analog current signals, enabling diagnostics and remote parameter tuning.
Growing Demand for Energy-Efficient and Compact Sensors
Energy-efficient and miniaturized sensor solutions are gaining traction. Compact sensors with low power consumption meet the needs of modern automated systems. Manufacturers are focusing on high-performance designs that lower operational costs and extend device life. These sensors are especially valuable in portable, battery-powered, or remote applications. Their integration supports sustainability goals and enhances system performance. This trend is creating strong opportunities for innovation in product design and technology integration.
- For instance, SICK’s new OD200 µm optical displacement sensor offers measurement ranges of 25 mm to 160 mm with repeatability down to 2 µm, while its process speed reaches 3 kHz, enabling high precision in a compact form factor.
Rising Use in Renewable Energy and Environmental Projects
Fluid sensors are finding broader applications in renewable energy and environmental monitoring. In solar thermal plants, sensors control fluid flow to optimize energy output. In hydropower and wastewater treatment, they enable precise level and pressure monitoring. Governments and private sectors are investing heavily in sustainable infrastructure. This creates demand for advanced sensing solutions that support energy efficiency and environmental compliance. Sensor suppliers focusing on eco-friendly and durable technologies are well-positioned to benefit.
Key Challenges
High Installation and Integration Costs
The upfront cost of advanced sensor systems remains a major barrier. Integrating fluid sensors with legacy infrastructure requires specialized equipment and skilled labor. Many small and medium enterprises hesitate to invest in high-end monitoring solutions. Wireless and smart sensors also demand compatible control systems, increasing total deployment cost. High initial investment slows adoption in cost-sensitive sectors. Manufacturers must focus on cost optimization and modular integration to overcome this challenge.
Technical Limitations in Harsh Environments
Fluid sensors often face performance issues in extreme industrial environments. Exposure to high temperature, pressure, or corrosive fluids can reduce accuracy and lifespan. Regular calibration and maintenance increase operational costs. In industries like oil and gas or chemical processing, sensor failures can disrupt operations and compromise safety. These technical constraints limit adoption in demanding applications. Development of robust, corrosion-resistant, and self-calibrating sensors is essential to address these challenges.
Regional Analysis
North America
North America leads the fluid sensors market with a 33.2% share in 2024. The region benefits from rapid adoption of advanced sensing technologies in automotive, oil and gas, and water management applications. Strong regulatory standards on fluid monitoring drive demand for precise and durable sensors. The presence of key manufacturers and R&D hubs strengthens innovation and product quality. Growing investment in smart infrastructure and predictive maintenance solutions further accelerates market growth. The U.S. remains the dominant country, supported by its mature industrial base and increasing integration of IoT-enabled fluid sensing systems.
Europe
Europe accounts for 28.6% of the global fluid sensors market share in 2024. The region’s growth is driven by strict environmental regulations and strong adoption of automation technologies in industries such as chemicals, power generation, and wastewater management. Major European countries are modernizing production facilities to improve operational efficiency and safety standards. Investment in Industry 4.0 initiatives enhances sensor deployment across process industries. Germany, the UK, and France lead due to advanced manufacturing bases and strong R&D capabilities. The demand for high-precision and energy-efficient sensors continues to rise steadily across the region.
Asia Pacific
Asia Pacific holds 29.8% of the global fluid sensors market share in 2024. The region’s growth is propelled by rapid industrialization, large-scale infrastructure projects, and expanding automotive manufacturing. Countries like China, India, Japan, and South Korea are investing heavily in smart factory development and water treatment systems. Rising adoption of automation technologies drives sensor integration across multiple industries. Government initiatives supporting industrial digitalization and energy efficiency boost demand further. Asia Pacific is expected to show the fastest growth rate during the forecast period, supported by a strong manufacturing ecosystem and expanding export markets.
Latin America
Latin America represents 5.2% of the global fluid sensors market share in 2024. The region is experiencing growing adoption of sensing technologies in oil and gas, water utilities, and food processing sectors. Industrial modernization in Brazil, Argentina, and Mexico is driving investments in fluid monitoring infrastructure. Demand for cost-effective and robust sensors is increasing as industries focus on operational efficiency and regulatory compliance. Expansion of smart water management projects and energy sector upgrades further supports market development. Though smaller in size, the region presents steady growth opportunities for global sensor manufacturers.
Middle East & Africa
The Middle East & Africa account for 3.2% of the global fluid sensors market share in 2024. The market is driven by rising investments in oil and gas, water desalination, and utility projects. GCC countries are integrating advanced monitoring systems to optimize resource use and improve operational reliability. Government-led infrastructure initiatives and diversification programs are expanding the scope for automation. Africa is emerging with increasing adoption in mining and water treatment facilities. While the market is in its early stage, growing infrastructure projects and modernization initiatives are expected to fuel steady demand.
Market Segmentations:
By Type:
By Technology:
- Non-contact Sensor
- Contact Sensor
By End User:
By Geography
- North America
- Europe
- Germany
- France
- U.K.
- Italy
- Spain
- Rest of Europe
- Asia Pacific
- China
- Japan
- India
- South Korea
- South-east Asia
- Rest of Asia Pacific
- Latin America
- Brazil
- Argentina
- Rest of Latin America
- Middle East & Africa
- GCC Countries
- South Africa
- Rest of the Middle East and Africa
Competitive Landscape
The competitive landscape of the fluid sensors market is shaped by key players including TE Connectivity, Yokogawa Electric Corporation, Siemens AG, NXP Semiconductors N.V., Omron Corporation, SICK AG, Honeywell International, Inc., Infineon Technologies AG, Schneider Electric SE, and FUTEK Advanced Sensor Technology, Inc. The fluid sensors market is defined by rapid technological advancements and strategic growth initiatives. Leading companies focus on enhancing sensor accuracy, durability, and connectivity to meet rising industrial automation and water management needs. Heavy investments in R&D drive the development of compact, energy-efficient, and IoT-integrated sensing solutions. Many players are expanding their global reach through strategic partnerships, product launches, and acquisitions. Advanced features such as AI-driven analytics and wireless communication are strengthening real-time monitoring capabilities. Strong distribution networks, regulatory compliance, and customer-focused solutions help companies maintain a competitive edge. Continuous innovation and smart manufacturing remain central to capturing emerging opportunities in high-demand industries.
Shape Your Report to Specific Countries or Regions & Enjoy 30% Off!
Key Player Analysis
- TE Connectivity
- Yokogawa Electric Corporation
- Siemens AG
- NXP Semiconductors N.V.
- Omron Corporation
- SICK AG
- Honeywell International, Inc.
- Infineon Technologies AG
- Schneider Electric SE
- FUTEK Advanced Sensor Technology, Inc.
Recent Developments
- In June 2025, Crane Company agreed to acquire Precision Sensors & Instrumentation from Baker Hughes for expanding its Druck and Reuter-Stokes brands.It has signed an agreement to acquire Precision Sensors & Instrumentation (PSI), a leading provider of sensor-based technologies for aerospace.
- In June 2024, Flowserve and Heide Refinery announced a partnership to implement Flowserve’s Energy Advantage Program, aiming to reduce energy consumption and carbon emissions. The program’s initial phase estimated a 2,000 MWh power reduction, leading to 1,300 metric tons of CO2 savings.
- In February 2024, Panasonic released its ultrasonic flow and concentration meter for hydrogen in China. This product measures hydrogen flow, concentration, and temperature, pressure, and humidity simultaneously, with a broad measurement range and digital/analog output capabilities.
- In May 2023, PSG® Biotech, a provider of pump, flow-sensor and flow-measurement technologies, unveiled its latest BioProTT™ FlowSU System along with updated SumoFlo® CPFM-8103 Single-Use Coriolis Mass Flow Meter technologies.
Report Coverage
The research report offers an in-depth analysis based on Technology, Application, End-User and Geography. It details leading market players, providing an overview of their business, product offerings, investments, revenue streams, and key applications. Additionally, the report includes insights into the competitive environment, SWOT analysis, current market trends, as well as the primary drivers and constraints. Furthermore, it discusses various factors that have driven market expansion in recent years. The report also explores market dynamics, regulatory scenarios, and technological advancements that are shaping the industry. It assesses the impact of external factors and global economic changes on market growth. Lastly, it provides strategic recommendations for new entrants and established companies to navigate the complexities of the market.
Future Outlook
- The market will see strong adoption of IoT-enabled fluid sensors across industries.
- Integration of AI and predictive analytics will enhance real-time monitoring capabilities.
- Demand for compact and energy-efficient sensors will continue to grow rapidly.
- Smart manufacturing and automation initiatives will drive large-scale deployment.
- Expansion in water and wastewater management applications will support steady growth.
- Increasing use of wireless sensor networks will improve operational flexibility.
- Strict regulatory standards will encourage advanced sensor technology adoption.
- The automotive sector will expand sensor integration in fuel and fluid systems.
- Emerging economies will experience rising investment in fluid monitoring infrastructure.
- Continuous innovation and product customization will shape future market competition.


