CHAPTER NO. 1 : INTRODUCTION 27
1.1.1. Report Description 27
Purpose of the Report 27
USP & Key Offerings 27
1.1.2. Key Benefits for Stakeholders 27
1.1.3. Target Audience 28
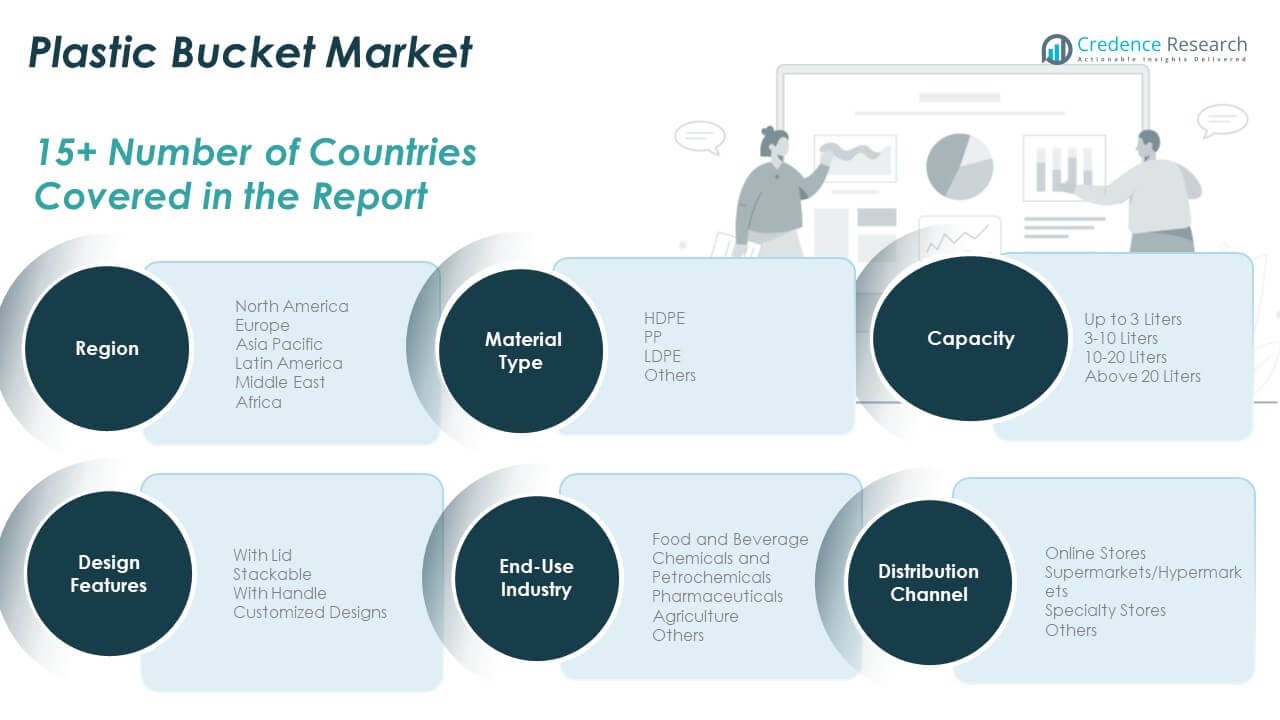
1.1.4. Report Scope 28
1.1.5. Regional Scope 29
CHAPTER NO. 2 : EXECUTIVE SUMMARY 30
2.1. Plastic Bucket Market Snapshot 30
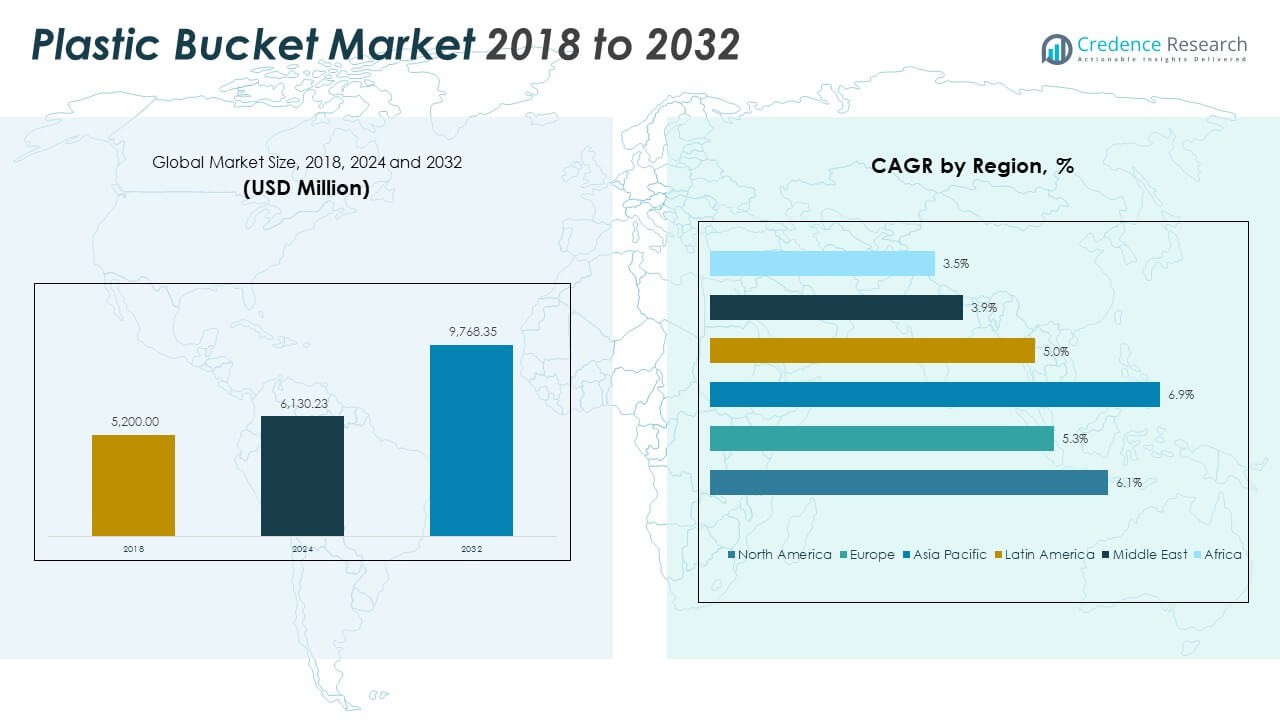
2.1.1. Global Plastic Bucket Market, 2018 – 2032 (USD Million) 32
CHAPTER NO. 3 : GEOPOLITICAL CRISIS IMPACT ANALYSIS 33
3.1. Russia-Ukraine and Israel-Palestine War Impacts 33
CHAPTER NO. 4 : PLASTIC BUCKET MARKET – INDUSTRY ANALYSIS 34
4.1. Introduction 34
4.2. Market Drivers 35
4.2.1. Rising Demand from Industrial Packaging 35
4.2.2. Growth in Construction and Infrastructure 36
4.3. Market Restraints 37
4.3.1. Environmental Regulations on Plastic Use 37
4.4. Market Opportunities 38
4.4.1. Market Opportunity Analysis 38
4.5. Porter’s Five Forces Analysis 39
CHAPTER NO. 5 : IMPORT EXPORT ANALYSIS 40
5.1. Import Analysis by Region 40
5.1.1. Global Plastic Bucket Market Import Volume/Revenue, By Region, 2018 – 2023 40
5.2. Export Analysis by Region 41
5.2.1. Global Plastic Bucket Market Export Volume/Revenue, By Region, 2018 – 2023 41
CHAPTER NO. 6 : ANALYSIS COMPETITIVE LANDSCAPE 42
6.1. Company Market Share Analysis – 2024 42
6.1.1. Global Plastic Bucket Market: Company Market Share, by Volume, 2024 42
6.1.2. Global Plastic Bucket Market: Company Market Share, by Revenue, 2024 43
6.1.3. Global Plastic Bucket Market: Top 6 Company Market Share, by Revenue, 2024 43
6.1.4. Global Plastic Bucket Market: Top 3 Company Market Share, by Revenue, 2024 44
6.2. Global Plastic Bucket Market Company Revenue Market Share, 2024 45
6.3. Company Assessment Metrics, 2023 46
6.3.1. Stars 46
6.3.2. Emerging Leaders 46
6.3.3. Pervasive Players 46
6.3.4. Participants 46
6.4. Start-ups /SMEs Assessment Metrics, 2023 46
6.4.1. Progressive Companies 46
6.4.2. Responsive Companies 46
6.4.3. Dynamic Companies 46
6.4.4. Starting Blocks 46
6.5. Strategic Developments 47
6.5.1. Acquisitions & Mergers 47
New Product Launch 47
Regional Expansion 47
6.6. Key Players Product Matrix 48
CHAPTER NO. 7 : PESTEL & ADJACENT MARKET ANALYSIS 49
7.1. PESTEL 49
7.1.1. Political Factors 49
7.1.2. Economic Factors 49
7.1.3. Social Factors 49
7.1.4. Technological Factors 49
7.1.5. Environmental Factors 49
7.1.6. Legal Factors 49
7.2. Adjacent Market Analysis 49
CHAPTER NO. 8 : PLASTIC BUCKET MARKET – BY MATERIAL TYPE SEGMENT ANALYSIS 50
8.1. Plastic Bucket Market Overview, by Material Type Segment 50
8.1.1. Plastic Bucket Market Revenue Share, By Material Type, 2023 & 2032 51
8.1.2. Plastic Bucket Market Attractiveness Analysis, By Material Type 52
8.1.3. Incremental Revenue Growth Opportunity, by Material Type, 2024 – 2032 52
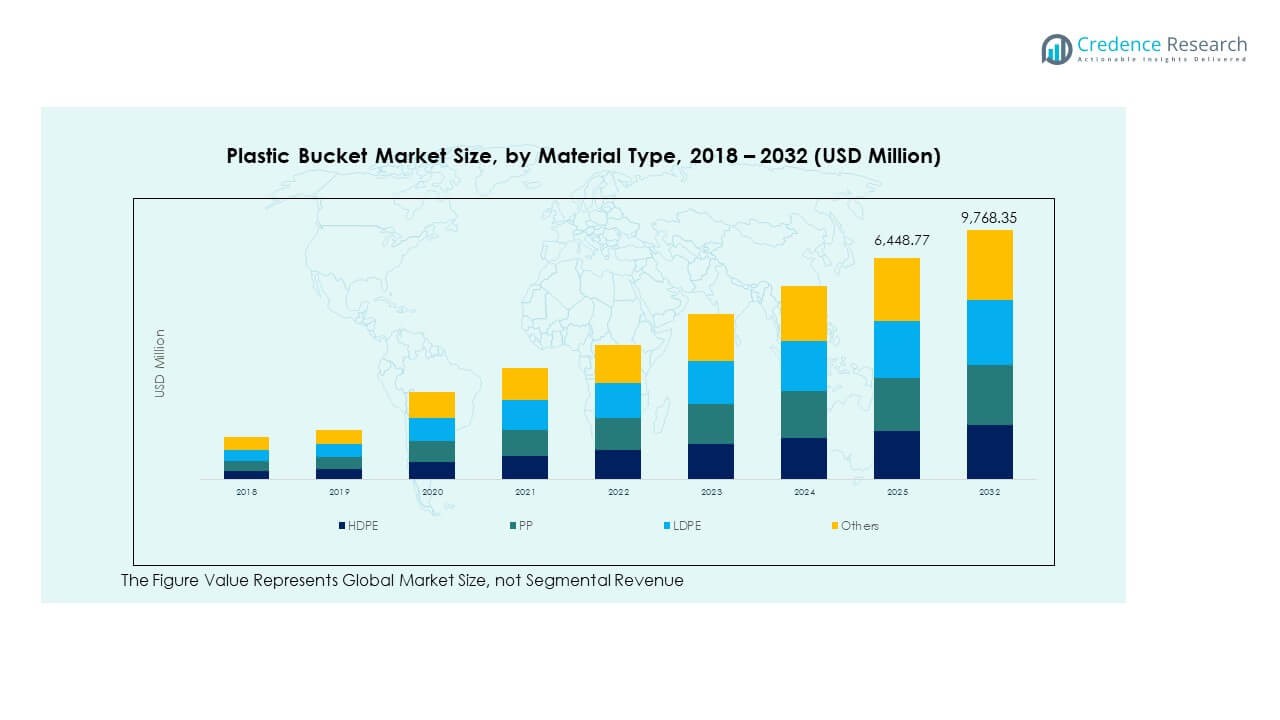
8.1.4. Plastic Bucket Market Revenue, By Material Type, 2018, 2023, 2027 & 2032 53
8.2. HDPE 54
8.2.1. Global HDPE Plastic Bucket Market Revenue, By Region, 2018 – 2023 (USD Million) 55
8.2.2. Global HDPE Plastic Bucket Market Revenue, By Region, 2024 – 2032 (USD Million) 55
8.3. PP 56
8.3.1. Global PP Plastic Bucket Market Revenue, By Region, 2018 – 2023 (USD Million) 57
8.3.2. Global PP Plastic Bucket Market Revenue, By Region, 2024 – 2032 (USD Million) 57
8.4. LDPE 58
8.4.1. Global LDPE Plastic Bucket Market Revenue, By Region, 2018 – 2023 (USD Million) 59
8.4.2. Global LDPE Plastic Bucket Market Revenue, By Region, 2024 – 2032 (USD Million) 59
8.5. Others 60
8.5.1. Global Others Plastic Bucket Market Revenue, By Region, 2018 – 2023 (USD Million) 61
8.5.2. Global Others Plastic Bucket Market Revenue, By Region, 2024 – 2032 (USD Million) 61
CHAPTER NO. 9 : PLASTIC BUCKET MARKET – BY CAPACITY SEGMENT ANALYSIS 62
9.1. Plastic Bucket Market Overview, by Capacity Segment 62
9.1.1. Plastic Bucket Market Revenue Share, By Capacity, 2023 & 2032 63
9.1.2. Plastic Bucket Market Attractiveness Analysis, By Capacity 64
9.1.3. Incremental Revenue Growth Opportunity, by Capacity, 2024 – 2032 64
9.1.4. Plastic Bucket Market Revenue, By Capacity, 2018, 2023, 2027 & 2032 65
9.2. Up to 3 Liters 66
9.2.1. Global Up to 3 Liters Plastic Bucket Market Revenue, By Region, 2018 – 2023 (USD Million) 67
9.2.2. Global Up to 3 Liters Plastic Bucket Market Revenue, By Region, 2024 – 2032 (USD Million) 67
9.3. 3-10 Liters 68
9.3.1. Global 3-10 Liters Plastic Bucket Market Revenue, By Region, 2018 – 2023 (USD Million) 69
9.3.2. Global 3-10 Liters Plastic Bucket Market Revenue, By Region, 2024 – 2032 (USD Million) 69
9.4. 10-20 Liters 70
9.4.1. Global 10-20 Liters Plastic Bucket Market Revenue, By Region, 2018 – 2023 (USD Million) 71
9.4.2. Global 10-20 Liters Plastic Bucket Market Revenue, By Region, 2024 – 2032 (USD Million) 71
9.5. Above 20 Liters 72
9.5.1. Global Above 20 Liters Plastic Bucket Market Revenue, By Region, 2018 – 2023 (USD Million) 73
9.5.2. Global Above 20 Liters Plastic Bucket Market Revenue, By Region, 2024 – 2032 (USD Million) 73
CHAPTER NO. 10 : PLASTIC BUCKET MARKET – BY END-USER INDUSTRY SEGMENT ANALYSIS 74
10.1. Plastic Bucket Market Overview, by End-user Industry Segment 74
10.1.1. Plastic Bucket Market Revenue Share, By End-user, 2023 & 2032 75
10.1.2. Plastic Bucket Market Attractiveness Analysis, By End-user 76
10.1.3. Incremental Revenue Growth Opportunity, by End-user, 2024 – 2032 76
10.1.4. Plastic Bucket Market Revenue, By End-user, 2018, 2023, 2027 & 2032 77
10.2. Food and Beverage 78
10.2.1. Global Food and Beverage Plastic Bucket Market Revenue, By Region, 2018 – 2023 (USD Million) 79
10.2.2. Global Food and Beverage Plastic Bucket Market Revenue, By Region, 2024 – 2032 (USD Million) 79
10.3. Chemicals and Petrochemicals 80
10.3.1. Global Chemicals and Petrochemicals Plastic Bucket Market Revenue, By Region, 2018 – 2023 (USD Million) 81
10.3.2. Global Chemicals and Petrochemicals Plastic Bucket Market Revenue, By Region, 2024 – 2032 (USD Million) 81
10.4. Pharmaceuticals 82
10.4.1. Global Pharmaceuticals Plastic Bucket Market Revenue, By Region, 2018 – 2023 (USD Million) 83
10.4.2. Global Pharmaceuticals Plastic Bucket Market Revenue, By Region, 2024 – 2032 (USD Million) 83
10.5. Agriculture 84
10.5.1. Global Agriculture Plastic Bucket Market Revenue, By Region, 2018 – 2023 (USD Million) 85
10.5.2. Global Agriculture Plastic Bucket Market Revenue, By Region, 2024 – 2032 (USD Million) 85
10.6. Others 86
10.6.1. Global Others Plastic Bucket Market Revenue, By Region, 2018 – 2023 (USD Million) 87
10.6.2. Global Others Plastic Bucket Market Revenue, By Region, 2024 – 2032 (USD Million) 87
CHAPTER NO. 11 : PLASTIC BUCKET MARKET – BY DESIGN FEATURES SEGMENT ANALYSIS 88
11.1. Plastic Bucket Market Overview, by Design Features Segment 88
11.1.1. Plastic Bucket Market Revenue Share, By Design Features, 2023 & 2032 89
11.1.2. Plastic Bucket Market Attractiveness Analysis, By Design Features 90
11.1.3. Incremental Revenue Growth Opportunity, by Design Features, 2024 – 2032 90
11.1.4. Plastic Bucket Market Revenue, By Design Features, 2018, 2023, 2027 & 2032 91
11.2. With Lid 92
11.2.1. Global With Lid Plastic Bucket Market Revenue, By Region, 2018 – 2023 (USD Million) 93
11.2.2. Global With Lid Plastic Bucket Market Revenue, By Region, 2024 – 2032 (USD Million) 93
11.3. Stackable 94
11.3.1. Global Stackable Plastic Bucket Market Revenue, By Region, 2018 – 2023 (USD Million) 95
11.3.2. Global Stackable Plastic Bucket Market Revenue, By Region, 2024 – 2032 (USD Million) 95
11.4. With Handle 96
11.4.1. Global With Handle Plastic Bucket Market Revenue, By Region, 2018 – 2023 (USD Million) 97
11.4.2. Global With Handle Plastic Bucket Market Revenue, By Region, 2024 – 2032 (USD Million) 97
11.5. Customized Designs 98
11.5.1. Global Customized Designs Plastic Bucket Market Revenue, By Region, 2018 – 2023 (USD Million) 99
11.5.2. Global Customized Designs Plastic Bucket Market Revenue, By Region, 2024 – 2032 (USD Million) 99
CHAPTER NO. 12 : PLASTIC BUCKET MARKET – BY DISTRIBUTION CHANNEL SEGMENT ANALYSIS 100
12.1. Plastic Bucket Market Overview, by Distribution Channel Segment 100
12.1.1. Plastic Bucket Market Revenue Share, By Distribution Channel, 2023 & 2032 101
12.1.2. Plastic Bucket Market Attractiveness Analysis, By Distribution Channel 102
12.1.3. Incremental Revenue Growth Opportunity, by Distribution Channel, 2024 – 2032 102
12.1.4. Plastic Bucket Market Revenue, By Distribution Channel, 2018, 2023, 2027 & 2032 103
12.2. Online Stores 104
12.2.1. Global Online Stores Plastic Bucket Market Revenue, By Region, 2018 – 2023 (USD Million) 105
12.2.2. Global Online Stores Plastic Bucket Market Revenue, By Region, 2024 – 2032 (USD Million) 105
12.3. Supermarkets/Hypermarkets 106
12.3.1. Global Supermarkets/Hypermarkets Plastic Bucket Market Revenue, By Region, 2018 – 2023 (USD Million) 107
12.3.2. Global Supermarkets/Hypermarkets Plastic Bucket Market Revenue, By Region, 2024 – 2032 (USD Million) 107
12.4. Specialty Stores 108
12.4.1. Global Specialty Stores Plastic Bucket Market Revenue, By Region, 2018 – 2023 (USD Million) 109
12.4.2. Global Specialty Stores Plastic Bucket Market Revenue, By Region, 2024 – 2032 (USD Million) 109
12.5. Others 110
12.5.1. Global Others Plastic Bucket Market Revenue, By Region, 2018 – 2023 (USD Million) 111
12.5.2. Global Others Plastic Bucket Market Revenue, By Region, 2024 – 2032 (USD Million) 111
CHAPTER NO. 13 : PLASTIC BUCKET MARKET – REGIONAL ANALYSIS 112
13.1. Plastic Bucket Market Overview, by Regional Segments 112
13.2. Region 113
13.2.1. Global Plastic Bucket Market Revenue Share, By Region, 2023 & 2032 113
13.2.2. Plastic Bucket Market Attractiveness Analysis, By Region 114
13.2.3. Incremental Revenue Growth Opportunity, by Region, 2024 – 2032 114
13.2.4. Plastic Bucket Market Revenue, By Region, 2018, 2023, 2027 & 2032 115
13.2.5. Global Plastic Bucket Market Revenue, By Region, 2018 – 2023 (USD Million) 116
13.2.6. Global Plastic Bucket Market Revenue, By Region, 2024 – 2032 (USD Million) 116
13.3. Material Type 117
13.3.1. Global Plastic Bucket Market Revenue, By Material Type, 2018 – 2023 (USD Million) 117
13.3.2. Global Plastic Bucket Market Revenue, By Material Type, 2024 – 2032 (USD Million) 117
13.4. Capacity 118
13.4.1. Global Plastic Bucket Market Revenue, By Capacity, 2018 – 2023 (USD Million) 118
13.4.2. Global Plastic Bucket Market Revenue, By Capacity, 2024 – 2032 (USD Million) 118
13.5. End-user 119
13.5.1. Global Plastic Bucket Market Revenue, By End-user, 2018 – 2023 (USD Million) 119
13.5.2. Global Plastic Bucket Market Revenue, By End-user, 2024 – 2032 (USD Million) 119
13.6. Design Features 120
13.6.1. Global Plastic Bucket Market Revenue, By Design Features, 2018 – 2023 (USD Million) 120
13.6.2. Global Plastic Bucket Market Revenue, By Design Features, 2024 – 2032 (USD Million) 120
13.7. Distribution Channel 121
13.7.1. Global Plastic Bucket Market Revenue, By Distribution Channel, 2018 – 2023 (USD Million) 121
13.7.2. Global Plastic Bucket Market Revenue, By Distribution Channel, 2024 – 2032 (USD Million) 121
CHAPTER NO. 14 : PLASTIC BUCKET MARKET – NORTH AMERICA 122
14.1. North America 122
14.1.1. Key Highlights 122
14.1.2. North America Plastic Bucket Market Revenue, By Country, 2018 – 2023 (USD Million) 123
14.1.3. North America Plastic Bucket Market Revenue, By Material Type, 2018 – 2023 (USD Million) 124
14.1.4. North America Plastic Bucket Market Revenue, By Capacity, 2018 – 2023 (USD Million) 125
14.1.5. North America Plastic Bucket Market Revenue, By End-user, 2018 – 2023 (USD Million) 126
14.1.6. North America Plastic Bucket Market Revenue, By Design Features, 2018 – 2023 (USD Million) 127
14.1.7. North America Plastic Bucket Market Revenue, By Distribution Channel, 2018 – 2023 (USD Million) 128
14.2. U.S. 129
14.3. Canada 129
14.4. Mexico 129
CHAPTER NO. 15 : PLASTIC BUCKET MARKET – EUROPE 130
15.1. Europe 130
15.1.1. Key Highlights 130
15.1.2. Europe Plastic Bucket Market Revenue, By Country, 2018 – 2023 (USD Million) 131
15.1.3. Europe Plastic Bucket Market Revenue, By Material Type, 2018 – 2023 (USD Million) 132
15.1.4. Europe Plastic Bucket Market Revenue, By Capacity, 2018 – 2023 (USD Million) 133
15.1.5. Europe Plastic Bucket Market Revenue, By End-user, 2018 – 2023 (USD Million) 134
15.1.6. Europe Plastic Bucket Market Revenue, By Design Features, 2018 – 2023 (USD Million) 135
15.1.7. Europe Plastic Bucket Market Revenue, By Distribution Channel, 2018 – 2023 (USD Million) 136
15.2. UK 137
15.3. France 137
15.4. Germany 137
15.5. Italy 137
15.6. Spain 137
15.7. Russia 137
15.8. Belgium 137
15.9. Netherland 137
15.10. Austria 137
15.11. Sweden 137
15.12. Poland 137
15.13. Denmark 137
15.14. Switzerland 137
15.15. Rest of Europe 137
CHAPTER NO. 16 : PLASTIC BUCKET MARKET – ASIA PACIFIC 138
16.1. Asia Pacific 138
16.1.1. Key Highlights 138
16.1.2. Asia Pacific Plastic Bucket Market Revenue, By Country, 2018 – 2023 (USD Million) 139
16.1.3. Asia Pacific Plastic Bucket Market Revenue, By Material Type, 2018 – 2023 (USD Million) 140
16.1.4. Asia Pacific Plastic Bucket Market Revenue, By Capacity, 2018 – 2023 (USD Million) 141
16.1.5. Asia Pacific Plastic Bucket Market Revenue, By End-user, 2018 – 2023 (USD Million) 142
16.1.6. Asia Pacific Plastic Bucket Market Revenue, By Design Features, 2018 – 2023 (USD Million) 143
16.1.7. Asia Pacific Plastic Bucket Market Revenue, By Distribution Channel, 2018 – 2023 (USD Million) 144
16.2. China 145
16.3. Japan 145
16.4. South Korea 145
16.5. India 145
16.6. Australia 145
16.7. Thailand 145
16.8. Indonesia 145
16.9. Vietnam 145
16.10. Malaysia 145
16.11. Philippines 145
16.12. Taiwan 145
16.13. Rest of Asia Pacific 145
CHAPTER NO. 17 : PLASTIC BUCKET MARKET – LATIN AMERICA 146
17.1. Latin America 146
17.1.1. Key Highlights 146
17.1.2. Latin America Plastic Bucket Market Revenue, By Country, 2018 – 2023 (USD Million) 147
17.1.3. Latin America Plastic Bucket Market Revenue, By Material Type, 2018 – 2023 (USD Million) 148
17.1.4. Latin America Plastic Bucket Market Revenue, By Capacity, 2018 – 2023 (USD Million) 149
17.1.5. Latin America Plastic Bucket Market Revenue, By End-user, 2018 – 2023 (USD Million) 150
17.1.6. Latin America Plastic Bucket Market Revenue, By Design Features, 2018 – 2023 (USD Million) 151
17.1.7. Latin America Plastic Bucket Market Revenue, By Distribution Channel, 2018 – 2023 (USD Million) 152
17.2. Brazil 153
17.3. Argentina 153
17.4. Peru 153
17.5. Chile 153
17.6. Colombia 153
17.7. Rest of Latin America 153
CHAPTER NO. 18 : PLASTIC BUCKET MARKET – MIDDLE EAST 154
18.1. Middle East 154
18.1.1. Key Highlights 154
18.1.2. Middle East Plastic Bucket Market Revenue, By Country, 2018 – 2023 (USD Million) 155
18.1.3. Middle East Plastic Bucket Market Revenue, By Material Type, 2018 – 2023 (USD Million) 156
18.1.4. Middle East Plastic Bucket Market Revenue, By Capacity, 2018 – 2023 (USD Million) 157
18.1.5. Middle East Plastic Bucket Market Revenue, By End-user, 2018 – 2023 (USD Million) 158
18.1.6. Middle East Plastic Bucket Market Revenue, By Design Features, 2018 – 2023 (USD Million) 159
18.1.7. Middle East Plastic Bucket Market Revenue, By Distribution Channel, 2018 – 2023 (USD Million) 160
18.2. UAE 161
18.3. KSA 161
18.4. Israel 161
18.5. Turkey 161
18.6. Iran 161
18.7. Rest of Middle East 161
CHAPTER NO. 19 : PLASTIC BUCKET MARKET – AFRICA 162
19.1. Africa 162
19.1.1. Key Highlights 162
19.1.2. Africa Plastic Bucket Market Revenue, By Country, 2018 – 2023 (USD Million) 163
19.1.3. Africa Plastic Bucket Market Revenue, By Material Type, 2018 – 2023 (USD Million) 164
19.1.4. Africa Plastic Bucket Market Revenue, By Capacity, 2018 – 2023 (USD Million) 165
19.1.5. Africa Plastic Bucket Market Revenue, By End-user, 2018 – 2023 (USD Million) 166
19.1.6. Africa Plastic Bucket Market Revenue, By Design Features, 2018 – 2023 (USD Million) 167
19.1.7. Africa Plastic Bucket Market Revenue, By Distribution Channel, 2018 – 2023 (USD Million) 168
19.2. Egypt 169
19.3. Nigeria 169
19.4. Algeria 169
19.5. Morocco 169
19.6. Rest of Africa 169
CHAPTER NO. 20 : COMPANY PROFILES 170
20.1. Greif Inc. 170
20.1.1. Company Overview 170
20.1.2. Product Portfolio 170
20.1.3. Swot Analysis 170
20.1.4. Business Strategy 171
20.1.5. Financial Overview 171
20.2. Mauser Packaging Solutions 172
20.3. Berry Global Inc. 172
20.4. RPC Group Plc 172
20.5. BWAY Corporation 172
20.6. M&M Industries Inc. 172
20.7. Encore Plastics Corporation 172
20.8. Letica Corporation 172
20.9. Plastipak Holdings Inc. 172
20.10. Ropak Packaging 172
20.11. NCI Packaging 172
20.12. Pro-Western Plastics Ltd. 172
20.13. IPL Plastics Inc. 172
20.14. Involvement Packaging Ltd. 172
20.15. Viscount Plastics Pty Ltd. 172
20.16. Industrial Container Services 172
20.17. Paragon Manufacturing Inc. 172
20.18. Affordable Plastics LLC 172
20.19. Allied Plastics Co. Inc. 172
List of Figures
FIG NO. 1. Global Plastic Bucket Market Revenue, 2018 – 2032 (USD Million) 32
FIG NO. 2. Porter’s Five Forces Analysis for Global Plastic Bucket Market 39
FIG NO. 3. Global Plastic Bucket Market Import Volume/Revenue, By Region, 2018 – 2023 40
FIG NO. 4. Global Plastic Bucket Market Export Volume/Revenue, By Region, 2018 – 2023 41
FIG NO. 5. Company Share Analysis, 2024 42
FIG NO. 6. Company Share Analysis, 2024 43
FIG NO. 7. Company Share Analysis, 2024 43
FIG NO. 8. Company Share Analysis, 2024 44
FIG NO. 9. Plastic Bucket Market – Company Revenue Market Share, 2024 45
FIG NO. 10. Plastic Bucket Market Revenue Share, By Material Type, 2023 & 2032 51
FIG NO. 11. Market Attractiveness Analysis, By Material Type 52
FIG NO. 12. Incremental Revenue Growth Opportunity by Material Type, 2024 – 2032 52
FIG NO. 13. Plastic Bucket Market Revenue, By Material Type, 2018, 2023, 2027 & 2032 53
FIG NO. 14. Global Plastic Bucket Market for HDPE, Revenue (USD Million) 2018 – 2032 54
FIG NO. 15. Global Plastic Bucket Market for PP, Revenue (USD Million) 2018 – 2032 56
FIG NO. 16. Global Plastic Bucket Market for LDPE, Revenue (USD Million) 2018 – 2032 58
FIG NO. 17. Global Plastic Bucket Market for Others, Revenue (USD Million) 2018 – 2032 60
FIG NO. 18. Plastic Bucket Market Revenue Share, By Capacity, 2023 & 2032 63
FIG NO. 19. Market Attractiveness Analysis, By Capacity 64
FIG NO. 20. Incremental Revenue Growth Opportunity by Capacity, 2024 – 2032 64
FIG NO. 21. Plastic Bucket Market Revenue, By Capacity, 2018, 2023, 2027 & 2032 65
FIG NO. 22. Global Plastic Bucket Market for Up to 3 Liters, Revenue (USD Million) 2018 – 2032 66
FIG NO. 23. Global Plastic Bucket Market for 3-10 Liters, Revenue (USD Million) 2018 – 2032 68
FIG NO. 24. Global Plastic Bucket Market for 10-20 Liters, Revenue (USD Million) 2018 – 2032 70
FIG NO. 25. Global Plastic Bucket Market for Above 20 Liters, Revenue (USD Million) 2018 – 2032 72
FIG NO. 26. Plastic Bucket Market Revenue Share, By End-user, 2023 & 2032 75
FIG NO. 27. Market Attractiveness Analysis, By End-user 76
FIG NO. 28. Incremental Revenue Growth Opportunity by End-user, 2024 – 2032 76
FIG NO. 29. Plastic Bucket Market Revenue, By End-user, 2018, 2023, 2027 & 2032 77
FIG NO. 30. Global Plastic Bucket Market for Food and Beverage, Revenue (USD Million) 2018 – 2032 78
FIG NO. 31. Global Plastic Bucket Market for Chemicals and Petrochemicals, Revenue (USD Million) 2018 – 2032 80
FIG NO. 32. Global Plastic Bucket Market for Pharmaceuticals, Revenue (USD Million) 2018 – 2032 82
FIG NO. 33. Global Plastic Bucket Market for Agriculture, Revenue (USD Million) 2018 – 2032 84
FIG NO. 34. Global Plastic Bucket Market for Others, Revenue (USD Million) 2018 – 2032 86
FIG NO. 35. Plastic Bucket Market Revenue Share, By Design Features, 2023 & 2032 89
FIG NO. 36. Market Attractiveness Analysis, By Design Features 90
FIG NO. 37. Incremental Revenue Growth Opportunity by Design Features, 2024 – 2032 90
FIG NO. 38. Plastic Bucket Market Revenue, By Design Features, 2018, 2023, 2027 & 2032 91
FIG NO. 39. Global Plastic Bucket Market for With Lid, Revenue (USD Million) 2018 – 2032 92
FIG NO. 40. Global Plastic Bucket Market for Stackable, Revenue (USD Million) 2018 – 2032 94
FIG NO. 41. Global Plastic Bucket Market for With Handle, Revenue (USD Million) 2018 – 2032 96
FIG NO. 42. Global Plastic Bucket Market for Customized Designs, Revenue (USD Million) 2018 – 2032 98
FIG NO. 43. Plastic Bucket Market Revenue Share, By Distribution Channel, 2023 & 2032 101
FIG NO. 44. Market Attractiveness Analysis, By Distribution Channel 102
FIG NO. 45. Incremental Revenue Growth Opportunity by Distribution Channel, 2024 – 2032 102
FIG NO. 46. Plastic Bucket Market Revenue, By Distribution Channel, 2018, 2023, 2027 & 2032 103
FIG NO. 47. Global Plastic Bucket Market for Online Stores, Revenue (USD Million) 2018 – 2032 104
FIG NO. 48. Global Plastic Bucket Market for Supermarkets/Hypermarkets, Revenue (USD Million) 2018 – 2032 106
FIG NO. 49. Global Plastic Bucket Market for Specialty Stores, Revenue (USD Million) 2018 – 2032 108
FIG NO. 50. Global Plastic Bucket Market for Others, Revenue (USD Million) 2018 – 2032 110
FIG NO. 51. Global Plastic Bucket Market Revenue Share, By Region, 2023 & 2032 113
FIG NO. 52. Market Attractiveness Analysis, By Region 114
FIG NO. 53. Incremental Revenue Growth Opportunity by Region, 2024 – 2032 114
FIG NO. 54. Plastic Bucket Market Revenue, By Region, 2018, 2023, 2027 & 2032 115
FIG NO. 55. North America Plastic Bucket Market Revenue, 2018 – 2032 (USD Million) 122
FIG NO. 56. Europe Plastic Bucket Market Revenue, 2018 – 2032 (USD Million) 130
FIG NO. 57. Asia Pacific Plastic Bucket Market Revenue, 2018 – 2032 (USD Million) 138
FIG NO. 58. Latin America Plastic Bucket Market Revenue, 2018 – 2032 (USD Million) 146
FIG NO. 59. Middle East Plastic Bucket Market Revenue, 2018 – 2032 (USD Million) 154
FIG NO. 60. Africa Plastic Bucket Market Revenue, 2018 – 2032 (USD Million) 162
List of Tables
TABLE NO. 1. : Global Plastic Bucket Market: Snapshot 30
TABLE NO. 2. : Drivers for the Plastic Bucket Market: Impact Analysis 35
TABLE NO. 3. : Restraints for the Plastic Bucket Market: Impact Analysis 37
TABLE NO. 4. : Global HDPE Plastic Bucket Market Revenue, By Region, 2018 – 2023 (USD Million) 55
TABLE NO. 5. : Global HDPE Plastic Bucket Market Revenue, By Region, 2024 – 2032 (USD Million) 55
TABLE NO. 6. : Global PP Plastic Bucket Market Revenue, By Region, 2018 – 2023 (USD Million) 57
TABLE NO. 7. : Global PP Plastic Bucket Market Revenue, By Region, 2024 – 2032 (USD Million) 57
TABLE NO. 8. : Global LDPE Plastic Bucket Market Revenue, By Region, 2018 – 2023 (USD Million) 59
TABLE NO. 9. : Global LDPE Plastic Bucket Market Revenue, By Region, 2024 – 2032 (USD Million) 59
TABLE NO. 10. : Global Others Plastic Bucket Market Revenue, By Region, 2018 – 2023 (USD Million) 61
TABLE NO. 11. : Global Others Plastic Bucket Market Revenue, By Region, 2024 – 2032 (USD Million) 61
TABLE NO. 12. : Global Up to 3 Liters Plastic Bucket Market Revenue, By Region, 2018 – 2023 (USD Million) 67
TABLE NO. 13. : Global Up to 3 Liters Plastic Bucket Market Revenue, By Region, 2024 – 2032 (USD Million) 67
TABLE NO. 14. : Global 3-10 Liters Plastic Bucket Market Revenue, By Region, 2018 – 2023 (USD Million) 69
TABLE NO. 15. : Global 3-10 Liters Plastic Bucket Market Revenue, By Region, 2024 – 2032 (USD Million) 69
TABLE NO. 16. : Global 10-20 Liters Plastic Bucket Market Revenue, By Region, 2018 – 2023 (USD Million) 71
TABLE NO. 17. : Global 10-20 Liters Plastic Bucket Market Revenue, By Region, 2024 – 2032 (USD Million) 71
TABLE NO. 18. : Global Above 20 Liters Plastic Bucket Market Revenue, By Region, 2018 – 2023 (USD Million) 73
TABLE NO. 19. : Global Above 20 Liters Plastic Bucket Market Revenue, By Region, 2024 – 2032 (USD Million) 73
TABLE NO. 20. : Global Food and Beverage Plastic Bucket Market Revenue, By Region, 2018 – 2023 (USD Million) 79
TABLE NO. 21. : Global Food and Beverage Plastic Bucket Market Revenue, By Region, 2024 – 2032 (USD Million) 79
TABLE NO. 22. : Global Chemicals and Petrochemicals Plastic Bucket Market Revenue, By Region, 2018 – 2023 (USD Million) 81
TABLE NO. 23. : Global Chemicals and Petrochemicals Plastic Bucket Market Revenue, By Region, 2024 – 2032 (USD Million) 81
TABLE NO. 24. : Global Pharmaceuticals Plastic Bucket Market Revenue, By Region, 2018 – 2023 (USD Million) 83
TABLE NO. 25. : Global Pharmaceuticals Plastic Bucket Market Revenue, By Region, 2024 – 2032 (USD Million) 83
TABLE NO. 26. : Global Agriculture Plastic Bucket Market Revenue, By Region, 2018 – 2023 (USD Million) 85
TABLE NO. 27. : Global Agriculture Plastic Bucket Market Revenue, By Region, 2024 – 2032 (USD Million) 85
TABLE NO. 28. : Global Others Plastic Bucket Market Revenue, By Region, 2018 – 2023 (USD Million) 87
TABLE NO. 29. : Global Others Plastic Bucket Market Revenue, By Region, 2024 – 2032 (USD Million) 87
TABLE NO. 30. : Global With Lid Plastic Bucket Market Revenue, By Region, 2018 – 2023 (USD Million) 93
TABLE NO. 31. : Global With Lid Plastic Bucket Market Revenue, By Region, 2024 – 2032 (USD Million) 93
TABLE NO. 32. : Global Stackable Plastic Bucket Market Revenue, By Region, 2018 – 2023 (USD Million) 95
TABLE NO. 33. : Global Stackable Plastic Bucket Market Revenue, By Region, 2024 – 2032 (USD Million) 95
TABLE NO. 34. : Global With Handle Plastic Bucket Market Revenue, By Region, 2018 – 2023 (USD Million) 97
TABLE NO. 35. : Global With Handle Plastic Bucket Market Revenue, By Region, 2024 – 2032 (USD Million) 97
TABLE NO. 36. : Global Customized Designs Plastic Bucket Market Revenue, By Region, 2018 – 2023 (USD Million) 99
TABLE NO. 37. : Global Customized Designs Plastic Bucket Market Revenue, By Region, 2024 – 2032 (USD Million) 99
TABLE NO. 38. : Global Online Stores Plastic Bucket Market Revenue, By Region, 2018 – 2023 (USD Million) 105
TABLE NO. 39. : Global Online Stores Plastic Bucket Market Revenue, By Region, 2024 – 2032 (USD Million) 105
TABLE NO. 40. : Global Supermarkets/Hypermarkets Plastic Bucket Market Revenue, By Region, 2018 – 2023 (USD Million) 107
TABLE NO. 41. : Global Supermarkets/Hypermarkets Plastic Bucket Market Revenue, By Region, 2024 – 2032 (USD Million) 107
TABLE NO. 42. : Global Specialty Stores Plastic Bucket Market Revenue, By Region, 2018 – 2023 (USD Million) 109
TABLE NO. 43. : Global Specialty Stores Plastic Bucket Market Revenue, By Region, 2024 – 2032 (USD Million) 109
TABLE NO. 44. : Global Others Plastic Bucket Market Revenue, By Region, 2018 – 2023 (USD Million) 111
TABLE NO. 45. : Global Others Plastic Bucket Market Revenue, By Region, 2024 – 2032 (USD Million) 111
TABLE NO. 46. : Global Plastic Bucket Market Revenue, By Region, 2018 – 2023 (USD Million) 116
TABLE NO. 47. : Global Plastic Bucket Market Revenue, By Region, 2024 – 2032 (USD Million) 116
TABLE NO. 48. : Global Plastic Bucket Market Revenue, By Material Type, 2018 – 2023 (USD Million) 117
TABLE NO. 49. : Global Plastic Bucket Market Revenue, By Material Type, 2024 – 2032 (USD Million) 117
TABLE NO. 50. : Global Plastic Bucket Market Revenue, By Capacity, 2018 – 2023 (USD Million) 118
TABLE NO. 51. : Global Plastic Bucket Market Revenue, By Capacity, 2024 – 2032 (USD Million) 118
TABLE NO. 52. : Global Plastic Bucket Market Revenue, By End-user, 2018 – 2023 (USD Million) 119
TABLE NO. 53. : Global Plastic Bucket Market Revenue, By End-user, 2024 – 2032 (USD Million) 119
TABLE NO. 54. : Global Plastic Bucket Market Revenue, By Design Features, 2018 – 2023 (USD Million) 120
TABLE NO. 55. : Global Plastic Bucket Market Revenue, By Design Features, 2024 – 2032 (USD Million) 120
TABLE NO. 56. : Global Plastic Bucket Market Revenue, By Distribution Channel, 2018 – 2023 (USD Million) 121
TABLE NO. 57. : Global Plastic Bucket Market Revenue, By Distribution Channel, 2024 – 2032 (USD Million) 121
TABLE NO. 58. : North America Plastic Bucket Market Revenue, By Country, 2018 – 2023 (USD Million) 123
TABLE NO. 59. : North America Plastic Bucket Market Revenue, By Country, 2024 – 2032 (USD Million) 123
TABLE NO. 60. : North America Plastic Bucket Market Revenue, By Material Type, 2018 – 2023 (USD Million) 124
TABLE NO. 61. : North America Plastic Bucket Market Revenue, By Material Type, 2024 – 2032 (USD Million) 124
TABLE NO. 62. : North America Plastic Bucket Market Revenue, By Capacity, 2018 – 2023 (USD Million) 125
TABLE NO. 63. : North America Plastic Bucket Market Revenue, By Capacity, 2024 – 2032 (USD Million) 125
TABLE NO. 64. : North America Plastic Bucket Market Revenue, By End-user, 2018 – 2023 (USD Million) 126
TABLE NO. 65. : North America Plastic Bucket Market Revenue, By End-user, 2024 – 2032 (USD Million) 126
TABLE NO. 66. : North America Plastic Bucket Market Revenue, By Design Features, 2018 – 2023 (USD Million) 127
TABLE NO. 67. : North America Plastic Bucket Market Revenue, By Design Features, 2024 – 2032 (USD Million) 127
TABLE NO. 68. : North America Plastic Bucket Market Revenue, By Distribution Channel, 2018 – 2023 (USD Million) 128
TABLE NO. 69. : North America Plastic Bucket Market Revenue, By Distribution Channel, 2024 – 2032 (USD Million) 128
TABLE NO. 70. : Europe Plastic Bucket Market Revenue, By Country, 2018 – 2023 (USD Million) 131
TABLE NO. 71. : Europe Plastic Bucket Market Revenue, By Country, 2024 – 2032 (USD Million) 131
TABLE NO. 72. : Europe Plastic Bucket Market Revenue, By Material Type, 2018 – 2023 (USD Million) 132
TABLE NO. 73. : Europe Plastic Bucket Market Revenue, By Material Type, 2024 – 2032 (USD Million) 132
TABLE NO. 74. : Europe Plastic Bucket Market Revenue, By Capacity, 2018 – 2023 (USD Million) 133
TABLE NO. 75. : Europe Plastic Bucket Market Revenue, By Capacity, 2024 – 2032 (USD Million) 133
TABLE NO. 76. : Europe Plastic Bucket Market Revenue, By End-user, 2018 – 2023 (USD Million) 134
TABLE NO. 77. : Europe Plastic Bucket Market Revenue, By End-user, 2024 – 2032 (USD Million) 134
TABLE NO. 78. : Europe Plastic Bucket Market Revenue, By Design Features, 2018 – 2023 (USD Million) 135
TABLE NO. 79. : Europe Plastic Bucket Market Revenue, By Design Features, 2024 – 2032 (USD Million) 135
TABLE NO. 80. : Europe Plastic Bucket Market Revenue, By Distribution Channel, 2018 – 2023 (USD Million) 136
TABLE NO. 81. : Europe Plastic Bucket Market Revenue, By Distribution Channel, 2024 – 2032 (USD Million) 136
TABLE NO. 82. : Asia Pacific Plastic Bucket Market Revenue, By Country, 2018 – 2023 (USD Million) 139
TABLE NO. 83. : Asia Pacific Plastic Bucket Market Revenue, By Country, 2024 – 2032 (USD Million) 139
TABLE NO. 84. : Asia Pacific Plastic Bucket Market Revenue, By Material Type, 2018 – 2023 (USD Million) 140
TABLE NO. 85. : Asia Pacific Plastic Bucket Market Revenue, By Material Type, 2024 – 2032 (USD Million) 140
TABLE NO. 86. : Asia Pacific Plastic Bucket Market Revenue, By Capacity, 2018 – 2023 (USD Million) 141
TABLE NO. 87. : Asia Pacific Plastic Bucket Market Revenue, By Capacity, 2024 – 2032 (USD Million) 141
TABLE NO. 88. : Asia Pacific Plastic Bucket Market Revenue, By End-user, 2018 – 2023 (USD Million) 142
TABLE NO. 89. : Asia Pacific Plastic Bucket Market Revenue, By End-user, 2024 – 2032 (USD Million) 142
TABLE NO. 90. : Asia Pacific Plastic Bucket Market Revenue, By Design Features, 2018 – 2023 (USD Million) 143
TABLE NO. 91. : Asia Pacific Plastic Bucket Market Revenue, By Design Features, 2024 – 2032 (USD Million) 143
TABLE NO. 92. : Asia Pacific Plastic Bucket Market Revenue, By Distribution Channel, 2018 – 2023 (USD Million) 144
TABLE NO. 93. : Asia Pacific Plastic Bucket Market Revenue, By Distribution Channel, 2024 – 2032 (USD Million) 144
TABLE NO. 94. : Latin America Plastic Bucket Market Revenue, By Country, 2018 – 2023 (USD Million) 147
TABLE NO. 95. : Latin America Plastic Bucket Market Revenue, By Country, 2024 – 2032 (USD Million) 147
TABLE NO. 96. : Latin America Plastic Bucket Market Revenue, By Material Type, 2018 – 2023 (USD Million) 148
TABLE NO. 97. : Latin America Plastic Bucket Market Revenue, By Material Type, 2024 – 2032 (USD Million) 148
TABLE NO. 98. : Latin America Plastic Bucket Market Revenue, By Capacity, 2018 – 2023 (USD Million) 149
TABLE NO. 99. : Latin America Plastic Bucket Market Revenue, By Capacity, 2024 – 2032 (USD Million) 149
TABLE NO. 100. : Latin America Plastic Bucket Market Revenue, By End-user, 2018 – 2023 (USD Million) 150
TABLE NO. 101. : Latin America Plastic Bucket Market Revenue, By End-user, 2024 – 2032 (USD Million) 150
TABLE NO. 102. : Latin America Plastic Bucket Market Revenue, By Design Features, 2018 – 2023 (USD Million) 151
TABLE NO. 103. : Latin America Plastic Bucket Market Revenue, By Design Features, 2024 – 2032 (USD Million) 151
TABLE NO. 104. : Latin America Plastic Bucket Market Revenue, By Distribution Channel, 2018 – 2023 (USD Million) 152
TABLE NO. 105. : Latin America Plastic Bucket Market Revenue, By Distribution Channel, 2024 – 2032 (USD Million) 152
TABLE NO. 106. : Middle East Plastic Bucket Market Revenue, By Country, 2018 – 2023 (USD Million) 155
TABLE NO. 107. : Middle East Plastic Bucket Market Revenue, By Country, 2024 – 2032 (USD Million) 155
TABLE NO. 108. : Middle East Plastic Bucket Market Revenue, By Material Type, 2018 – 2023 (USD Million) 156
TABLE NO. 109. : Middle East Plastic Bucket Market Revenue, By Material Type, 2024 – 2032 (USD Million) 156
TABLE NO. 110. : Middle East Plastic Bucket Market Revenue, By Capacity, 2018 – 2023 (USD Million) 157
TABLE NO. 111. : Middle East Plastic Bucket Market Revenue, By Capacity, 2024 – 2032 (USD Million) 157
TABLE NO. 112. : Middle East Plastic Bucket Market Revenue, By End-user, 2018 – 2023 (USD Million) 158
TABLE NO. 113. : Middle East Plastic Bucket Market Revenue, By End-user, 2024 – 2032 (USD Million) 158
TABLE NO. 114. : Middle East Plastic Bucket Market Revenue, By Design Features, 2018 – 2023 (USD Million) 159
TABLE NO. 115. : Middle East Plastic Bucket Market Revenue, By Design Features, 2024 – 2032 (USD Million) 159
TABLE NO. 116. : Middle East Plastic Bucket Market Revenue, By Distribution Channel, 2018 – 2023 (USD Million) 160
TABLE NO. 117. : Middle East Plastic Bucket Market Revenue, By Distribution Channel, 2024 – 2032 (USD Million) 160
TABLE NO. 118. : Africa Plastic Bucket Market Revenue, By Country, 2018 – 2023 (USD Million) 163
TABLE NO. 119. : Africa Plastic Bucket Market Revenue, By Country, 2024 – 2032 (USD Million) 163
TABLE NO. 120. : Africa Plastic Bucket Market Revenue, By Material Type, 2018 – 2023 (USD Million) 164
TABLE NO. 121. : Africa Plastic Bucket Market Revenue, By Material Type, 2024 – 2032 (USD Million) 164
TABLE NO. 122. : Africa Plastic Bucket Market Revenue, By Capacity, 2018 – 2023 (USD Million) 165
TABLE NO. 123. : Africa Plastic Bucket Market Revenue, By Capacity, 2024 – 2032 (USD Million) 165
TABLE NO. 124. : Africa Plastic Bucket Market Revenue, By End-user, 2018 – 2023 (USD Million) 166
TABLE NO. 125. : Africa Plastic Bucket Market Revenue, By End-user, 2024 – 2032 (USD Million) 166
TABLE NO. 126. : Africa Plastic Bucket Market Revenue, By Design Features, 2018 – 2023 (USD Million) 167
TABLE NO. 127. : Africa Plastic Bucket Market Revenue, By Design Features, 2024 – 2032 (USD Million) 167
TABLE NO. 128. : Africa Plastic Bucket Market Revenue, By Distribution Channel, 2018 – 2023 (USD Million) 168
TABLE NO. 129. : Africa Plastic Bucket Market Revenue, By Distribution Channel, 2024 – 2032 (USD Million) 168