Table of Content
1.1.1. Report Description 43
Purpose of the Report 43
USP & Key Offerings 43
1.1.2. Key Benefits for Stakeholders 43
1.1.3. Target Audience 44
1.1.4. Report Scope 44
2.1. Latin America Managed Services Market Snapshot 45
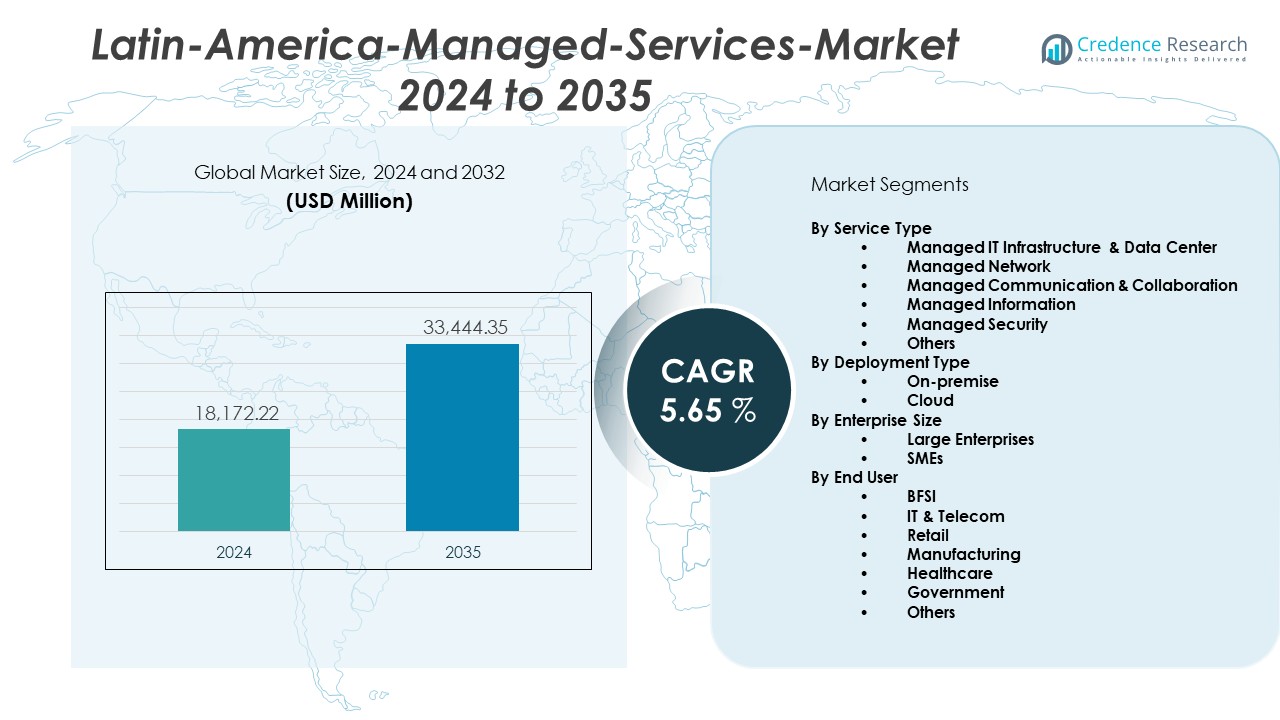
2.1.1. Latin America Managed Services Market, 2018 – 2035 (USD Million) 46
3.1. Introduction 47
3.2. Market Drivers 49
3.2.1. Accelerated Digital Transformation & Cloud Migration 49
3.2.2. Increasing Complexity of IT Environments & Rising Cybersecurity Demands 50
3.2.3. Increasing Complexity of IT Environments & Rising Cybersecurity Demands 51
3.3. Market Restraints 52
3.3.1. Data Privacy and Regulatory Compliance Challenges 52
3.3.1. Limited IT Infrastructure and Connectivity in Certain Regions 53
3.3.1. High Dependency on Skilled IT Talent and Talent Shortage 54
3.4. Market Opportunities 56
3.4.1. Rising Adoption of Hybrid and Multi-Cloud Environments 56
3.4.1. Expansion of Managed Security and Compliance Services 57
3.5. Porter’s Five Forces Analysis 58
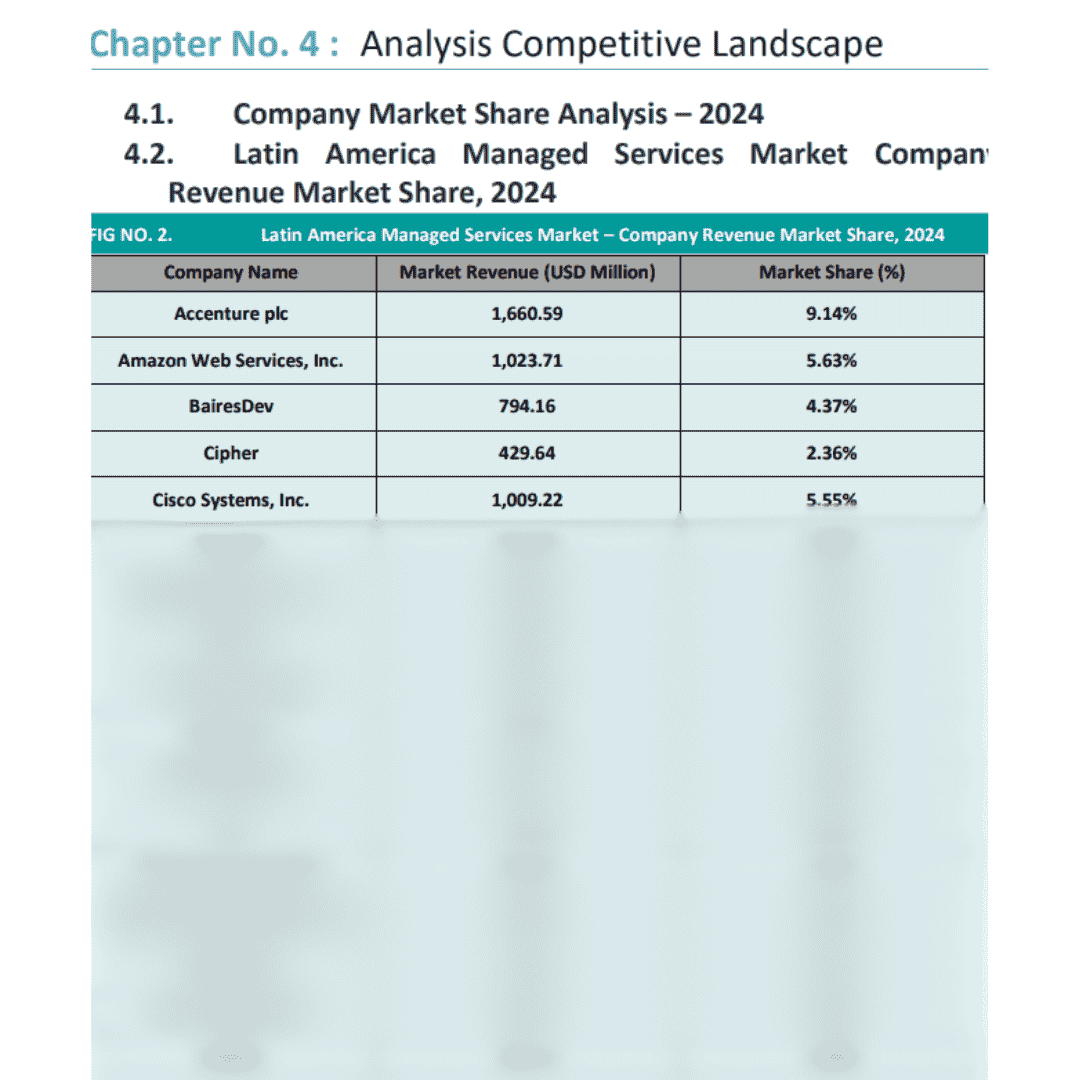
4.1. Company Market Share Analysis – 2024 60
4.2. Latin America Managed Services Market Company Revenue Market Share, 2024 60
4.3. Brazil Managed Services Market Company Revenue Market Share, 2024 63
4.4. Mexico Managed Services Market Company Revenue Market Share, 2024 64
4.5. Argentina Managed Services Market Company Revenue Market Share, 2024 65
4.6. Peru Managed Services Market Company Revenue Market Share, 2024 66
4.7. Chile Managed Services Market Company Revenue Market Share, 2024 67
4.8. Colombia Managed Services Market Company Revenue Market Share, 2024 68
4.9. Bolivia Managed Services Market Company Revenue Market Share, 2024 69
4.10. Costa Rica Managed Services Market Company Revenue Market Share, 2024 70
4.11. Dominican Republic Managed Services Market Company Revenue Market Share, 202471
4.12. Ecuador Managed Services Market Company Revenue Market Share, 2024 72
4.13. Honduras Managed Services Market Company Revenue Market Share, 2024 73
4.14. Panama Managed Services Market Company Revenue Market Share, 2024 74
4.15. Uruguay Managed Services Market Company Revenue Market Share, 2024 75
4.16. Puerto Rico Managed Services Market Company Revenue Market Share, 2024 76
4.17. Strategic Developments 77
5.1. PESTEL 79
5.1.1. Political Factors 79
5.1.2. Economic Factors 79
5.1.3. Social Factors 79
5.1.4. Technological Factors 80
5.1.5. Environmental Factors 80
5.1.6. Legal Factors 80
6.1. Latin America Managed Services Market Overview, by Service Type Segment 82
6.1.1. Latin America Managed Services Market Revenue Share, By Service Type, 2024 & 203583
6.1.2. Latin America Managed Services Market Attractiveness Analysis, By Service Type 84
6.1.3. Incremental Revenue Growth Opportunity, by Service Type, 2025 – 2035 85
6.1.4. Latin America Managed Services Market Revenue, By Service Type, 2018, 2023, 2027 & 2032 86
6.2. Managed IT Infrastructure & Data Center 87
6.3. Managed Network 88
6.4. Managed Communication & Collaboration 89
6.5. Managed Information 90
6.6. Managed Security 91
6.7. Others 92
7.1. Latin America Managed Services Market Overview, by Deployment Type Segment 93
7.1.1. Latin America Managed Services Market Revenue Share, By Deployment Type, 2024 & 2035 94
7.1.2. Latin America Managed Services Market Attractiveness Analysis, By Deployment Type95
7.1.3. Incremental Revenue Growth Opportunity, by Deployment Type, 2025 – 2035 96
7.1.4. Latin America Managed Services Market Revenue, By Deployment Type, 2018, 2023, 2027 & 2032 97
7.2. On-premise 98
7.3. Cloud 99
8.1. Latin America Managed Services Market Overview, by Enterprise Size Segment 100
8.1.1. Latin America Managed Services Market Revenue Share, By End-user, 2024 & 2035 101
8.1.2. Latin America Managed Services Market Attractiveness Analysis, By End-user 102
8.1.3. Incremental Revenue Growth Opportunity, by End-user, 2025 – 2035 103
8.1.4. Latin America Managed Services Market Revenue, By End-user, 2018, 2023, 2027 & 2032
104
8.2. Large Enterprises 105
8.3. SME’s 106
9.1. Latin America Managed Services Market Overview, by End User Segment 107
9.1.1. Latin America Managed Services Market Revenue Share, By End User, 2024 & 2035 . 108
9.1.2. Latin America Managed Services Market Attractiveness Analysis, By End User 109
9.1.3. Incremental Revenue Growth Opportunity, by End User, 2025 – 2035 110
9.1.4. Latin America Managed Services Market Revenue, By End User, 2018, 2023, 2027 & 2032
111
9.2. BFSI 112
9.3. IT & Telecom 113
9.4. Retail 114
9.5. Manufacturing 115
9.6. Healthcare 116
9.7. Government 117
9.8. Others 118
10.1. Latin America 119
10.1.1. Key Highlights 119
10.1.2. Latin America Managed Services Market Revenue, By Country, 2018 – 2023 (USD Million) 120
10.2. Service Type 122
10.2.1. Latin America Managed Services Market Revenue, By Service Type, 2018 – 2025 (USD Million) 122
10.2.2. Latin America Managed Services Market Revenue, By Service Type, 2026 – 2035 (USD Million) 123
10.3. Deployment Type 124
10.3 1.Latin America Managed Services Market Revenue, By Deployment Type, 2018 – 2025
(USD Million) 124
10.3 2.Latin America Managed Services Market Revenue, By Deployment Type, 2026 – 2035
(USD Million) 124
10.4. Enterprise Size125
10.4.1. Latin America Managed Services Market Revenue, By Enterprise Size, 2018 – 2025 (USD Million) 125
10.4.2. Latin America Managed Services Market Revenue, By Enterprise Size, 2026 – 2035 (USD Million) 125
10.5. End User 126
10.5.1. Latin America Managed Services Market Revenue, By End User, 2018 – 2025 (USD Million) 126
10.5.2. Latin America Managed Services Market Revenue, By End User, 2026 – 2035 (USD Million) 126
11.1. Brazil 127
11.1.1. Brazil Managed Services Market Revenue, By Service Type, 2018 – 2025 (USD Million)127 11.1.2.Brazil Managed Services Market Revenue, By Service Type, 2026 – 2035 (USD Million)128 11.1.3.Brazil Managed Services Market Revenue, By Deployment Type, 2018 – 2025 (USD
Million) 129
11.1.4. Brazil Managed Services Market Revenue, By Deployment Type, 2026 – 2035 (USD Million) 129
11.1.5. Brazil Managed Services Market Revenue, By Enterprise Size, 2018 – 2025 (USD Million) 130
11.1.6. Brazil Managed Services Market Revenue, By Enterprise Size, 2026 – 2035 (USD Million) 130
11.1.7. Brazil Managed Services Market Revenue, By End User, 2018 – 2025 (USD Million) … 131 11.1.8.Brazil Managed Services Market Revenue, By End User, 2026 – 2035 (USD Million) 131
11.2. Mexico 132
11.2.1. Mexico Managed Services Market Revenue, By Service Type, 2018 – 2025 (USD Million) 132
11.2.2. Mexico Managed Services Market Revenue, By Service Type, 2026 – 2035 (USD Million) 133
11.2.3. Mexico Managed Services Market Revenue, By Deployment Type, 2018 – 2025 (USD Million) 134
11.2.4. Mexico Managed Services Market Revenue, By Deployment Type, 2026 – 2035 (USD Million) 134
11.2.5. Mexico Managed Services Market Revenue, By Enterprise Size, 2018 – 2025 (USD Million) 135
11.2.6. Mexico Managed Services Market Revenue, By Enterprise Size, 2026 – 2035 (USD Million) 135
11.2.7. Mexico Managed Services Market Revenue, By End User, 2018 – 2025 (USD Million) 136 11.2.8.Mexico Managed Services Market Revenue, By End User, 2026 – 2035 (USD Million) . 136
11.3. Argentina 137
11.3.1. Argentina Managed Services Market Revenue, By Service Type, 2018 – 2025 (USD Million) 137
11.3.2. Argentina Managed Services Market Revenue, By Service Type, 2026 – 2035 (USD Million) 138
11.3.3. Argentina Managed Services Market Revenue, By Deployment Type, 2018 – 2025 (USD Million) 139
11.3.4. Argentina Managed Services Market Revenue, By Deployment Type, 2026 – 2035 (USD Million) 139
11.3.5. Argentina Managed Services Market Revenue, By Enterprise Size, 2018 – 2025 (USD Million) 140
11.3.6. Argentina Managed Services Market Revenue, By Enterprise Size, 2026 – 2035 (USD Million) 140
11.3.7. Argentina Managed Services Market Revenue, By End User, 2018 – 2025 (USD Million) 141
11.3.8. Argentina Managed Services Market Revenue, By End User, 2026 – 2035 (USD Million) 141
11.4. Peru 142
11.4.1. Peru Managed Services Market Revenue, By Service Type, 2018 – 2025 (USD Million) 142 11.4.2.Peru Managed Services Market Revenue, By Service Type, 2026 – 2035 (USD Million) 143
11.4.3. Peru Managed Services Market Revenue, By Deployment Type, 2018 – 2025 (USD Million) 144
11.4.4. Peru Managed Services Market Revenue, By Deployment Type, 2026 – 2035 (USD Million) 144
11.4.5. Peru Managed Services Market Revenue, By Enterprise Size, 2018 – 2025 (USD Million) 145
11.4.6. Peru Managed Services Market Revenue, By Enterprise Size, 2026 – 2035 (USD Million) 145
11.4.7. Peru Managed Services Market Revenue, By End User, 2018 – 2025 (USD Million) 146
11.4.8. Peru Managed Services Market Revenue, By End User, 2026 – 2035 (USD Million) 146
11.5. Chile 147
11.5.1. Chile Managed Services Market Revenue, By Service Type, 2018 – 2025 (USD Million)147
11.5.2. Chile Managed Services Market Revenue, By Service Type, 2026 – 2035 (USD Million)148 11.5.3.Chile Managed Services Market Revenue, By Deployment Type, 2018 – 2025 (USD
Million) 149
11.5.4. Chile Managed Services Market Revenue, By Deployment Type, 2026 – 2035 (USD Million) 149
11.5.5. Chile Managed Services Market Revenue, By Enterprise Size, 2018 – 2025 (USD Million) 150
11.5.6. Chile Managed Services Market Revenue, By Enterprise Size, 2026 – 2035 (USD Million) 150
11.5.7. Chile Managed Services Market Revenue, By End User, 2018 – 2025 (USD Million) 151
11.5.8. Chile Managed Services Market Revenue, By End User, 2026 – 2035 (USD Million) 151
11.6. Colombia 152
11.6.1. Colombia Managed Services Market Revenue, By Service Type, 2018 – 2025 (USD Million) 152
11.6.2. Colombia Managed Services Market Revenue, By Service Type, 2026 – 2035 (USD Million) 153
11.6.3. Colombia Managed Services Market Revenue, By Deployment Type, 2018 – 2025 (USD Million) 154
11.6.4. Colombia Managed Services Market Revenue, By Deployment Type, 2026 – 2035 (USD Million) 154
11.6.5. Colombia Managed Services Market Revenue, By Enterprise Size, 2018 – 2025 (USD Million) 155
11.6.6. Colombia Managed Services Market Revenue, By Enterprise Size, 2026 – 2035 (USD Million) 155
11.6.7. Colombia Managed Services Market Revenue, By End User, 2018 – 2025 (USD Million) 156
11.6.8. Colombia Managed Services Market Revenue, By End User, 2026 – 2035 (USD Million) 156
11.7. Bolivia 157
11.7.1. Bolivia Managed Services Market Revenue, By Service Type, 2018 – 2025 (USD Million) 157
11.7.2. Bolivia Managed Services Market Revenue, By Service Type, 2026 – 2035 (USD Million) 158
11.7.3. Bolivia Managed Services Market Revenue, By Deployment Type, 2018 – 2025 (USD Million) 159
11.7.4. Bolivia Managed Services Market Revenue, By Deployment Type, 2026 – 2035 (USD Million) 159
11.7.5. Bolivia Managed Services Market Revenue, By Enterprise Size, 2018 – 2025 (USD Million) 160
11.7.6. Bolivia Managed Services Market Revenue, By Enterprise Size, 2026 – 2035 (USD Million) 160
11.7.7. Bolivia Managed Services Market Revenue, By End User, 2018 – 2025 (USD Million) . 161 11.7.8.Bolivia Managed Services Market Revenue, By End User, 2026 – 2035 (USD Million) 161
11.8. Costa Rica 162
11.8.1. Costa Rica Managed Services Market Revenue, By Service Type, 2018 – 2025 (USD Million) 162
11.8.2. Costa Rica Managed Services Market Revenue, By Service Type, 2026 – 2035 (USD Million) 163
11.8.3. Costa Rica Managed Services Market Revenue, By Deployment Type, 2018 – 2025 (USD Million) 164
11.8.4. Costa Rica Managed Services Market Revenue, By Deployment Type, 2026 – 2035 (USD Million) 164
11.8.5. Costa Rica Managed Services Market Revenue, By Enterprise Size, 2018 – 2025 (USD Million) 165
11.8.6. Costa Rica Managed Services Market Revenue, By Enterprise Size, 2026 – 2035 (USD Million) 165
11.8.7. Costa Rica Managed Services Market Revenue, By End User, 2018 – 2025 (USD Million) 166
11.8.8. Costa Rica Managed Services Market Revenue, By End User, 2026 – 2035 (USD Million) 166
11.9. Dominican Republic 167
11.9 1.Dominican Republic Managed Services Market Revenue, By Service Type, 2018 – 2025
(USD Million) 167
11.9 2.Dominican Republic Managed Services Market Revenue, By Service Type, 2026 – 2035
(USD Million) 168
11.9 3.Dominican Republic Managed Services Market Revenue, By Deployment Type, 2018 –
2025 (USD Million) 169
11.9 4.Dominican Republic Managed Services Market Revenue, By Deployment Type, 2026 –
2035 (USD Million) 169
11.9 5.Dominican Republic Managed Services Market Revenue, By Enterprise Size, 2018 – 2025
(USD Million) 170
11.9 6.Dominican Republic Managed Services Market Revenue, By Enterprise Size, 2026 – 2035
(USD Million) 170
11.9.7. Dominican Republic Managed Services Market Revenue, By End User, 2018 – 2025 (USD Million) 171
11.9.8. Dominican Republic Managed Services Market Revenue, By End User, 2026 – 2035 (USD Million) 171
11.10. Ecuador 172
11.10.1. Ecuador Managed Services Market Revenue, By Service Type, 2018 – 2025 (USD Million) 172
11.10.2. Ecuador Managed Services Market Revenue, By Service Type, 2026 – 2035 (USD Million) 173
11.10.3. Ecuador Managed Services Market Revenue, By Deployment Type, 2018 –
2025 (USD Million) 174
11.10.4. Ecuador Managed Services Market Revenue, By Deployment Type, 2026 – 2035 (USD Million) 174
11.10.5. Ecuador Managed Services Market Revenue, By Enterprise Size, 2018 –
2025 (USD Million) 175
11.10.6. Ecuador Managed Services Market Revenue, By Enterprise Size, 2026 – 2035 (USD Million) 175
11.10.7. Ecuador Managed Services Market Revenue, By End User, 2018 – 2025 (USD Million) 176
11.10.8. Ecuador Managed Services Market Revenue, By End User, 2026 – 2035 (USD Million) 176
11.11. Honduras 177
11.11.1. Honduras Managed Services Market Revenue, By Service Type, 2018 – 2025 (USD Million) 177
11.11.2. Honduras Managed Services Market Revenue, By Service Type, 2026 – 2035 (USD Million) 178
11.11.3. Honduras Managed Services Market Revenue, By Deployment Type, 2018
– 2025 (USD Million) 179
11.11.4. Honduras Managed Services Market Revenue, By Deployment Type, 2026
– 2035 (USD Million) 179
11.11.5. Honduras Managed Services Market Revenue, By Enterprise Size, 2018 –
2025 (USD Million) 180
11.11.6. Honduras Managed Services Market Revenue, By Enterprise Size, 2026 – 2035 (USD Million) 180
11.11.7. Honduras Managed Services Market Revenue, By End User, 2018 – 2025 (USD Million) 181
11.11.8. Honduras Managed Services Market Revenue, By End User, 2026 – 2035 (USD Million) 181
11.12. Panama 182
11.12.1. Panama Managed Services Market Revenue, By Service Type, 2018 – 2025 (USD Million) 182
11.12.2. Panama Managed Services Market Revenue, By Service Type, 2026 – 2035 (USD Million) 183
11.12.3. Panama Managed Services Market Revenue, By Deployment Type, 2018 –
2025 (USD Million) 184
11.12.4. Panama Managed Services Market Revenue, By Deployment Type, 2026 – 2035 (USD Million) 184
11.12.5. Panama Managed Services Market Revenue, By Enterprise Size, 2018 –
2025 (USD Million) 185
11.12.6. Panama Managed Services Market Revenue, By Enterprise Size, 2026 – 2035 (USD Million) 185
11.12.7. Panama Managed Services Market Revenue, By End User, 2018 – 2025 (USD Million) 186
11.12.8. Panama Managed Services Market Revenue, By End User, 2026 – 2035 (USD Million) 186
11.13. Uruguay 187
11.13.1. Uruguay Managed Services Market Revenue, By Service Type, 2018 – 2025 (USD Million) 187
11.13.2. Uruguay Managed Services Market Revenue, By Service Type, 2026 – 2035 (USD Million) 188
11.13.3. Uruguay Managed Services Market Revenue, By Deployment Type, 2018
– 2025 (USD Million) 189
11.13.4. Uruguay Managed Services Market Revenue, By Deployment Type, 2026 – 2035 (USD Million) 189
11.13.5. Uruguay Managed Services Market Revenue, By Enterprise Size, 2018 –
2025 (USD Million) 190
11.13.6. Uruguay Managed Services Market Revenue, By Enterprise Size, 2026 – 2035 (USD Million) 190
11.13.7. Uruguay Managed Services Market Revenue, By End User, 2018 – 2025 (USD Million) 191
11.13.8. Uruguay Managed Services Market Revenue, By End User, 2026 – 2035 (USD Million) 191
11.14. Puerto Rico 192
11.14.1. Puerto Rico Managed Services Market Revenue, By Service Type, 2018 – 2025 (USD Million) 192
11.14.2. Puerto Rico Managed Services Market Revenue, By Service Type, 2026 – 2035 (USD Million) 193
11.14.3. Puerto Rico Managed Services Market Revenue, By Deployment Type, 2018 – 2025 (USD Million) 194
11.14.4. Puerto Rico Managed Services Market Revenue, By Deployment Type, 2026 – 2035 (USD Million) 194
11.14.5. Puerto Rico Managed Services Market Revenue, By Enterprise Size, 2018
– 2025 (USD Million) 195
11.14.6. Puerto Rico Managed Services Market Revenue, By Enterprise Size, 2026 – 2035 (USD Million) 195
11.14.7. Puerto Rico Managed Services Market Revenue, By End User, 2018 – 2025 (USD Million) 196
11.14.8. Puerto Rico Managed Services Market Revenue, By End User, 2026 – 2035 (USD Million) 196
11.15. Rest of Latin America 197
11.15.1. Rest of Latin America Managed Services Market Revenue, By Service Type, 2018 – 2025 (USD Million) 197
11.15.2. Rest of Latin America Managed Services Market Revenue, By Service Type, 2026 – 2035 (USD Million) 198
11.15.3. Rest of Latin America Managed Services Market Revenue, By Deployment Type, 2018 – 2025 (USD Million) 199
11.15.4. Rest of Latin America Managed Services Market Revenue, By Deployment Type, 2026 – 2035 (USD Million) 199
11.15.5. Rest of Latin America Managed Services Market Revenue, By Enterprise Size, 2018 – 2025 (USD Million) 200
11.15.6. Rest of Latin America Managed Services Market Revenue, By Enterprise Size, 2026 – 2035 (USD Million) 200
11.15.7. Rest of Latin America Managed Services Market Revenue, By End User, 2018 – 2025 (USD Million) 201
11.15.8. Rest of Latin America Managed Services Market Revenue, By End User, 2026 – 2035 (USD Million) 201
12.1. Accenture PLC 202
12.1.1. Company Overview 202
12.1.2. Service Portfolio 203
12.1.3. Business Strategy 203
12.1.4. Financial Overview 204
12.2. Microsoft Corporation 205
12.2.1. Company Overview 205
12.2.2. Service Portfolio 206
12.2.3. Business Strategy 206
12.2.4. Financial Overview 207
12.3. IBM Corporation 208
12.3.1. Company Overview 208
12.3.2. Service Portfolio 209
12.3.3. Business Strategy 209
12.3.4. Financial Overview 210
12.4. Cisco Systems, Inc 211
12.4.1. Company Overview 211
12.4.2. Service Portfolio 212
12.4.3. Business Strategy 212
12.4.4. Financial Overview 213
12.5. Google LLC 214
12.5.1. Company Overview 214
12.5.2. Service Portfolio 215
12.5.3. Business Strategy 215
12.5.4. Financial Overview 215
12.6. Amazon Web Services, Inc 216
12.6.1. Company Overview 216
12.6.2. Service Portfolio 217
12.6.3. Business Strategy 217
12.6.4. Financial Overview 217
12.7. Oracle Corporation 218
12.7.1. Company Overview 218
12.7.2. Service Portfolio 219
12.7.3. Business Strategy 219
12.7.4. Financial Overview 219
12.8. Deloitte 220
12.8.1. Company Overview 220
12.8.2. Service Portfolio 221
12.8.3. Business Strategy 221
12.8.4. Financial Overview 221
12.9. BairesDev 222
12.9.1. Company Overview 222
12.9.2. Service Portfolio 223
12.9.3. Business Strategy 223
12.9.4. Financial Overview 223
12.10. EY (Ernst & Young) 224
12.10.1. Company Overview 224
12.10.2. Service Portfolio 225
12.10.3. Business Strategy 225
12.10.4. Financial Overview 225
12.11. NetSecurity 226
12.11.1. Company Overview 226
12.11.2. Service Portfolio 226
12.11.3. Business Strategy 227
12.11.4. Financial Overview 227
12.12. Cipher 228
12.12.1. Company Overview 228
12.12.2. Service Portfolio 228
12.12.3. Business Strategy 229
12.12.4. Financial Overview 229
12.13. Tempest Computer Services SA 230
12.13.1. Company Overview 230
12.13.2. Service Portfolio 231
12.13.3. Business Strategy 231
12.13.4. Financial Overview 231
12.14. Módulo Security Solutions S.A. 232
12.14.1. Company Overview 232
12.14.2. Service Portfolio 233
12.14.3. Business Strategy 233
12.14.4. Financial Overview 233
12.15. Digital Realty Trust, Inc 234
12.15.1. Company Overview 234
12.15.2. Service Portfolio 235
12.15.3. Business Strategy 235
12.15.4. Financial Overview 235
12.16. Summit 236
12.16.1. Company Overview 236
12.16.2. Service Portfolio 237
12.16.3. Business Strategy 237
12.16.4. Financial Overview 237
12.17. EVEO SA 238
12.17.1. Company Overview 238
12.17.2. Service Portfolio 239
12.17.3. Business Strategy 239
12.17.4. Financial Overview 239
12.18. Softtek 240
12.18.1. Company Overview 240
12.18.2. Service Portfolio 240
12.18.3. Business Strategy 241
12.18.4. Financial Overview 241
12.19. KIO (Maxihost) 242
12.19.1. Company Overview 242
12.19.2. Service Portfolio 242
12.19.3. Business Strategy 243
12.19.4. Financial Overview 243
13.1. Cisco Systems, Inc 244
13.1.1. Company Overview 244
13.1.2. Service Portfolio 245
13.1.3. Business Strategy 245
13.1.4. Financial Overview 246
13.2. IBM Corporation 247
13.2.1. Company Overview 247
13.2.2. Service Portfolio 248
13.2.3. Business Strategy 248
13.2.4. Financial Overview 248
13.3. Google LLC 249
13.3.1. Company Overview 249
13.3.2. Service Portfolio 250
13.3.3. Business Strategy 250
13.3.4. Financial Overview 250
13.4. OpenService 251
13.4.1. Company Overview 251
13.4.2. Service Portfolio 251
13.4.3. Business Strategy 252
13.4.4. Financial Overview 252
13.5. Softtek 253
13.5.1. Company Overview 253
13.5.2. Service Portfolio 253
13.5.3. Business Strategy 254
13.5.4. Financial Overview 254
13.6. KIO 255
13.6.1. Company Overview 255
13.6.2. Service Portfolio 255
13.6.3. Business Strategy 256
13.6.4. Financial Overview 256
13.7. Alestra 257
13.7.1. Company Overview 257
13.7.2. Service Portfolio 257
13.7.3. Business Strategy 258
13.7.4. Financial Overview 258
13.8. Tiba IT Services 259
13.8.1. Company Overview 259
13.8.2. Service Portfolio 259
13.8.3. Business Strategy 260
13.8.4. Financial Overview 260
13.9. Business Support Services (BSS) 261
13.9.1. Company Overview 261
13.9.2. Service Portfolio 261
13.9.3. Business Strategy 262
13.9.4. Financial Overview 262
13.10. iCorps 263
13.10.1. Company Overview 263
13.10.2. Service Portfolio 263
13.10.3. Business Strategy 264
13.10.4. Financial Overview 264
13.11. Espacios de Mexico 265
13.11.1. Company Overview 265
13.11.2. Service Portfolio 265
13.11.3. Business Strategy 266
13.11.4. Financial Overview 266
13.12. Grupo SICTEL 267
13.12.1. Company Overview 267
13.12.2. Service Portfolio 267
13.12.3. Business Strategy 268
13.12.4. Financial Overview 268
13.13. Accenture PLC 269
13.13.1. Company Overview 269
13.13.2. Service Portfolio 270
13.13.3. Business Strategy 270
13.13.4. Financial Overview 271
13.14. Microsoft Corporation 272
13.14.1. Company Overview 272
13.14.2. Service Portfolio 273
13.14.3. Business Strategy 273
13.14.4. Financial Overview 274
13.15. Oracle Corporation 275
13.15.1. Company Overview 275
13.15.2. Service Portfolio 276
13.15.3. Business Strategy 276
13.15.4. Financial Overview 276
13.16. Amazon Web Services, Inc 277
13.16.1. Company Overview 277
13.16.2. Service Portfolio 278
13.16.3. Business Strategy 278
13.16.4. Financial Overview 278
13.17. EY (Ernst & Young) 279
13.17.1. Company Overview 279
13.17.2. Service Portfolio 280
13.17.3. Business Strategy 280
13.17.4. Financial Overview 280
13.18. BairesDev 281
13.18.1. Company Overview 281
13.18.2. Service Portfolio 282
13.18.3. Business Strategy 282
13.18.4. Financial Overview 282
13.19. Deloitte 283
13.19.1. Company Overview 283
13.19.2. Service Portfolio 284
13.19.3. Business Strategy 284
13.19.4. Financial Overview 284
4.1. Huenei IT Services 285
14.1.1. Company Overview 285
14.1.2. Service Portfolio 285
14.1.3. Business Strategy 286
14.1.4. Financial Overview 286
14.2. Globant 287
14.2.1. Company Overview 287
14.2.2. Service Portfolio 288
14.2.3. Business Strategy 288
14.2.4. Financial Overview 288
14.3. Baufest 289
14.3.1. Company Overview 289
14.3.2. Service Portfolio 290
14.3.3. Business Strategy 290
14.3.4. Financial Overview 290
14.4. Accenture PLC 291
14.4.1. Company Overview 291
14.4.2. Service Portfolio 292
14.4.3. Business Strategy 292
14.4.4. Financial Overview 293
14.5. Microsoft Corporation 294
14.5.1. Company Overview 294
14.5.2. Service Portfolio 295
14.5.3. Business Strategy 295
14.5.4. Financial Overview 296
14.6. Cisco Systems, Inc 297
14.6.1. Company Overview 297
14.6.2. Service Portfolio 298
14.6.3. Business Strategy 298
14.6.4. Financial Overview 298
14.7. Google LLC 299
14.7.1. Company Overview 299
14.7.2. Service Portfolio 300
14.7.3. Business Strategy 300
14.7.4. Financial Overview 300
15.1. Baufest 301
15.1.1. Company Overview 301
15.1.2. Service Portfolio 302
15.1.3. Business Strategy 302
15.1.4. Financial Overview 302
15.2. Softtek 303
15.2.1. Company Overview 303
15.2.2. Service Portfolio 303
15.2.3. Business Strategy 304
15.2.4. Financial Overview 304
15.3. 10Pearls 305
15.3.1. Company Overview 305
15.3.2. Service Portfolio 305
15.3.3. Business Strategy 306
15.3.4. Financial Overview 306
15.4. Business IT (Group Business) 307
15.4.1. Company Overview 307
15.4.2. Service Portfolio 307
15.4.3. Business Strategy 308
15.4.4. Financial Overview 308
15.5. DIMA 309
15.5.1. Company Overview 309
15.5.2. Service Portfolio 310
15.5.3. Business Strategy 310
15.5.4. Financial Overview 310
15.6. Cisco Systems, Inc 311
15.6.1. Company Overview 311
15.6.2. Service Portfolio 312
15.6.3. Business Strategy 312
15.6.4. Financial Overview 312
16.1. Palo Alto Networks 313
16.1.1. Company Overview 313
16.1.2. Service Portfolio 314
16.1.3. Business Strategy 314
16.1.4. Financial Overview 314
16.2. Thoughtworks, Inc 315
16.2.1. Company Overview 315
16.2.2. Service Portfolio 316
16.2.3. Business Strategy 316
16.2.4. Financial Overview 316
16.3. Andes Digital 317
16.3.1. Company Overview 317
16.3.2. Service Portfolio 318
16.3.3. Business Strategy 318
16.3.4. Financial Overview 318
16.4. Oracle Corporation 319
16.4.1. Company Overview 319
16.4.2. Service Portfolio 320
16.4.3. Business Strategy 320
16.4.4. Financial Overview 320
16.5. Amazon Web Services, Inc 321
16.5.1. Company Overview 321
16.5.2. Service Portfolio 322
16.5.3. Business Strategy 322
16.5.4. Financial Overview 322
16.6. EY (Ernst & Young) 323
16.6.1. Company Overview 323
16.6.2. Service Portfolio 324
16.6.3. Business Strategy 324
16.6.4. Financial Overview 324
16.7. IBM Corporation 325
16.7.1. Company Overview 325
16.7.2. Service Portfolio 326
16.7.3. Business Strategy 326
16.7.4. Financial Overview 327
17.1. EPAM Systems, Inc 328
17.1.1. Company Overview 328
17.1.2. Service Portfolio 329
17.1.3. Business Strategy 329
17.1.4. Financial Overview 329
17.2. sa.global 330
17.2.1. Company Overview 330
17.2.2. Service Portfolio 331
17.2.3. Business Strategy 331
17.2.4. Financial Overview 331
17.3. Ceragon 332
17.3.1. Company Overview 332
17.3.2. Service Portfolio 333
17.3.3. Business Strategy 333
17.3.4. Financial Overview 333
17.4. Accenture PLC 334
17.4.1. Company Overview 334
17.4.2. Service Portfolio 335
17.4.3. Business Strategy 335
17.4.4. Financial Overview 336
17.5. EY (Ernst & Young) 337
17.5.1. Company Overview 337
17.5.2. Service Portfolio 338
17.5.3. Business Strategy 338
17.5.4. Financial Overview 338
18.1. Digital Innovations 339
18.1.1. Company Overview 339
18.1.2. Service Portfolio 340
18.1.3. Business Strategy 340
18.1.4. Financial Overview 340
18.2. Microsoft Corporation 341
18.2.1. Company Overview 341
18.2.2. Service Portfolio 342
18.2.3. Business Strategy 342
18.2.4. Financial Overview 343
18.3. EY (Ernst & Young) 344
18.3.1. Company Overview 344
18.3.2. Service Portfolio 345
18.3.3. Business Strategy 345
18.3.4. Financial Overview 345
18.4. Deloitte 346
18.4.1. Company Overview 346
18.4.2. Service Portfolio 347
18.4.3. Business Strategy 347
18.4.4. Financial Overview 347
19.1. Oxford Computer Group 348
19.1.1. Company Overview 348
19.1.2. Service Portfolio 349
19.1.3. Business Strategy 349
19.1.4. Financial Overview 349
19.2. Navégalo, S.A. 350
19.2.1. Company Overview 350
19.2.2. Service Portfolio 351
19.2.3. Business Strategy 351
19.2.4. Financial Overview 351
19.3. CRG SOLUTIONS 352
19.3.1. Company Overview 352
19.3.2. Service Portfolio 353
19.3.3. Business Strategy 353
19.3.4. Financial Overview 353
19.4. Astrix Inc. Costa Rica 354
19.4.1. Company Overview 354
19.4.2. Service Portfolio 355
19.4.3. Business Strategy 355
19.4.4. Financial Overview 355
19.5. Novacomp 356
19.5.1. Company Overview 356
19.5.2. Service Portfolio 357
19.5.3. Business Strategy 357
19.5.4. Financial Overview 357
19.6. Impulsa IT Solutions 358
19.6.1. Company Overview 358
19.6.2. Service Portfolio 359
19.6.3. Business Strategy 359
19.6.4. Financial Overview 359
19.7. IBM Corporation 360
19.7.1. Company Overview 360
19.7.2. Service Portfolio 361
19.7.3. Business Strategy 361
19.7.4. Financial Overview 362
20.1. Cisco Systems, Inc 363
20.1.1. Company Overview 363
20.1.2. Service Portfolio 364
20.1.3. Business Strategy 364
20.1.4. Financial Overview 364
20.2. IBM Corporation 365
20.2.1. Company Overview 365
20.2.2. Service Portfolio 366
20.2.3. Business Strategy 366
20.2.4. Financial Overview 366
20.3. Bluebox Solutions 367
20.3.1. Company Overview 367
20.3.2. Service Portfolio 367
20.3.3. Business Strategy 368
20.3.4. Financial Overview 368
20.4. Corporacion Solve 369
20.4.1. Company Overview 369
20.4.2. Service Portfolio 369
20.4.3. Business Strategy 370
20.4.4. Financial Overview 370
20.5. Digital Business Group 371
20.5.1. Company Overview 371
20.5.2. Service Portfolio 371
20.5.3. Business Strategy 372
20.5.4. Financial Overview 372
21.1. EdgeUno 373
21.1.1. Company Overview 373
21.1.2. Service Portfolio 373
21.1.3. Business Strategy 374
21.1.4. Financial Overview 374
21.2. IBM Corporation 375
21.2.1. Company Overview 375
21.2.2. Service Portfolio 376
21.2.3. Business Strategy 376
21.2.4. Financial Overview 376
21.3. SYNERGY Ecuador 377
21.3.1. Company Overview 377
21.3.2. Service Portfolio 377
21.3.3. Business Strategy 378
21.3.4. Financial Overview 378
21.4. Comware SA 379
21.4.1. Company Overview 379
21.4.2. Service Portfolio 379
21.4.3. Business Strategy 380
21.4.4. Financial Overview 380
21.5. SERTECHMA 381
21.5.1. Company Overview 381
21.5.2. Service Portfolio 381
21.5.3. Business Strategy 382
21.5.4. Financial Overview 382
21.6. Akros 383
21.6.1. Company Overview 383
21.6.2. Service Portfolio 383
21.6.3. Business Strategy 384
21.6.4. Financial Overview 384
22.1. Novacomp 385
22.1.1. Company Overview 385
22.1.2. Service Portfolio 386
22.1.3. Business Strategy 386
22.1.4. Financial Overview 386
22.2. Deloitte Honduras 387
22.2.1. Company Overview 387
22.2.2. Service Portfolio 388
22.2.3. Business Strategy 388
22.2.4. Financial Overview 388
22.3. Microsoft Corporation 389
22.3.1. Company Overview 389
22.3.2. Service Portfolio 389
22.3.3. Business Strategy 390
22.3.4. Financial Overview 390
22.4. IBM Corporation (GBM de Honduras S.A) 391
22.4.1. Company Overview 391
22.4.2. Service Portfolio 392
22.4.3. Business Strategy 392
22.4.4. Financial Overview 393
22.5. Oracle Corporation 394
22.5.1. Company Overview 394
22.5.2. Service Portfolio 395
22.5.3. Business Strategy 395
22.5.4. Financial Overview 395
23.1. Bicorp Group 396
23.1.1. Company Overview 396
23.1.2. Service Portfolio 396
23.1.3. Business Strategy 397
23.1.4. Financial Overview 397
23.2. IT Advisors 398
23.2.1. Company Overview 398
23.2.2. Service Portfolio 398
23.2.3. Business Strategy 399
23.2.4. Financial Overview 399
23.3. Netsos 400
23.3.1. Company Overview 400
23.3.2. Service Portfolio 400
23.3.3. Business Strategy 400
23.3.4. Financial Overview 401
23.4. IBM (GBM de Panama S.A.) 402
23.4.1. Company Overview 402
23.4.2. Service Portfolio 403
23.4.3. Business Strategy 403
23.4.4. Financial Overview 403
23.5. Deloitte Panama 404
23.5.1. Company Overview 404
23.5.2. Service Portfolio 405
23.5.3. Business Strategy 405
23.5.4. Financial Overview 405
24.1. Endava 406
24.1.1. Company Overview 406
24.1.2. Service Portfolio 407
24.1.3. Business Strategy 407
24.1.4. Financial Overview 407
24.2. Globant 408
24.2.1. Company Overview 408
24.2.2. Service Portfolio 409
24.2.3. Business Strategy 409
24.2.4. Financial Overview 409
24.3. Microsoft Corporation 410
24.3.1. Company Overview 410
24.3.2. Service Portfolio 411
24.3.3. Business Strategy 411
24.3.4. Financial Overview 412
24.4. IBM Corporation 413
24.4.1. Company Overview 413
24.4.2. Service Portfolio 414
24.4.3. Business Strategy 414
24.4.4. Financial Overview 415
24.5. Cisco Systems, Inc 416
24.5.1. Company Overview 416
24.5.2. Service Portfolio 417
24.5.3. Business Strategy 417
24.5.4. Financial Overview 417
25.1. BetterWorld Technology 418
25.1.1. Company Overview 418
25.1.2. Service Portfolio 418
25.1.3. Business Strategy 419
25.1.4. Financial Overview 419
25.2. IT Resources Innovation (IRI) 420
25.2.1. Company Overview 420
25.2.2. Service Portfolio 420
25.2.3. Business Strategy 421
25.2.4. Financial Overview 421
25.3. Manage IT LLC 422
25.3.1. Company Overview 422
25.3.2. Service Portfolio 422
25.3.3. Business Strategy 423
25.3.4. Financial Overview 423
25.4. ONUVO 424
25.4.1. Company Overview 424
25.4.2. Service Portfolio 424
25.4.3. Business Strategy 425
25.4.4. Financial Overview 425
25.5. Informasi 426
25.5.1. Company Overview 426
25.5.2. Service Portfolio 427
25.5.3. Business Strategy 427
25.5.4. Financial Overview 427
25.6. Cisco Systems, Inc 428
25.6.1. Company Overview 428
25.6.2. Service Portfolio 429
25.6.3. Business Strategy 429
25.6.4. Financial Overview 429
List of Figures
FIG NO. 1. Latin America Managed Services Market Revenue, 2018 – 2035 (USD Million) 46
FIG NO. 2. Latin America Managed Services Market – Company Revenue Market Share, 2024 60
FIG NO. 3. Brazil Managed Services Market – Company Revenue Market Share, 2024 63
FIG NO. 4. Mexico Managed Services Market – Company Revenue Market Share, 2024 64
FIG NO. 5. Argentina Managed Services Market – Company Revenue Market Share, 2024 65
FIG NO. 6. Peru Managed Services Market – Company Revenue Market Share, 2024 66
FIG NO. 7. Chile Managed Services Market – Company Revenue Market Share, 2024 67
FIG NO. 8. Colombia Managed Services Market – Company Revenue Market Share, 2024 68
FIG NO. 9. Bolivia Managed Services Market – Company Revenue Market Share, 2024 69
FIG NO. 10. Costa Rica Managed Services Market – Company Revenue Market Share, 2024 70
FIG NO. 11. Dominican Republic Managed Services Market – Company Revenue Market Share, 2024 71
FIG NO. 12. Ecuador Managed Services Market – Company Revenue Market Share, 2024 72
FIG NO. 13. Honduras Managed Services Market – Company Revenue Market Share, 2024 73
FIG NO. 14. Panama Managed Services Market – Company Revenue Market Share, 2024 74
FIG NO. 15. Uruguay Managed Services Market – Company Revenue Market Share, 2024 75
FIG NO. 16. Puerto Rico Managed Services Market – Company Revenue Market Share, 2024 76
FIG NO. 17. Latin America Managed Services Market Revenue Share, By Service Type, 2024 & 2035 83
FIG NO. 18. Market Attractiveness Analysis, By Service Type 84
FIG NO. 19. Incremental Revenue Growth Opportunity by Service Type, 2025 – 2035 85
FIG NO. 20. Latin America Managed Services Market Revenue, By Service Type, 2018, 2023, 2027 &
2032 86
FIG NO. 21. Latin America Managed Services Market for Managed IT Infrastructure & Data Center, Revenue (USD Million) 2018 – 2035 87
FIG NO. 22. Latin America Managed Services Market for Managed Network, Revenue (USD Million)
2018 – 2035 88
FIG NO. 23. Latin America Managed Services Market for Managed Communication & Collaboration, Revenue (USD Million) 2018 – 2035 89
FIG NO. 24. Latin America Managed Services Market for Managed Information, Revenue (USD
Million) 2018 – 2035 90
FIG NO. 25. Latin America Managed Services Market for Managed Security, Revenue (USD Million)
2018 – 2035 91
FIG NO. 26. Latin America Managed Services Market for Others, Revenue (USD Million) 2018 – 2035 92
FIG NO. 27. Latin America Managed Services Market Revenue Share, By Deployment Type, 2024 &
2035 94
FIG NO. 28. Market Attractiveness Analysis, By Deployment Type 95
FIG NO. 29. Incremental Revenue Growth Opportunity by Deployment Type, 2025 – 2035 96
FIG NO. 30. Latin America Managed Services Market Revenue, By Deployment Type, 2018, 2023,
2027 & 2032 97
FIG NO. 31. Latin America Managed Services Market for On-premise, Revenue (USD Million) 2018 –
2035 98
FIG NO. 32. Latin America Managed Services Market for Cloud, Revenue (USD Million) 2018 – 2035 99
FIG NO. 33. Latin America Managed Services Market Revenue Share, By End-user, 2024 & 2035 101
FIG NO. 34. Market Attractiveness Analysis, By End-user 102
FIG NO. 35. Incremental Revenue Growth Opportunity by End-user, 2025 – 2035 103
FIG NO. 36. Latin America Managed Services Market Revenue, By End-user, 2018, 2023, 2027 & 2032 104 FIG NO. 37. Latin America Managed Services Market for Large Enterprises, Revenue (USD Million)
2018 – 2035 105
FIG NO. 38. Latin America Managed Services Market for SME’s, Revenue (USD Million) 2018 – 2035 106
FIG NO. 39. Latin America Managed Services Market Revenue Share, By End User, 2024 & 2035 108
FIG NO. 40. Market Attractiveness Analysis, By End User 109
FIG NO. 41. Incremental Revenue Growth Opportunity by End User, 2025 – 2035 110
FIG NO. 42. Latin America Managed Services Market Revenue, By End User, 2018, 2023, 2027 & 2032 111 FIG NO. 43. Latin America Managed Services Market for BFSI, Revenue (USD Million) 2018 – 2035 112
FIG NO. 44. Latin America Managed Services Market for IT & Telecom, Revenue (USD Million) 2018 – 2035 113
FIG NO. 45. Latin America Managed Services Market for Retail, Revenue (USD Million) 2018 – 2035 114
FIG NO. 46. Latin America Managed Services Market for Manufacturing, Revenue (USD Million) 2018 – 2035 115
FIG NO. 47. Latin America Managed Services Market for Healthcare, Revenue (USD Million) 2018 –
2035 116
FIG NO. 48. Latin America Managed Services Market for Government, Revenue (USD Million) 2018 –
2035 117
FIG NO. 49. Latin America Managed Services Market for Others, Revenue (USD Million) 2018 – 2035 118
FIG NO. 50. Latin America Managed Services Market Revenue, 2018 – 2035 (USD Million) 119
List of Tables
TABLE NO. 1. : Latin America Managed Services Market: Snapshot 45
TABLE NO. 2. : Drivers for the Latin America Managed Services Market: Impact Analysis 49
TABLE NO. 3. : Restraints for the Latin America Managed Services Market: Impact Analysis 52
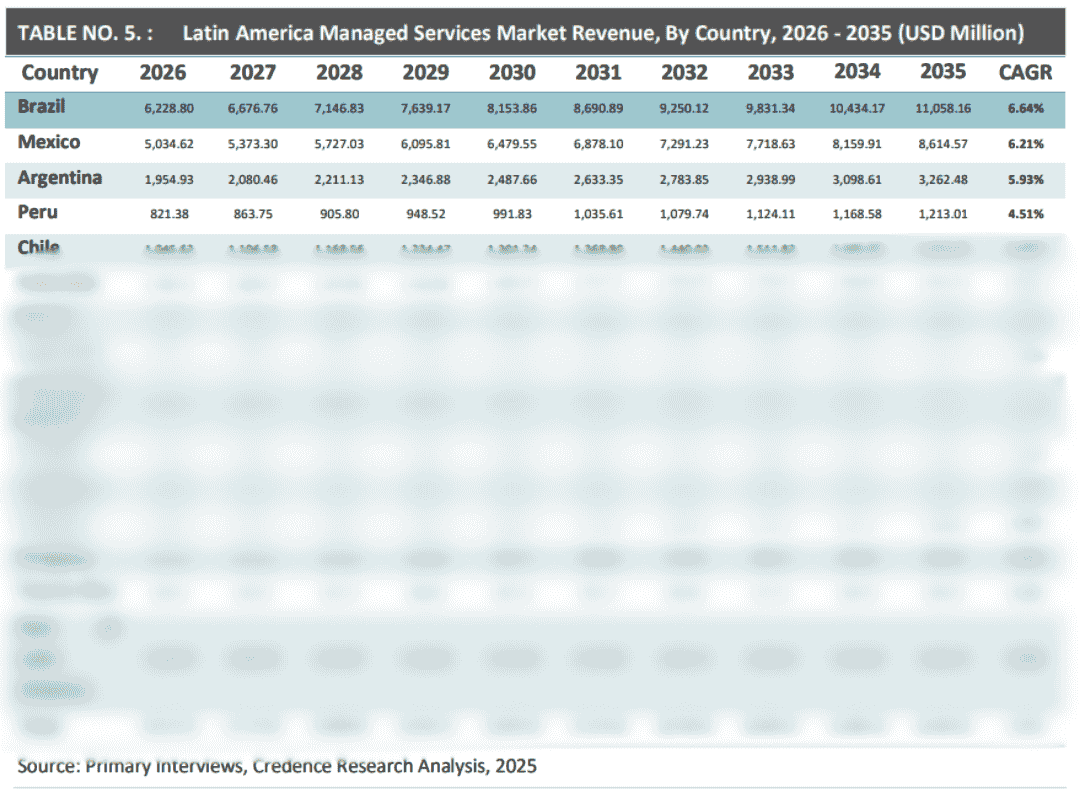
TABLE NO. 4. : Latin America Managed Services Market Revenue, By Country, 2018 – 2025 (USD Million).120 TABLE NO. 5. : Latin America Managed Services Market Revenue, By Country, 2026 – 2035 (USD Million).121 TABLE NO. 6. : Latin America Managed Services Market Revenue, By Service Type, 2018 – 2025 (USD
Million) 122
TABLE NO. 7. : Latin America Managed Services Market Revenue, By Service Type, 2026 – 2035 (USD Million) 123
TABLE NO. 8. : Latin America Managed Services Market Revenue, By Deployment Type, 2018 – 2025
(USD Million) 124
TABLE NO. 9. : Latin America Managed Services Market Revenue, By Deployment Type, 2026 – 2035
(USD Million) 124
TABLE NO. 10. : Latin America Managed Services Market Revenue, By Enterprise Size, 2018 – 2025 (USD Million) 125
TABLE NO. 11. : Latin America Managed Services Market Revenue, By Enterprise Size, 2026 – 2035 (USD Million) 125
TABLE NO. 12. : Latin America Managed Services Market Revenue, By End User, 2018 – 2025 (USD
Million) 126
TABLE NO. 13. : Latin America Managed Services Market Revenue, By End User, 2025 – 2035 (USD Million)126 TABLE NO. 14. : Brazil Managed Services Market Revenue, By Service Type, 2018 – 2025 (USD Million) 127
TABLE NO. 15. : Brazil Managed Services Market Revenue, By Service Type, 2026 – 2035 (USD Million) 128
TABLE NO. 16. : Brazil Managed Services Market Revenue, By Deployment Type, 2018 – 2025 (USD
Million) 129
TABLE NO. 17. : Brazil Managed Services Market Revenue, By Deployment Type, 2026 – 2035 (USD
Million) 129
TABLE NO. 18. : Brazil Managed Services Market Revenue, By Enterprise Size, 2018 – 2025 (USD Million) 130
TABLE NO. 19. : Brazil Managed Services Market Revenue, By Enterprise Size, 2026 – 2035 (USD Million) 130
TABLE NO. 20. : Brazil Managed Services Market Revenue, By End User, 2018 – 2025 (USD Million) 131
TABLE NO. 21. : Brazil Managed Services Market Revenue, By End User, 2025 – 2035 (USD Million) 131
TABLE NO. 22. : Mexico Managed Services Market Revenue, By Service Type, 2018 – 2025 (USD Million) 132
TABLE NO. 23. : Mexico Managed Services Market Revenue, By Service Type, 2026 – 2035 (USD Million) 133
TABLE NO. 24. : Mexico Managed Services Market Revenue, By Deployment Type, 2018 – 2025 (USD
Million) 134
TABLE NO. 25. : Mexico Managed Services Market Revenue, By Deployment Type, 2026 – 2035 (USD
Million) 134
TABLE NO. 26. : Mexico Managed Services Market Revenue, By Enterprise Size, 2018 – 2025 (USD Million)135 TABLE NO. 27. : Mexico Managed Services Market Revenue, By Enterprise Size, 2026 – 2035 (USD Million) 135 TABLE NO. 28. : Mexico Managed Services Market Revenue, By End User, 2018 – 2025 (USD Million) 136
TABLE NO. 29. : Mexico Managed Services Market Revenue, By End User, 2025 – 2035 (USD Million) 136
TABLE NO. 30. : Argentina Managed Services Market Revenue, By Service Type, 2018 – 2025 (USD Million) 137 TABLE NO. 31. : Argentina Managed Services Market Revenue, By Service Type, 2026 – 2035 (USD Million) 138
TABLE NO. 32. : Argentina Managed Services Market Revenue, By Deployment Type, 2018 – 2025 (USD Million) 139
TABLE NO. 33. : Argentina Managed Services Market Revenue, By Deployment Type, 2026 – 2035 (USD Million) 139
TABLE NO. 34. : Argentina Managed Services Market Revenue, By Enterprise Size, 2018 – 2025 (USD
Million) 140
TABLE NO. 35. : Argentina Managed Services Market Revenue, By Enterprise Size, 2026 – 2035 (USD
Million) 140
TABLE NO. 36. : Argentina Managed Services Market Revenue, By End User, 2018 – 2025 (USD Million) 141
TABLE NO. 37. : Argentina Managed Services Market Revenue, By End User, 2025 – 2035 (USD Million) 141
TABLE NO. 38. : Peru Managed Services Market Revenue, By Service Type, 2018 – 2025 (USD Million) 142
TABLE NO. 39. : Peru Managed Services Market Revenue, By Service Type, 2026 – 2035 (USD Million) 143
TABLE NO. 40. : Peru Managed Services Market Revenue, By Deployment Type, 2018 – 2025 (USD Million) 144 TABLE NO. 41. : Peru Managed Services Market Revenue, By Deployment Type, 2026 – 2035 (USD Million) 144 TABLE NO. 42. : Peru Managed Services Market Revenue, By Enterprise Size, 2018 – 2025 (USD Million) 145
TABLE NO. 43. : Peru Managed Services Market Revenue, By Enterprise Size, 2026 – 2035 (USD Million) 145
TABLE NO. 44. : Peru Managed Services Market Revenue, By End User, 2018 – 2025 (USD Million) 146
TABLE NO. 45. : Peru Managed Services Market Revenue, By End User, 2025 – 2035 (USD Million) 146
TABLE NO. 46. : Chile Managed Services Market Revenue, By Service Type, 2018 – 2025 (USD Million) 147
TABLE NO. 47. : Chile Managed Services Market Revenue, By Service Type, 2026 – 2035 (USD Million) 148
TABLE NO. 48. : Chile Managed Services Market Revenue, By Deployment Type, 2018 – 2025 (USD Million)149 TABLE NO. 49. : Chile Managed Services Market Revenue, By Deployment Type, 2026 – 2035 (USD Million)149 TABLE NO. 50. : Chile Managed Services Market Revenue, By Enterprise Size, 2018 – 2025 (USD Million) 150
TABLE NO. 51. : Chile Managed Services Market Revenue, By Enterprise Size, 2026 – 2035 (USD Million) 150
TABLE NO. 52. : Chile Managed Services Market Revenue, By End User, 2018 – 2025 (USD Million) 151
TABLE NO. 53. : Chile Managed Services Market Revenue, By End User, 2025 – 2035 (USD Million) 151
TABLE NO. 54. : Colombia Managed Services Market Revenue, By Service Type, 2018 – 2025 (USD Million) 152 TABLE NO. 55. : Colombia Managed Services Market Revenue, By Service Type, 2026 – 2035 (USD Million) 153 TABLE NO. 56. : Colombia Managed Services Market Revenue, By Deployment Type, 2018 – 2025 (USD
Million) 154
TABLE NO. 57. : Colombia Managed Services Market Revenue, By Deployment Type, 2026 – 2035 (USD Million) 154
TABLE NO. 58. : Colombia Managed Services Market Revenue, By Enterprise Size, 2018 – 2025 (USD
Million) 155
TABLE NO. 59. : Colombia Managed Services Market Revenue, By Enterprise Size, 2026 – 2035 (USD
Million) 155
TABLE NO. 60. : Colombia Managed Services Market Revenue, By End User, 2018 – 2025 (USD Million) 156
TABLE NO. 61. : Colombia Managed Services Market Revenue, By End User, 2025 – 2035 (USD Million) 156
TABLE NO. 62. : Bolivia Managed Services Market Revenue, By Service Type, 2018 – 2025 (USD Million) 157
TABLE NO. 63. : Bolivia Managed Services Market Revenue, By Service Type, 2026 – 2035 (USD Million) 158
TABLE NO. 64. : Bolivia Managed Services Market Revenue, By Deployment Type, 2018 – 2025 (USD
Million) 159
TABLE NO. 65. : Bolivia Managed Services Market Revenue, By Deployment Type, 2026 – 2035 (USD
Million) 159
TABLE NO. 66. : Bolivia Managed Services Market Revenue, By Enterprise Size, 2018 – 2025 (USD Million).160
TABLE NO. 67. : Bolivia Managed Services Market Revenue, By Enterprise Size, 2026 – 2035 (USD Million) .160 TABLE NO. 68. : Bolivia Managed Services Market Revenue, By End User, 2018 – 2025 (USD Million) 161
TABLE NO. 69. : Bolivia Managed Services Market Revenue, By End User, 2025 – 2035 (USD Million) 161
TABLE NO. 70. : Costa Rica Managed Services Market Revenue, By Service Type, 2018 – 2025 (USD Million)162 TABLE NO. 71. : Costa Rica Managed Services Market Revenue, By Service Type, 2026 – 2035 (USD Million)163 TABLE NO. 72. : Costa Rica Managed Services Market Revenue, By Deployment Type, 2018 – 2025 (USD
Million) 164
TABLE NO. 73. : Costa Rica Managed Services Market Revenue, By Deployment Type, 2026 – 2035 (USD Million) 164
TABLE NO. 74. : Costa Rica Managed Services Market Revenue, By Enterprise Size, 2018 – 2025 (USD
Million) 165
TABLE NO. 75. : Costa Rica Managed Services Market Revenue, By Enterprise Size, 2026 – 2035 (USD
Million) 165
TABLE NO. 76. : Costa Rica Managed Services Market Revenue, By End User, 2018 – 2025 (USD Million) 166
TABLE NO. 77. : Costa Rica Managed Services Market Revenue, By End User, 2025 – 2035 (USD Million) 166
TABLE NO. 78. : Dominican Republic Managed Services Market Revenue, By Service Type, 2018 – 2025
(USD Million) 167
TABLE NO. 79. : Dominican Republic Managed Services Market Revenue, By Service Type, 2026 – 2035
(USD Million) 168
TABLE NO. 80. : Dominican Republic Managed Services Market Revenue, By Deployment Type, 2018 –
2025 (USD Million) 169
TABLE NO. 81. : Dominican Republic Managed Services Market Revenue, By Deployment Type, 2026 –
2035 (USD Million) 169
TABLE NO. 82. : Dominican Republic Managed Services Market Revenue, By Enterprise Size, 2018 – 2025 (USD Million) 170
TABLE NO. 83. : Dominican Republic Managed Services Market Revenue, By Enterprise Size, 2026 – 2035 (USD Million) 170
TABLE NO. 84. : Dominican Republic Managed Services Market Revenue, By End User, 2018 – 2025 (USD Million) 171
TABLE NO. 85. : Dominican Republic Managed Services Market Revenue, By End User, 2025 – 2035 (USD Million) 171
TABLE NO. 86. : Ecuador Managed Services Market Revenue, By Service Type, 2018 – 2025 (USD Million) 172
TABLE NO. 87. : Ecuador Managed Services Market Revenue, By Service Type, 2026 – 2035 (USD Million) 173
TABLE NO. 88. : Ecuador Managed Services Market Revenue, By Deployment Type, 2018 – 2025 (USD
Million) 174
TABLE NO. 89. : Ecuador Managed Services Market Revenue, By Deployment Type, 2026 – 2035 (USD
Million) 174
TABLE NO. 90. : Ecuador Managed Services Market Revenue, By Enterprise Size, 2018 – 2025 (USD
Million) 175
TABLE NO. 91. : Ecuador Managed Services Market Revenue, By Enterprise Size, 2026 – 2035 (USD Million)175 TABLE NO. 92. : Ecuador Managed Services Market Revenue, By End User, 2018 – 2025 (USD Million) 176
TABLE NO. 93. : Ecuador Managed Services Market Revenue, By End User, 2025 – 2035 (USD Million) 176
TABLE NO. 94. : Honduras Managed Services Market Revenue, By Service Type, 2018 – 2025 (USD Million) 177 TABLE NO. 95. : Honduras Managed Services Market Revenue, By Service Type, 2026 – 2035 (USD Million) 178
TABLE NO. 96. : Honduras Managed Services Market Revenue, By Deployment Type, 2018 – 2025 (USD Million) 179
TABLE NO. 97. : Honduras Managed Services Market Revenue, By Deployment Type, 2026 – 2035 (USD Million) 179
TABLE NO. 98. : Honduras Managed Services Market Revenue, By Enterprise Size, 2018 – 2025 (USD
Million) 180
TABLE NO. 99. : Honduras Managed Services Market Revenue, By Enterprise Size, 2026 – 2035 (USD
Million) 180
TABLE NO. 100. : Honduras Managed Services Market Revenue, By End User, 2018 – 2025 (USD Million) 181
TABLE NO. 101. : Honduras Managed Services Market Revenue, By End User, 2025 – 2035 (USD Million) 181
TABLE NO. 102. : Panama Managed Services Market Revenue, By Service Type, 2018 – 2025 (USD Million) 182
TABLE NO. 103. : Panama Managed Services Market Revenue, By Service Type, 2026 – 2035 (USD Million) 183
TABLE NO. 104. : Panama Managed Services Market Revenue, By Deployment Type, 2018 – 2025 (USD
Million) 184
TABLE NO. 105. : Panama Managed Services Market Revenue, By Deployment Type, 2026 – 2035 (USD
Million) 184
TABLE NO. 106. : Panama Managed Services Market Revenue, By Enterprise Size, 2018 – 2025 (USD
Million) 185
TABLE NO. 107. : Panama Managed Services Market Revenue, By Enterprise Size, 2026 – 2035 (USD Million)185 TABLE NO. 108. : Panama Managed Services Market Revenue, By End User, 2018 – 2025 (USD Million) 186
TABLE NO. 109. : Panama Managed Services Market Revenue, By End User, 2025 – 2035 (USD Million) 186
TABLE NO. 110. : Uruguay Managed Services Market Revenue, By Service Type, 2018 – 2025 (USD Million) 187
TABLE NO. 111. : Uruguay Managed Services Market Revenue, By Service Type, 2026 – 2035 (USD Million) 188
TABLE NO. 112. : Uruguay Managed Services Market Revenue, By Deployment Type, 2018 – 2025 (USD
Million) 189
TABLE NO. 113. : Uruguay Managed Services Market Revenue, By Deployment Type, 2026 – 2035 (USD
Million) 189
TABLE NO. 114. : Uruguay Managed Services Market Revenue, By Enterprise Size, 2018 – 2025 (USD
Million) 190
TABLE NO. 115. : Uruguay Managed Services Market Revenue, By Enterprise Size, 2026 – 2035 (USD
Million) 190
TABLE NO. 116. : Uruguay Managed Services Market Revenue, By End User, 2018 – 2025 (USD Million) 191
TABLE NO. 117. : Uruguay Managed Services Market Revenue, By End User, 2025 – 2035 (USD Million) 191
TABLE NO. 118. : Puerto Rico Managed Services Market Revenue, By Service Type, 2018 – 2025 (USD
Million) 192
TABLE NO. 119. : Puerto Rico Managed Services Market Revenue, By Service Type, 2026 – 2035 (USD
Million) 193
TABLE NO. 120. : Puerto Rico Managed Services Market Revenue, By Deployment Type, 2018 – 2025 (USD Million) 194
TABLE NO. 121. : Puerto Rico Managed Services Market Revenue, By Deployment Type, 2026 – 2035 (USD Million) 194
TABLE NO. 122. : Puerto Rico Managed Services Market Revenue, By Enterprise Size, 2018 – 2025 (USD Million) 195
TABLE NO. 123. : Puerto Rico Managed Services Market Revenue, By Enterprise Size, 2026 – 2035 (USD Million) 195
TABLE NO. 124. : Puerto Rico Managed Services Market Revenue, By End User, 2018 – 2025 (USD Million)..196 TABLE NO. 125. : Puerto Rico Managed Services Market Revenue, By End User, 2025 – 2035 (USD Million)…196 TABLE NO. 126. : Rest of Latin America Managed Services Market Revenue, By Service Type, 2018 – 2025
(USD Million) 197
TABLE NO 127. : Rest of Latin America Managed Services Market Revenue, By Service Type, 2026 – 2035
(USD Million) 198
TABLE NO 128. : Rest of Latin America Managed Services Market Revenue, By Deployment Type, 2018 –
2025 (USD Million) 199
TABLE NO 129. : Rest of Latin America Managed Services Market Revenue, By Deployment Type, 2026 –
2035 (USD Million) 199
TABLE NO 130. : Rest of Latin America Managed Services Market Revenue, By Enterprise Size, 2018 – 2025
(USD Million) 200
TABLE NO 131. : Rest of Latin America Managed Services Market Revenue, By Enterprise Size, 2026 – 2035
(USD Million) 200
TABLE NO. 132. : Rest of Latin America Managed Services Market Revenue, By End User, 2018 – 2025 (USD Million) 201
TABLE NO. 133. : Rest of Latin America Managed Services Market Revenue, By End User, 2025 – 2035 (USD Million) 201