Market Overview:
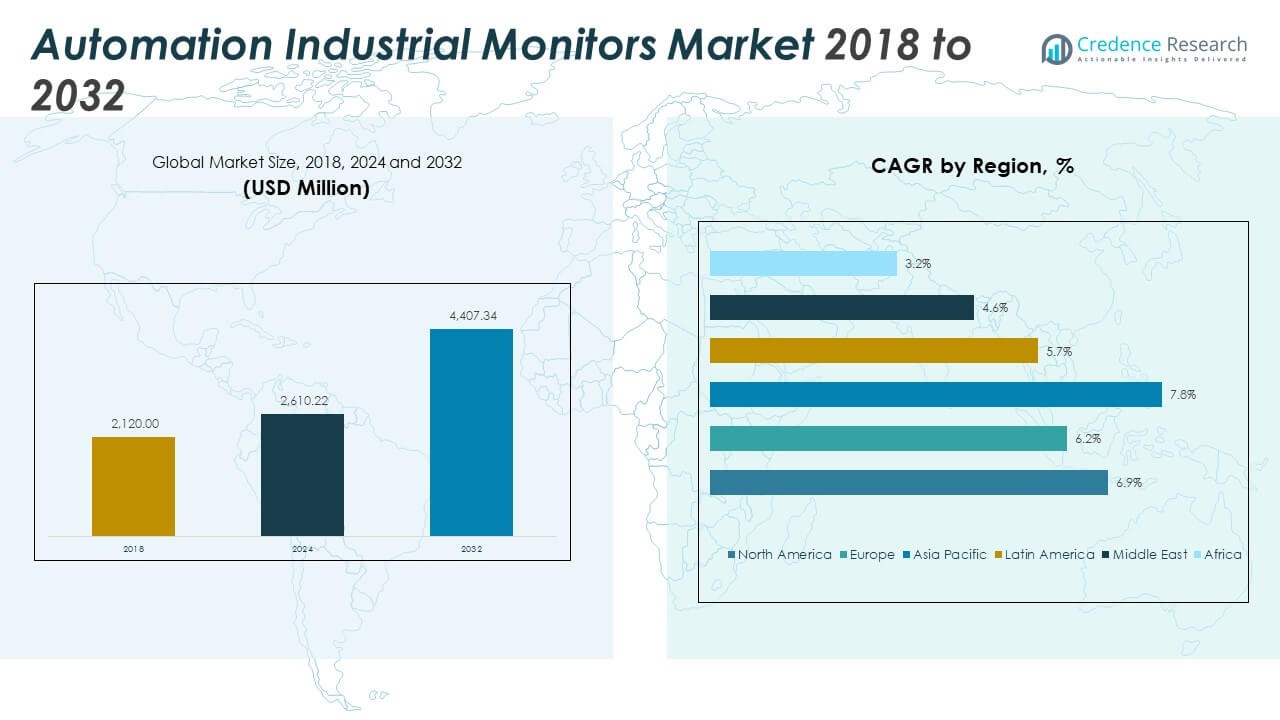
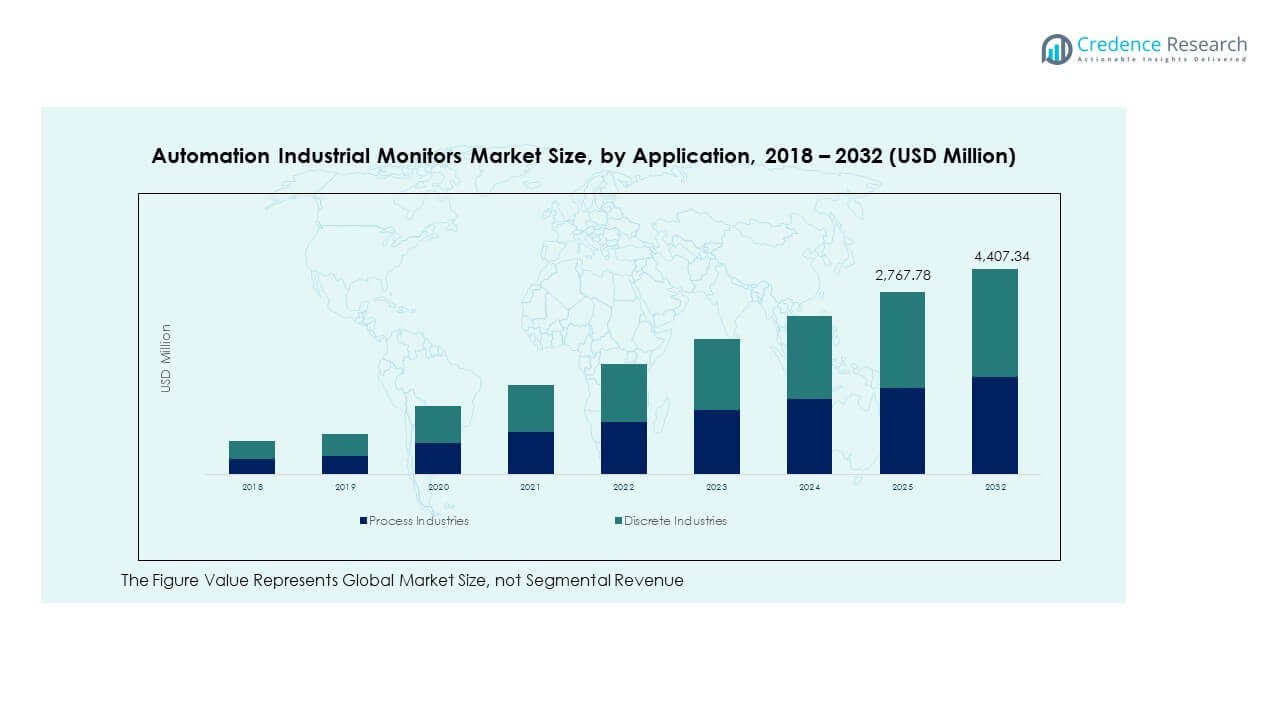
The Automation Industrial Monitors Market size was valued at USD 2,120.00 million in 2018 to USD 2,610.22 million in 2024 and is anticipated to reach USD 4,407.34 million by 2032, at a CAGR of 6.87% during the forecast period.
| REPORT ATTRIBUTE |
DETAILS |
| Historical Period |
2020-2023 |
| Base Year |
2024 |
| Forecast Period |
2025-2032 |
| Automation Industrial Monitors Market Size 2024 |
USD 2,610.22 Million |
| Automation Industrial Monitors Market, CAGR |
6.87% |
| Automation Industrial Monitors Market Size 2032 |
USD 4,407.34 Million |
Growing industrial automation, rising demand for real-time process visibility, and increasing adoption of smart manufacturing are key factors driving market growth. Companies are upgrading production systems with intelligent display technologies to improve operational accuracy and remote monitoring. The integration of IoT, AI, and edge computing into industrial monitors enhances control precision, predictive maintenance, and energy efficiency. These advancements help industries such as oil and gas, automotive, and energy optimize production efficiency while reducing downtime and human error.
North America leads the global market, driven by widespread use of automation and early adoption of advanced monitoring solutions. Europe follows with strong investments in Industry 4.0 and smart factory development. Asia Pacific is emerging rapidly due to large-scale manufacturing expansion and government initiatives promoting industrial digitization. Latin America and the Middle East show gradual progress, supported by modernization projects and the adoption of automated control systems across process industries. Africa is witnessing steady growth as industries begin implementing connected technologies for enhanced operational visibility.
Access crucial information at unmatched prices!
Request your sample report today & start making informed decisions powered by Credence Research Inc.!
Download Sample
Market Insights
- The Automation Industrial Monitors Market was valued at USD 2,120.00 million in 2018, reached USD 2,610.22 million in 2024, and is projected to hit USD 4,407.34 million by 2032, registering a CAGR of 6.87% from 2024 to 2032.
- North America holds 28% of the market share, supported by advanced automation adoption and the presence of key players across manufacturing and energy sectors.
- Europe accounts for 25% of the market, driven by smart factory initiatives and strong regulatory focus on process safety and efficiency, while Asia Pacific dominates with a 33% share due to large-scale industrialization and government-backed automation programs.
- Asia Pacific remains the fastest-growing region, propelled by expanding electronics and automotive manufacturing, smart factory adoption, and increasing investments in digital transformation across China, Japan, and India.
- Segment-wise, process industries represent roughly 55% of the total market share owing to continuous automation in oil, gas, and chemical sectors, while discrete industries hold 45%, reflecting strong demand from automotive and electronics manufacturing.
Market Drivers
Rising Demand for Real-Time Process Visualization and Data Accuracy
Industries are increasingly focusing on accurate real-time monitoring to improve production control. Automation industrial monitors help operators visualize process data and detect deviations early. Companies in manufacturing, oil and gas, and energy sectors rely on these monitors for continuous data display. It enhances operational transparency and supports faster decision-making on production floors. Integration with SCADA and HMI systems boosts system reliability and precision. The push for connected production environments has expanded adoption across large-scale facilities. Real-time process visualization also reduces unplanned downtime. This trend continues to fuel strong demand across automation-intensive industries.
Growing Adoption of IoT and Industry 4.0 Technologies
Integration of IoT and Industry 4.0 drives technological upgrades in industrial display systems. Automation industrial monitors are designed to connect with sensors, PLCs, and control units for seamless data flow. Companies are deploying smart displays for predictive maintenance and energy optimization. It helps monitor performance metrics and supports automated alerts for system faults. Industrial facilities benefit from enhanced asset utilization and reduced operational risks. Adoption of 4.0 frameworks has improved machine-to-machine communication and plant efficiency. The focus on smart factories has driven manufacturers to upgrade control infrastructure. Continuous investments in connected technologies will further strengthen market growth.
Increasing Need for Enhanced Operator Efficiency and Workplace Safety
Operator efficiency and safety are key priorities in modern industrial setups. Automation industrial monitors provide ergonomic designs and clear visuals for high-stress environments. It allows operators to track machinery performance and identify potential risks quickly. Rugged displays ensure visibility in harsh conditions, improving safety during critical operations. Companies in sectors like chemicals, power, and transportation rely on durable display systems. These monitors reduce human error and improve response time during system alerts. The need for minimal downtime and improved workforce safety has strengthened market penetration. Demand for industrial-grade displays continues to grow in automated production facilities.
- For instance, Honeywell’s WEB-HMI Series Touchscreen Monitors feature industrial-grade capacitive touch panels with over ten-year lifespans, IP66 ingress protection, and UL E160970 and CE certifications for installation in hazardous chemical and energy facilities; their ergonomic, high-visibility panels enable direct access to system alerts and schedules, supporting more efficient and safer operations in industrial environments.
Expanding Use of Energy-Efficient and Rugged Display Technologies
Energy-efficient and robust displays have become essential in industrial environments. Automation industrial monitors are built with LED-backlit and low-power components to cut energy use. Companies seek solutions that operate reliably under temperature and vibration extremes. It ensures sustained performance in heavy-duty applications such as mining and marine operations. Demand for durable touchscreens with IP-rated enclosures is also increasing. Energy-saving monitors help reduce long-term operational costs and support sustainability goals. The combination of durability and efficiency strengthens industrial adoption. Ongoing innovation in panel technology continues to attract wide-scale investment.
- For example, Teguar’s industrial monitors feature rugged die-cast aluminum chassis, IP66-rated front panels, and optional optical bonding. They are engineered for harsh environments with wide operating temperatures and LCDs rated for 30,000+ hours of backlight life.
Market Trends
Integration of AI and Predictive Analytics in Industrial Displays
Artificial intelligence and predictive analytics are reshaping industrial visualization systems. Automation industrial monitors now support analytics-driven insights for smarter control operations. It enables plants to anticipate maintenance needs and avoid costly equipment failures. AI algorithms analyze data patterns to optimize production efficiency. Integration of intelligent analytics enhances visualization beyond traditional display functions. Companies are using AI-powered dashboards to improve quality assurance and reduce error margins. These innovations contribute to better predictive control and resource management. The ongoing adoption of AI enhances the value proposition of industrial display systems.
Shift Toward Edge Computing and Decentralized Control Architectures
Edge computing has become a critical trend in automated operations. Automation industrial monitors are now equipped with edge processing capabilities to manage localized data. It reduces dependence on central servers and improves system responsiveness. Edge-enabled displays support faster decision-making at the operational level. Decentralized control helps maintain production continuity even in network disruptions. This structure supports scalability for multi-site manufacturing networks. Industrial users are shifting toward hybrid systems combining cloud and edge frameworks. The trend ensures higher efficiency and real-time visibility across automation setups.
- For instance, Advantech provided ARK-3532 edge computers to a leading Japanese semiconductor equipment manufacturer, enabling high-speed local data processing for advanced lithography machines.
Rising Demand for Modular and Customizable Display Interfaces
Customizable displays have gained traction among industrial manufacturers seeking flexibility. Automation industrial monitors now offer modular designs with interchangeable components. It allows companies to adapt systems for specific operational requirements. Modular screens simplify upgrades and maintenance without full replacements. Customization supports sector-specific needs such as precision manufacturing or hazardous environments. Flexible configurations also enhance integration with PLCs, sensors, and robotic systems. Companies view modularity as a cost-efficient approach to modernization. The trend reflects a growing emphasis on adaptability and scalability in automation solutions.
Increasing Focus on Sustainable and Low-Power Display Solutions
Sustainability has become central to industrial technology investments. Automation industrial monitors are evolving with low-power designs and recyclable materials. It supports environmental compliance and energy-saving initiatives in industrial settings. Manufacturers are investing in LED and OLED panels to lower emissions. Long-life display components minimize replacement cycles and waste generation. Adoption of eco-friendly technologies aligns with global sustainability goals. Companies that prioritize energy-efficient operations are leading adoption. The trend strengthens the alignment between technology innovation and environmental responsibility.
- For instance, Barco’s TruePix TP-I LED video wall platform, featuring Infinipix Gen2 processing, achieved TÜV Rheinland 5-star eye comfort certification in October 2025 and ISO27001 manufacturing compliance. The system’s EcoPower standby mode supports energy conservation, and Barco guarantees 10 years of dedicated service and remote cloud-based management.
Market Challenges Analysis
High Initial Installation Costs and System Integration Complexities
High setup costs remain a major challenge for industrial automation projects. Automation industrial monitors require significant investment in compatible control systems and connectivity infrastructure. It limits adoption among small and medium-sized enterprises with tight budgets. Integration with legacy systems often demands custom engineering, increasing total deployment costs. Complex installation processes also extend project timelines and affect ROI. Many firms face difficulties ensuring data security during system integration. Upgrading outdated facilities requires specialized expertise and hardware compatibility testing. These cost and complexity barriers continue to affect broader market adoption rates.
Limited Durability Under Extreme Environmental and Operational Conditions
Industrial environments often expose display systems to vibration, temperature, and dust. Automation industrial monitors, despite being rugged, still face performance degradation in extreme settings. It affects long-term reliability and increases maintenance expenses. Displays in oil rigs, foundries, and marine platforms require superior protection. Frequent exposure to chemicals or electromagnetic interference can shorten equipment lifespan. Manufacturers must balance durability with lightweight design and power efficiency. Maintenance costs add to total operational expenditure for large-scale facilities. Improving monitor resilience under diverse conditions remains a key engineering challenge.
Market Opportunities:
Emergence of Smart Factories Driving Next-Generation Display Demand
Smart factory initiatives are creating new opportunities for advanced visualization systems. Automation industrial monitors play a vital role in enabling intelligent control environments. It supports data-driven operations across manufacturing, energy, and logistics sectors. Smart displays facilitate interactive dashboards and remote monitoring capabilities. The rising focus on operational intelligence is pushing demand for integrated visualization units. Companies are seeking scalable solutions compatible with AI and IoT frameworks. Investments in smart infrastructure encourage innovation in display design and functionality. Growing digital transformation in industrial ecosystems expands this opportunity space.
Rising Adoption of Touchscreen and Gesture-Control Interfaces
Modern industrial environments are shifting toward intuitive human-machine interactions. Automation industrial monitors with capacitive touch and gesture-control features enhance usability. It enables operators to navigate complex data systems quickly and efficiently. These interfaces improve workflow accuracy and reduce manual intervention. Companies benefit from simplified control panels and reduced training time. Demand for user-friendly monitors is increasing across sectors like pharmaceuticals and automotive. Integration of advanced interaction technologies strengthens competitiveness among manufacturers. The move toward intuitive interfaces defines the next growth phase of industrial monitoring systems.
Market Segmentation Analysis
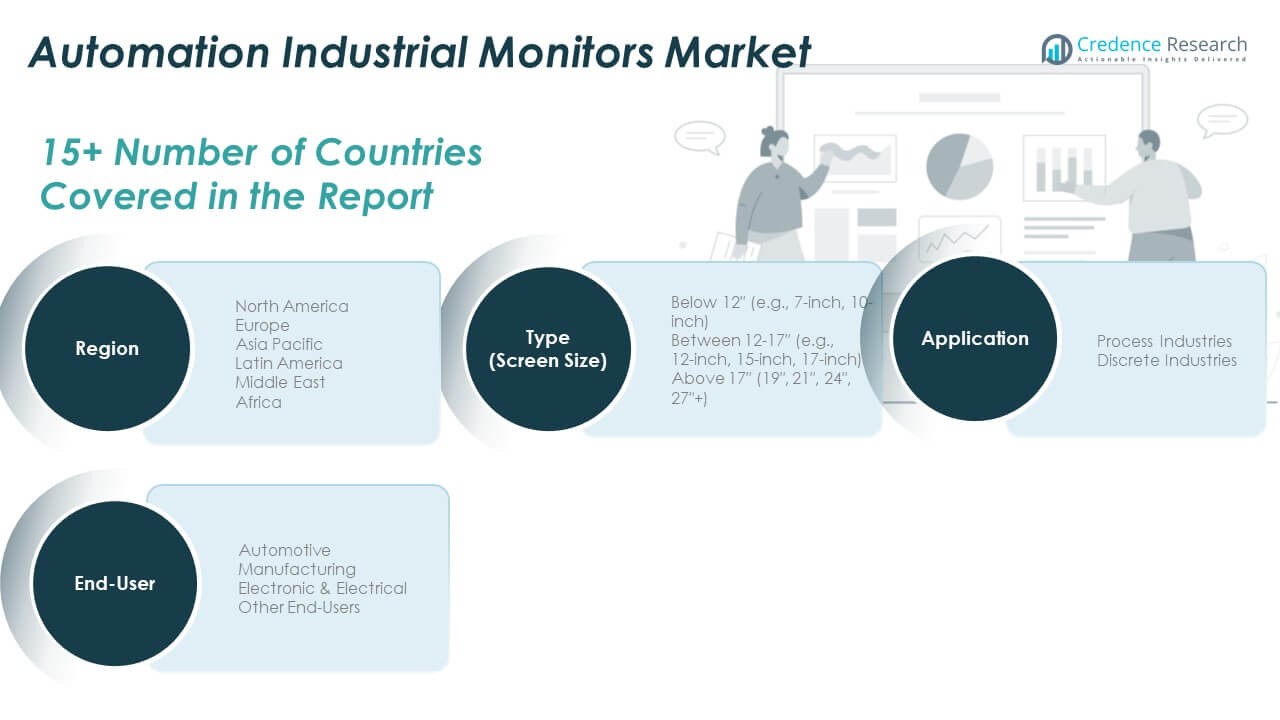
The Automation Industrial Monitors Market is segmented by type, application, and end-user.
By type, monitors between 12–17″ hold the dominant share due to their balanced visibility and compact design, ideal for industrial control panels. Below 12″ displays are widely used in portable or space-constrained environments, while monitors above 17″ gain traction in large-scale manufacturing and control centers where extended visualization is essential. Demand across all size categories is growing with the need for clear process monitoring and real-time data display.
- For example, Winmate’s modular panel PCs, available from 10.4″ to 24″, have been selected for flexible production cell installations in smart factories and CNC controller kiosks, supporting easy maintenance and upgrade in high-performance automation layouts.
By application, process industries account for the major market portion, driven by continuous automation in oil and gas, energy, and chemical sectors. These industries rely on durable displays to ensure precision and safety in monitoring. Discrete industries such as automotive and electronics manufacturing show strong adoption for quality inspection and production control systems. It demonstrates how versatility across sectors supports the steady expansion of industrial display integration.
- For instance, Pepperl+Fuchs’ VisuNet FLX HMI systems are installed in pharmaceutical cleanrooms, supporting regular mixing and monitoring of pharmaceutical batches at temperatures from -50 to 160°C as required for regulatory compliance in vaccine production, with wall-mount and portable cart configurations adapted for flexible, sterile plant environments.
By end-user, the manufacturing sector leads due to extensive use in assembly automation, plant control, and performance analytics. Automotive applications follow closely, driven by advanced production line automation and robotics integration. Electronic and electrical industries increasingly implement high-resolution monitors for design and testing operations. Other end-users, including pharmaceuticals and logistics, are expanding their use of industrial monitors for visualization and operational safety. The diverse adoption across these categories reflects the market’s role in supporting digital transformation and industrial efficiency worldwide.
Segmentation
By Type
- Below 12″ (e.g., 7-inch, 10-inch)
- Between 12-17″ (e.g., 12-inch, 15-inch, 17-inch)
- Above 17″ (19″, 21″, 24″, 27″+)
By Application
- Process Industries
- Discrete Industries
By End-User
- Automotive
- Manufacturing
- Electronic & Electrical
- Other End-Users
By Region
- North America
- Europe
- Germany
- France
- U.K.
- Italy
- Spain
- Rest of Europe
- Asia Pacific
- China
- Japan
- India
- South Korea
- South-east Asia
- Rest of Asia Pacific
- Latin America
- Brazil
- Argentina
- Rest of Latin America
- Middle East & Africa
- GCC Countries
- South Africa
- Rest of the Middle East and Africa
Regional Analysis
North America
The North America Automation Industrial Monitors Market size was valued at USD 608.44 million in 2018 to USD 737.63 million in 2024 and is anticipated to reach USD 1,243.32 million by 2032, at a CAGR of 6.9% during the forecast period. North America holds a 28% market share, driven by the early adoption of automation and advanced manufacturing practices. Strong demand from automotive, energy, and industrial machinery sectors supports steady market growth. It benefits from the integration of IoT and edge computing, enabling improved data visualization and process control. The U.S. remains the major revenue contributor with rising investments in industrial modernization. Canada and Mexico show growing adoption across manufacturing and process plants. Widespread implementation of predictive maintenance technologies enhances system efficiency. Strategic partnerships among automation solution providers continue to strengthen regional competitiveness.
Europe
The Europe Automation Industrial Monitors Market size was valued at USD 586.18 million in 2018 to USD 695.03 million in 2024 and is anticipated to reach USD 1,111.76 million by 2032, at a CAGR of 6.2% during the forecast period. Europe accounts for a 25% share, supported by its strong industrial automation base and emphasis on energy-efficient systems. Germany, France, and the UK drive market expansion through smart factory initiatives. It benefits from high investments in Industry 4.0 and digital transformation across automotive and electronics manufacturing. European regulations promoting workplace safety and process optimization fuel demand for rugged industrial monitors. The presence of established players like Siemens and ABB supports technological advancements. Growing focus on sustainability and low-power systems enhances product innovation. Regional manufacturers emphasize quality control and data accuracy in automation frameworks.
Asia Pacific
The Asia Pacific Automation Industrial Monitors Market size was valued at USD 737.76 million in 2018 to USD 936.67 million in 2024 and is anticipated to reach USD 1,698.15 million by 2032, at a CAGR of 7.8% during the forecast period. Asia Pacific leads the global market with a 33% share, driven by large-scale industrialization and growing manufacturing output. China, Japan, South Korea, and India are major contributors to the regional demand. It benefits from rapid expansion in automotive, electronics, and process industries. Government initiatives supporting industrial automation and smart manufacturing further boost adoption. The region is witnessing a surge in local production of cost-efficient display systems. Technological innovation and the rise of connected factories enhance market penetration. Rising exports of electronics and machinery continue to sustain demand across APAC economies.
Latin America
The Latin America Automation Industrial Monitors Market size was valued at USD 110.24 million in 2018 to USD 134.14 million in 2024 and is anticipated to reach USD 206.57 million by 2032, at a CAGR of 5.7% during the forecast period. Latin America represents a 7% share of the global market, led by Brazil and Mexico. It is influenced by rising investments in process automation, particularly in oil, gas, and food industries. The growing shift toward digital operations across regional manufacturing plants supports steady adoption. Expansion of industrial infrastructure and automation-focused policies improve growth potential. Brazil’s industrial base continues to modernize with new display technologies. Increasing foreign investments are driving industrial capacity expansion. The region’s adoption of automation software and integrated monitoring systems is expanding gradually.
Middle East
The Middle East Automation Industrial Monitors Market size was valued at USD 50.88 million in 2018 to USD 56.36 million in 2024 and is anticipated to reach USD 79.80 million by 2032, at a CAGR of 4.6% during the forecast period. The region holds a 4% market share, primarily supported by industrial modernization in GCC countries. Oil and gas, petrochemicals, and utilities dominate the demand landscape. It benefits from infrastructure projects emphasizing smart control and safety monitoring systems. Governments across Saudi Arabia and UAE are promoting digital manufacturing under Vision 2030 initiatives. Rising demand for remote monitoring in refineries and power plants strengthens the use of advanced display panels. Companies are focusing on rugged and heat-resistant monitors for harsh environments. The adoption of advanced control systems is improving plant productivity and monitoring precision.
Africa
The Africa Automation Industrial Monitors Market size was valued at USD 26.50 million in 2018 to USD 50.39 million in 2024 and is anticipated to reach USD 67.74 million by 2032, at a CAGR of 3.2% during the forecast period. Africa contributes a 3% market share, supported by gradual industrial development and foreign investments in manufacturing. South Africa leads adoption, followed by Egypt and Nigeria with emerging industrial automation initiatives. It faces infrastructure limitations but continues to adopt automation for energy and mining operations. Rising demand for monitoring systems in power generation and processing plants sustains growth. International partnerships with automation vendors are improving regional access to advanced technologies. The shift toward energy-efficient and durable equipment supports modernization efforts. Market growth remains steady as African industries integrate smart systems to enhance operational safety and productivity.
Shape Your Report to Specific Countries or Regions & Enjoy 30% Off!
Key Player Analysis
- Siemens AG
- Mitsubishi Electric Corporation
- Honeywell International Inc.
- ABB Group
- Eaton Corporation plc
- Emerson Electric Co.
- Rockwell Automation Inc.
- Danfoss A/S
- Omron Corporation
- FANUC Corporation
- SMC Corporation
- Yaskawa Electric Corporation
- Yokogawa Electric Corporation
- National Instruments Corporation
- Barco NV
- Pepperl+Fuchs GmbH
- Hope Industrial Systems Inc.
Competitive Analysis
The Automation Industrial Monitors Market is characterized by intense competition among global and regional manufacturers focusing on innovation, product durability, and smart connectivity. Leading players such as Siemens AG, ABB Group, Mitsubishi Electric Corporation, Rockwell Automation Inc., and Honeywell International Inc. dominate through strong portfolios and integrated automation solutions. It emphasizes advanced display systems with features like multi-touch interfaces, high brightness, and IoT compatibility to meet evolving industrial demands. Companies including Emerson Electric Co., Eaton Corporation plc, and Omron Corporation invest heavily in R&D to enhance product reliability under harsh conditions. Barco NV and Pepperl+Fuchs GmbH focus on industrial-grade visualization and safety monitoring. Competitive strategies revolve around mergers, partnerships, and regional expansion to strengthen distribution networks. Emerging players are targeting niche applications and cost-efficient product lines to gain market presence. Industry leaders are also aligning with sustainability goals by introducing energy-efficient displays and recyclable materials. The growing adoption of AI-based monitoring and predictive maintenance tools continues to redefine competition, encouraging firms to integrate intelligent features and edge-computing capabilities in their product offerings.
Recent Developments
- In October 2025, Mitsubishi Electric Automation Inc. launched the Integrated Machine Analytics (IMA) C70 Adapter, a plug-and-play device for real-time remote machine monitoring and diagnostics of CNC data. This product highlights the shift toward intelligent automation monitors equipped for proactive analysis and operational transparency within manufacturing facilities.
- In January 2025, Siemens AG introduced innovative AI-powered solutions for industrial automation at CES 2025, focusing on software-defined automation and industrial monitors that incorporate real-time edge AI capabilities. Siemens rolled out the new Siemens Industrial Copilot for Operations, designed to enable shop floor operators and maintenance engineers to make rapid, data-driven decisions directly at the machine level.
Report Coverage
The research report offers an in-depth analysis based on Type, Application and End-User. It details leading market players, providing an overview of their business, product offerings, investments, revenue streams, and key applications. Additionally, the report includes insights into the competitive environment, SWOT analysis, current market trends, as well as the primary drivers and constraints. Furthermore, it discusses various factors that have driven market expansion in recent years. The report also explores market dynamics, regulatory scenarios, and technological advancements that are shaping the industry. It assesses the impact of external factors and global economic changes on market growth. Lastly, it provides strategic recommendations for new entrants and established companies to navigate the complexities of the market.
Future Outlook
- Growing demand for real-time visualization and predictive analytics will strengthen industrial monitoring capabilities.
- Integration of IoT, AI, and edge computing will transform display systems into intelligent control interfaces.
- Expansion of smart factories will create strong demand for advanced and energy-efficient monitor designs.
- Rising investment in digital transformation will drive adoption across manufacturing and process sectors.
- Technological innovation in rugged and touch-enabled displays will improve operational efficiency and safety.
- Increased focus on sustainability will accelerate the development of low-power and recyclable display units.
- Partnerships between automation firms and software developers will enhance integration with control platforms.
- Regional manufacturers in Asia Pacific will expand their footprint through cost-effective production and exports.
- Adoption of remote and cloud-based monitoring systems will redefine industrial workflow management.
- The market will evolve toward modular, customizable solutions aligned with Industry 4.0 and smart maintenance needs.


