
Market Overview:
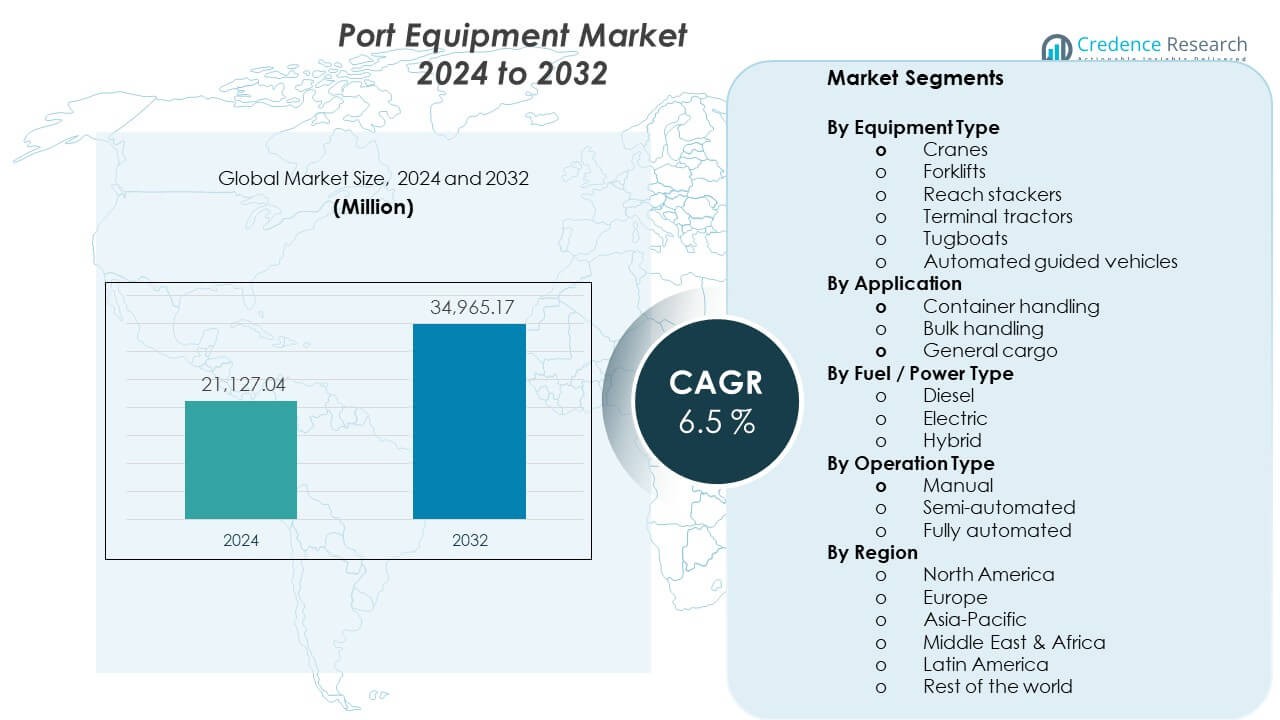
The Port Equipment Market is projected to grow from USD 21,127.04 million in 2024 to USD 34,965.17 million by 2032. The market is expected to record a CAGR of 6.5% from 2024 to 2032.| REPORT ATTRIBUTE | DETAILS |
|---|---|
| Historical Period | 2020-2023 |
| Base Year | 2024 |
| Forecast Period | 2025-2032 |
| Port Equipment Market Size 2024 | USD 21,127.04 Million |
| Port Equipment Market, CAGR | 6.5% |
| Port Equipment Market Size 2032 | USD 34,965.17 Million |
Market Insights:
- The market stood at USD 21,127.04 million in 2024 and will reach USD 34,965.17 million by 2032, posting a 6.5% CAGR.
- Asia-Pacific leads with about 45% share due to large ports and trade volume, followed by Europe at 25% for modernization focus and North America at 18% from terminal upgrades.
- Middle East & Africa is the fastest-growing region with nearly 8% share, driven by new port hubs, logistics corridors, and public-private investment.
- By application, container handling holds nearly 60% share due to high throughput needs, while bulk handling accounts for around 25% with commodity trade support.
- By equipment type, cranes represent about 40% share for heavy lift demand, while yard equipment and vehicles together contribute nearly 45% from daily terminal operations.
 Market Drivers
Expansion of Global Trade and Container Throughput Capacity
Rising seaborne trade volumes push ports to expand handling capacity. The Port Equipment Market benefits from growing containerized cargo flows worldwide. Port authorities invest in cranes and yard equipment to reduce congestion risks. Larger vessels require higher lift capacity and wider crane outreach. Terminal operators target faster ship turnaround and better berth use. Equipment upgrades support continuous port operations. National logistics plans back large port projects. These factors drive steady equipment demand across major ports. For instance, ZPMC has delivered ship-to-shore cranes with over 24-row outreach and lift capacities above 65 tonnes for ultra-large vessels.
Port Modernization Programs and Infrastructure Renewal Initiatives
Many ports operate with aging assets and limited automation levels. The Port Equipment Market gains momentum from structured modernization programs. Governments fund replacement of outdated cranes and vehicles. Private operators align assets with global port standards. Modern equipment improves safety and operational reliability. New terminals require full equipment deployment from early stages. Upgrades raise efficiency under space limits. These programs sustain long replacement cycles. For instance, Konecranes reports rubber-tired gantry cranes achieving availability above 98% during fleet renewal.
Operational Efficiency and Labor Productivity Improvement Needs
Ports face pressure to cut vessel waiting time and operating costs. The Port Equipment Market responds to strong productivity needs. Advanced equipment enables faster loading and unloading cycles. Operators reduce manual work and error risk. High labor costs support demand for efficient machinery. Better uptime supports predictable schedules. Standard systems simplify training and operations. Efficiency goals guide most procurement decisions.
Environmental Compliance and Emission Reduction Requirements
Stricter emission rules reshape port investments worldwide. The Port Equipment Market aligns with demand for cleaner machinery. Ports replace diesel units with electric or hybrid options. Regulators enforce noise and air limits. Low-emission equipment supports sustainability targets. Green port programs influence public funding choices. Suppliers adapt designs to meet rules. Environmental pressure remains a strong purchase driver.
Market Trends
Shift Toward Automated and Semi-Automated Terminal Operations
Automation adoption rises across large and mid-sized ports. The Port Equipment Market reflects this operating shift. Automated cranes improve precision and cycle stability. Remote operation improves worker safety. Software coordination improves yard traffic flow. Operators value predictable performance levels. Automation spreads beyond mega ports. This trend reshapes equipment design priorities. For instance, Kalmar’s AutoStrad™ tractors run unmanned for over 20 hours daily at automated terminals.
Growing Preference for Electrified and Hybrid Port Equipment
Electrification gains traction across global port fleets. The Port Equipment Market sees wider hybrid acceptance. Electric units reduce fuel cost exposure. Battery systems improve energy use per move. Ports invest in charging and grid upgrades. Lower maintenance supports lifecycle cost control. Energy efficiency aligns with decarbonization plans. This trend shapes fleet planning. For instance, Liebherr electric harbor cranes deliver zero local emissions with hoist speeds above 120 m/min.
Integration of Digital Monitoring and Fleet Management Systems
Digital tools support real-time equipment oversight. The Port Equipment Market adopts connected machinery platforms. Sensors track load, wear, and usage. Data improves preventive maintenance planning. Alerts reduce unexpected downtime. Fleet analytics optimize asset use. Dashboards improve management visibility. Connectivity becomes a standard feature.
Customization of Equipment for Terminal-Specific Layouts
Ports differ by layout, climate, and cargo mix. The Port Equipment Market adapts through customization. Suppliers offer modular designs for flexibility. Equipment fits space-limited terminals. Climate-specific designs improve durability. Customization supports mixed cargo handling. Operators value fit-for-purpose machinery. Collaboration between suppliers and operators strengthens.
Market Challenges Analysis
High Capital Investment and Long Payback Cycles
Port equipment requires high upfront capital. The Port Equipment Market faces buyer budget pressure. Long payback periods delay purchases. Public ports depend on funding approvals. Private operators balance returns and finance costs. Economic slowdowns affect capital plans. Currency risk raises import prices. Smaller ports face adoption limits.
Complex Maintenance Requirements and Skilled Workforce Gaps
Advanced equipment needs skilled technical support. The Port Equipment Market faces service capability gaps. Ports struggle to hire trained technicians. Maintenance delays raise operational risk. Spare part access affects uptime. Training needs time and investment. Equipment complexity increases service reliance. These issues challenge smooth operations.
Market Opportunities
Port Expansion in Emerging Trade Corridors
Emerging economies invest heavily in port capacity. The Port Equipment Market gains from greenfield terminals. New ports require full equipment supply. Trade corridors support steady demand. Public-private models fund large projects. Strategic locations attract logistics firms. Early-stage ports adopt modern standards. Expansion creates long-term opportunities.
Technology Upgrades Focused on Safety and Operational Resilience
Ports prioritize safety and resilience upgrades. The Port Equipment Market benefits from this focus. Advanced controls reduce accident risk. Redundant systems improve reliability. Weather-resistant designs support harsh climates. Safety rules guide procurement. Resilient equipment supports continuity. This opportunity drives premium demand.
Market Segmentation Analysis
Market Drivers
Expansion of Global Trade and Container Throughput Capacity
Rising seaborne trade volumes push ports to expand handling capacity. The Port Equipment Market benefits from growing containerized cargo flows worldwide. Port authorities invest in cranes and yard equipment to reduce congestion risks. Larger vessels require higher lift capacity and wider crane outreach. Terminal operators target faster ship turnaround and better berth use. Equipment upgrades support continuous port operations. National logistics plans back large port projects. These factors drive steady equipment demand across major ports. For instance, ZPMC has delivered ship-to-shore cranes with over 24-row outreach and lift capacities above 65 tonnes for ultra-large vessels.
Port Modernization Programs and Infrastructure Renewal Initiatives
Many ports operate with aging assets and limited automation levels. The Port Equipment Market gains momentum from structured modernization programs. Governments fund replacement of outdated cranes and vehicles. Private operators align assets with global port standards. Modern equipment improves safety and operational reliability. New terminals require full equipment deployment from early stages. Upgrades raise efficiency under space limits. These programs sustain long replacement cycles. For instance, Konecranes reports rubber-tired gantry cranes achieving availability above 98% during fleet renewal.
Operational Efficiency and Labor Productivity Improvement Needs
Ports face pressure to cut vessel waiting time and operating costs. The Port Equipment Market responds to strong productivity needs. Advanced equipment enables faster loading and unloading cycles. Operators reduce manual work and error risk. High labor costs support demand for efficient machinery. Better uptime supports predictable schedules. Standard systems simplify training and operations. Efficiency goals guide most procurement decisions.
Environmental Compliance and Emission Reduction Requirements
Stricter emission rules reshape port investments worldwide. The Port Equipment Market aligns with demand for cleaner machinery. Ports replace diesel units with electric or hybrid options. Regulators enforce noise and air limits. Low-emission equipment supports sustainability targets. Green port programs influence public funding choices. Suppliers adapt designs to meet rules. Environmental pressure remains a strong purchase driver.
Market Trends
Shift Toward Automated and Semi-Automated Terminal Operations
Automation adoption rises across large and mid-sized ports. The Port Equipment Market reflects this operating shift. Automated cranes improve precision and cycle stability. Remote operation improves worker safety. Software coordination improves yard traffic flow. Operators value predictable performance levels. Automation spreads beyond mega ports. This trend reshapes equipment design priorities. For instance, Kalmar’s AutoStrad™ tractors run unmanned for over 20 hours daily at automated terminals.
Growing Preference for Electrified and Hybrid Port Equipment
Electrification gains traction across global port fleets. The Port Equipment Market sees wider hybrid acceptance. Electric units reduce fuel cost exposure. Battery systems improve energy use per move. Ports invest in charging and grid upgrades. Lower maintenance supports lifecycle cost control. Energy efficiency aligns with decarbonization plans. This trend shapes fleet planning. For instance, Liebherr electric harbor cranes deliver zero local emissions with hoist speeds above 120 m/min.
Integration of Digital Monitoring and Fleet Management Systems
Digital tools support real-time equipment oversight. The Port Equipment Market adopts connected machinery platforms. Sensors track load, wear, and usage. Data improves preventive maintenance planning. Alerts reduce unexpected downtime. Fleet analytics optimize asset use. Dashboards improve management visibility. Connectivity becomes a standard feature.
Customization of Equipment for Terminal-Specific Layouts
Ports differ by layout, climate, and cargo mix. The Port Equipment Market adapts through customization. Suppliers offer modular designs for flexibility. Equipment fits space-limited terminals. Climate-specific designs improve durability. Customization supports mixed cargo handling. Operators value fit-for-purpose machinery. Collaboration between suppliers and operators strengthens.
Market Challenges Analysis
High Capital Investment and Long Payback Cycles
Port equipment requires high upfront capital. The Port Equipment Market faces buyer budget pressure. Long payback periods delay purchases. Public ports depend on funding approvals. Private operators balance returns and finance costs. Economic slowdowns affect capital plans. Currency risk raises import prices. Smaller ports face adoption limits.
Complex Maintenance Requirements and Skilled Workforce Gaps
Advanced equipment needs skilled technical support. The Port Equipment Market faces service capability gaps. Ports struggle to hire trained technicians. Maintenance delays raise operational risk. Spare part access affects uptime. Training needs time and investment. Equipment complexity increases service reliance. These issues challenge smooth operations.
Market Opportunities
Port Expansion in Emerging Trade Corridors
Emerging economies invest heavily in port capacity. The Port Equipment Market gains from greenfield terminals. New ports require full equipment supply. Trade corridors support steady demand. Public-private models fund large projects. Strategic locations attract logistics firms. Early-stage ports adopt modern standards. Expansion creates long-term opportunities.
Technology Upgrades Focused on Safety and Operational Resilience
Ports prioritize safety and resilience upgrades. The Port Equipment Market benefits from this focus. Advanced controls reduce accident risk. Redundant systems improve reliability. Weather-resistant designs support harsh climates. Safety rules guide procurement. Resilient equipment supports continuity. This opportunity drives premium demand.
Market Segmentation Analysis
- By equipment type, cranes lead due to heavy lift needs. Forklifts support flexible terminal movement. Reach stackers enable fast stacking in tight yards. Terminal tractors improve yard transport. Tugboats support vessel control. Automated guided vehicles enable precise flow. For instance, SANY reach stackers lift 45-tonne containers to five-high stacking.
- By application, container handling dominates operations. Bulk handling supports coal and grain cargo. General cargo serves mixed freight needs. Each use case drives different capacity needs.
- By fuel type, diesel remains common for reliability. Electric equipment grows under emission rules. Hybrid systems balance range and efficiency.
- By operation type, manual systems suit small ports. Semi-automated systems raise productivity. Fully automated solutions serve high-volume terminals. Automation choice depends on scale and labor strategy.
Segmentation:
By Equipment Type- Cranes
- Forklifts
- Reach stackers
- Terminal tractors
- Tugboats
- Automated guided vehicles
- Container handling
- Bulk handling
- General cargo
- Diesel
- Electric
- Hybrid
- Manual
- Semi-automated
- Fully automated
- North America
- U.S.
- Canada
- Mexico
- Europe
- Germany
- France
- U.K.
- Italy
- Spain
- Rest of Europe
- Asia Pacific
- China
- Japan
- India
- South Korea
- South-east Asia
- Rest of Asia Pacific
- Latin America
- Brazil
- Argentina
- Rest of Latin America
- Middle East & Africa
- GCC Countries
- South Africa
- Rest of the Middle East and Africa
Regional Analysis:
Asia-Pacific and Europe Market Performance Asia-Pacific holds the largest global share at nearly 45%. The Port Equipment Market benefits from high container volumes across Chinese ports. Japan and South Korea support demand through advanced terminal systems. Southeast Asia expands capacity to support export growth. Europe accounts for around 25% of total share. Germany, the Netherlands, and Spain lead due to strong modernization programs. Regional focus stays on automation and emission reduction. North America and Middle East & Africa Market Position North America represents about 18% of global demand. The Port Equipment Market sees strong activity from terminal upgrades in the United States. Canada supports steady replacement at major ports. Regional operators focus on efficiency and safety standards. Middle East and Africa hold nearly 8% share. Gulf countries invest in large-scale port projects. African ports expand capacity to improve trade connectivity. Latin America and Rest of the World Market Outlook Latin America contributes close to 3% of global share. The Port Equipment Market gains traction from export-led port expansion. Brazil and Chile lead equipment demand in the region. Ports invest in systems for agricultural and mineral cargo. The rest of the world accounts for about 1% share. Smaller ports focus on selective replacement. Demand remains stable with gradual modernization.Key Player Analysis:
- Cargotec Corporation (Kalmar)
- Konecranes Oyj
- Liebherr Group
- Shanghai Zhenhua Heavy Industries (ZPMC)
- Sany Heavy Industry Co., Ltd.
Competitive Analysis:
The Port Equipment Market shows strong competition among global manufacturers with broad product portfolios. Leading players focus on cranes, yard vehicles, and automated solutions to serve diverse terminals. Companies compete on equipment reliability, lifecycle cost, and service reach. Product differentiation centers on automation capability and energy efficiency. Strategic partnerships help suppliers expand regional presence. After-sales service quality influences buyer loyalty. Technology integration strengthens competitive positioning. Scale and manufacturing capacity support pricing flexibility. It remains moderately consolidated with strong global brands.Recent Developments:
In September 2025, Liebherr Group signed a long-term partnership with Transnet Port Terminals in South Africa. The 10-year agreement includes a 20-year asset management program and major equipment orders. Transnet ordered four ship-to-shore cranes for Durban and 48 rubber-tyred gantry cranes for Durban and Cape Town. The deal also covers rail-mounted gantry and mobile harbor cranes. Liebherr plans a new technology and service center in Durban with 24/7 support in Cape Town. In June 2025, ZPMC delivered four compact ship-to-shore cranes for Hong Kong’s Integrated Waste Management Facilities project. These cranes feature a 25.5-ton lifting capacity and energy-efficient design. In December 2025, ZPMC entered the South Korean market by delivering its first advanced portal crane to Hanwha Ocean. The crane offers a 60-ton lift capacity with smart safety and control systems. In June 2024, Cargotec completed the partial demerger of Kalmar into an independent company. Kalmar began trading on Nasdaq Helsinki on July 1, 2024. The move positioned Kalmar as a focused provider of sustainable cargo handling equipment. The company operates in over 120 countries with about EUR 2.0 billion in annual sales and nearly 5,000 employees.Report Coverage:
The research report offers an in-depth analysis based on equipment type, application, fuel or power type, operation type, and region. It details leading market players, providing an overview of their business, product offerings, investments, revenue streams, and key applications. Additionally, the report includes insights into the competitive environment, SWOT analysis, current market trends, as well as the primary drivers and constraints. Furthermore, it discusses various factors that have driven market expansion in recent years. The report also explores market dynamics, regulatory scenarios, and technological advancements that are shaping the industry. It assesses the impact of external factors and global economic changes on market growth. Lastly, it provides strategic recommendations for new entrants and established companies to navigate the complexities of the market.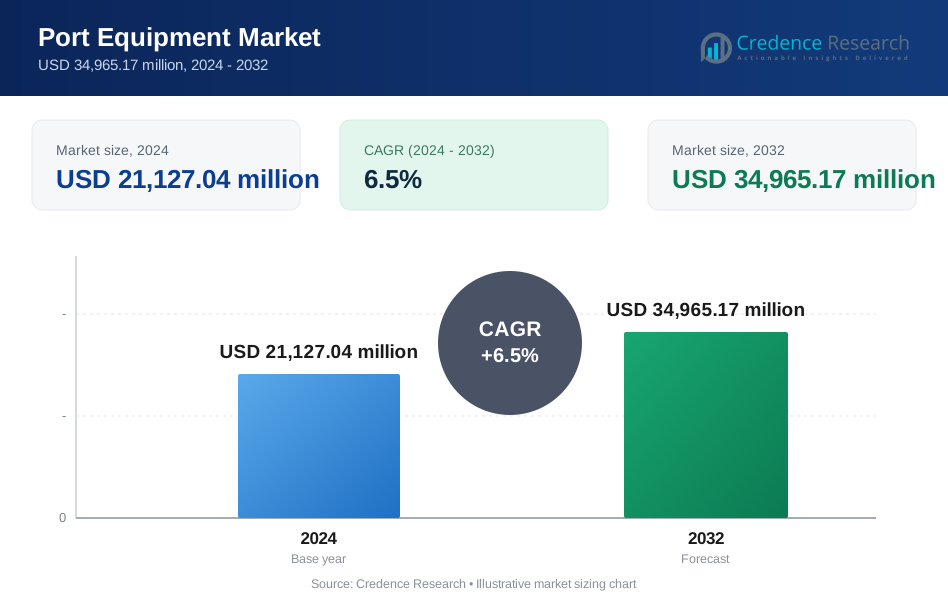
Request a Free Sample
Fill in your details and we'll send you a free sample report.
- Sample data tables & charts
- Research methodology
Need a Custom Version of This Report?
Tailor the scope, geography, or segments to your exact requirements.
- Custom geography or segment scope
- Direct access to our analyst team
Frequently Asked Questions
What is the current market size for Port Equipment Market, and what is its projected size in 2032?
At what Compound Annual Growth Rate is the Port Equipment Market projected to grow between 2025 and 2032?
Which Port Equipment Market segment held the largest share in 2024?
What are the primary factors fueling the growth of the Port Equipment Market?
Who are the leading companies in the Port Equipment Market?
Which region commanded the largest share of the Port Equipment Market in 2024?
Table of Content
Chapter 1. Report Introduction
- 1.1 Report Description & Purpose
- 1.1.1 Report Title & Market Definition
- 1.1.2 Unique Selling Propositions (USP) & Key Differentiators
- 1.1.3 Value Proposition for Stakeholders
- 1.2 Research Objectives
- 1.2.1 Market Sizing Objectives (Volume & Revenue) (Volume Where Applicable)
- 1.2.2 Segmentation Objectives
- 1.2.3 Competitive Intelligence Objectives
- 1.2.4 Forecast & Scenario Objectives
- 1.3 Report Scope
- 1.3.1 Port Equipment Scope – Segments & Subsegments Covered
- 1.3.2 Geographic Scope – Regions & Countries Covered
- 1.3.3 Historical Period, Base Year & Forecast Period (2024; forecast to 2032)
- 1.3.4 Inclusions & Exclusions
- 1.4 Industry Classification & Applicable Codes
- 1.5 Currency, Measurement Units & Valuation Basis
- 1.6 Target Stakeholders
- 1.7 Limitations & Assumptions
Chapter 2. Executive Summary
- 2.1 Global Port Equipment Market Snapshot
- 2.1.1 Market Size – Historical (2024) & Forecast (2024-2032) (2024: USD 21,127.04 million → 2032: USD 34,965.17 million)
- 2.1.2 Volume & Revenue – Global Totals (Volume Where Applicable)
- 2.1.3 Key Market Highlights – Top Five Facts
- 2.2 Port Equipment Market Segmentation Snapshot
- 2.2.1 Market Split by Region – 2024 vs. 2032
- 2.3 Competitive Snapshot
- 2.3.1 Top 10 Players by Revenue Share – 2024
- 2.3.2 Top 10 Players by Volume Share – 2024 (Volume Where Applicable)
- 2.3.3 Recent Strategic Developments (18-Month Summary)
- 2.4 Key Investment Highlights & Strategic Conclusions
Chapter 3. Port Equipment Market Dynamics & Industry Analysis
- 3.1 Market Overview & Context
- 3.1.1 Port Equipment Market Position in the Broader Industry Value Chain
- 3.1.2 Demand Structure & Purchasing Dynamics
- 3.1.3 Market Maturity & Development Stage by Region
- 3.2 Port Equipment Market Drivers
- 3.3 Port Equipment Market Restraints & Challenges
- 3.4 Port Equipment Market Opportunities
- 3.5 Porter's Five Forces Analysis
- 3.5.1 Threat of New Entrants
- 3.5.2 Bargaining Power of Suppliers
- 3.5.3 Bargaining Power of Buyers
- 3.5.4 Threat of Substitutes
- 3.5.5 Competitive Rivalry – Intensity Assessment
- 3.6 Port Equipment Value Chain Analysis
- 3.6.1 Upstream – Key Inputs, Resources & Suppliers
- 3.6.1.1 Key Input/Resource 1
- 3.6.1.2 Key Input/Resource 2
- 3.6.1.3 Key Input/Resource 3
- 3.6.2 Midstream – Core Operations & Value Creation
- 3.6.2.1 Operating Model & Process Overview
- 3.6.2.2 Key Operating Locations & Capabilities by Company
- 3.6.3 Downstream – Market Channels & End Users
- 3.6.3.1 Direct Sales & Customer Engagement Channels
- 3.6.3.2 Indirect Sales, Intermediaries & Partner Channels
- 3.6.4 Value Chain Profitability Analysis
- 3.6.1 Upstream – Key Inputs, Resources & Suppliers
- 3.7 PESTEL Analysis
- 3.7.1 Political Factors
- 3.7.2 Economic Factors
- 3.7.3 Social Factors
- 3.7.4 Technological Factors
- 3.7.5 Environmental Factors
- 3.7.6 Legal Factors
- 3.8 Port Equipment Supply Chain Analysis
- 3.8.1 Critical Input & Resource Availability Risk Assessment
- 3.8.2 Supplier & Operational Concentration Risk (Geographic Exposure)
- 3.8.3 Supply & Service Disruption Impact Analysis
- 3.9 Regulatory & Policy Landscape
Note: The regulatory and policy landscape section covers regulations based on their applicability to the market, Port Equipment category, geography, and scope of the study. Only regulatory frameworks with a material impact on operations, compliance, trade, sustainability, or market access are analyzed in detail.
Chapter 4. Key Investment Pockets & Opportunity Analysis
- 4.1 Port Equipment Market Attractiveness Analysis
- 4.1.1 By Region – Investment Attractiveness Matrix (Market Size × CAGR)
- 4.2 Absolute Revenue Growth Opportunity
- 4.2.1 By Region – Absolute Revenue Growth Through 2032
- 4.3 Incremental Demand Opportunity
- 4.3.1 By Region – Incremental Demand Through 2032
- 4.3.2 Segment – Incremental Demand
- 4.4 Emerging Submarket Opportunity Deep Dive (Subject to Applicability)
- 4.5 Priority Market Opportunity Scorecards
- 4.5.1 United States
- 4.5.2 Europe
- 4.5.3 Asia
- 4.5.4 Middle East & Africa
Note: Priority market opportunity scorecards reflect the geographic scope and strategic relevance of the study. Listed markets are indicative and may be adapted to the industry.
Chapter 5. Port Equipment Cross-Border Trade & Market Access Analysis
- 5.1 International Trade & Cross-Border Activity Overview
- 5.1.1 Global Export Value by Country (2024)
- 5.1.2 Global Export Volume by Country (2024) (Volume Where Applicable)
- 5.1.3 Global Import Value by Country (2024)
- 5.1.4 Global Import Volume by Country (2024) (Volume Where Applicable)
- 5.1.5 Net Trade Balance by Country (2024)
- 5.2 Export Analysis – Segment
- 5.2.1 Category 1 (Applicable Classification Code)
- 5.2.2 Category 2 (Applicable Classification Code)
- 5.2.3 Category 3 (Applicable Classification Code)
- 5.2.4 Category 4 (Applicable Classification Code)
- 5.2.5 Category 5 (Applicable Classification Code)
- 5.3 Import Analysis – Segment
- 5.3.1 Category 1 (Applicable Classification Code)
- 5.3.2 Category 2 (Applicable Classification Code)
- 5.3.3 Category 3 (Applicable Classification Code)
- 5.3.4 Category 4 (Applicable Classification Code)
- 5.3.5 Category 5 (Applicable Classification Code)
- 5.4 Cross-Border Pricing & Transaction Benchmarks
- 5.4.1 Export Pricing – Segment & Country
- 5.4.2 Import Pricing – Segment & Source Country
- 5.4.3 Price Trends (2024)
- 5.5 Key Cross-Border Trade & Delivery Routes
- 5.5.1 Cross-Border Trade/Delivery Route 1
- 5.5.2 Cross-Border Trade/Delivery Route 2
- 5.5.3 Cross-Border Trade/Delivery Route 3
- 5.5.4 Cross-Border Trade/Delivery Route 4
- 5.5.5 Cross-Border Trade/Delivery Route 5
- 5.6 Trade Policy & Market Access Impact Assessment
- 5.6.1 Tariff & Non-Tariff Barriers
- 5.6.2 Regional Trade & Economic Integration Frameworks
- 5.6.3 Bilateral & Multilateral Trade Agreements
- 5.6.4 Cross-Border Operating, Licensing & Localization Requirements
Note: This chapter applies where cross-border trade or delivery is relevant to Port Equipment. Goods, services, and digital offerings are assessed using applicable classifications and transaction measures. Import-export volumes, trade balances, and route analyses are included only where meaningful to the market.
Chapter 6. Competitive Landscape & Company Benchmarking
- 6.1 Port Equipment Market Concentration & Structure
- 6.1.1 Herfindahl-Hirschman Index (HHI) – vs. 2024
- 6.1.2 Leading, Mid-Sized & Emerging Player Structure
- 6.1.3 Global, Regional & Local Player Dynamics
- 6.2 Port Equipment Market Share Analysis – 2024
- 6.2.1 Global Revenue Share by Company
- 6.2.2 Global Volume Share by Company (Volume Where Applicable)
- 6.2.3 Regional Revenue Share
- 6.2.4 Market Share Evolution ( vs. 2024)
- 6.2.5 Company Market Share by Key Segment
- 6.2.6 Company Market Share by Customer Group
- 6.3 Operating Scale, Capacity & Infrastructure Analysis
- 6.3.1 Global Operating Scale & Supply Capacity
- 6.3.2 Resource Utilization & Operating Efficiency
- 6.3.3 Output, Service Delivery & Activity Metrics
- 6.3.4 Operating Footprint & Infrastructure Map
- 6.3.5 Planned Operational & Capacity Expansion
- 6.4 Port Equipment Competitive Benchmarking Matrix
- 6.4.1 Revenue, Growth, Profitability & Operating Metric Comparison
- 6.4.2 Channel Revenue Mix
- 6.4.3 Geographic Revenue Exposure
- 6.4.4 R&D Intensity
- 6.4.5 Sustainability Maturity
- 6.5 Strategic Developments in Port Equipment (Last 24 Months)
- 6.5.1 Mergers, Acquisitions & Divestments
- 6.5.2 New Products, Services & Solutions in Port Equipment
- 6.5.3 Operational & Infrastructure Expansions
- 6.5.4 Strategic Alliances, Joint Ventures & Partnerships
- 6.5.5 Distribution Expansion & Market Entry
- 6.5.6 Sustainability & ESG Initiatives
- 6.6 Competitive Strategy Mapping
- 6.6.1 Leader, Challenger, Follower & Niche Classification
- 6.6.2 Pricing Strategy Comparison
- 6.6.3 Channel Strategy Matrix
Note: Strategic developments are included based on their materiality and the availability of reliable information.
Chapter 7. Global Port Equipment Market – By Sales & Delivery Channel
- 7.1 Segment Overview
- 7.1.1 Volume & Revenue Split by Channel (2024 & 2032) (Volume Where Applicable)
- 7.1.2 Channel Mix Evolution (2024-2032)
Chapter 8. Regional Market Analysis – Global Overview
- 8.1 Global Regional Overview
- 8.1.1 Regional Volume Share (Volume Where Applicable)
- 8.1.2 Regional Revenue Share
- 8.1.3 Regional Volume by Region (Volume Where Applicable)
- 8.1.4 Regional Revenue by Region
- 8.1.5 Regional Forecast Through 2032
- 8.2 Cross-Regional Segment Analysis
- 8.2.1 By Sales & Delivery Channel
- 8.2.2 By Competitive Positioning & Price Tier
Chapter 9. North America Port Equipment Market
- 9.1 United States
- 9.2 Canada
- 9.3 Mexico
Chapter 10. Europe Port Equipment Market
- 10.1 Germany
- 10.2 France
- 10.3 Italy
- 10.4 United Kingdom
- 10.5 Spain
- 10.6 Poland
- 10.7 Russia
- 10.8 Netherlands
- 10.9 Belgium
- 10.10 Sweden
- 10.11 Denmark
- 10.12 Norway
- 10.13 Rest of Europe
Chapter 11. Asia Pacific Port Equipment Market
- 11.1 China
- 11.2 India
- 11.3 Japan
- 11.4 South Korea
- 11.5 Thailand
- 11.6 Indonesia
- 11.7 Vietnam
- 11.8 Malaysia
- 11.9 Australia
- 11.10 Rest of Asia Pacific
Chapter 12. Latin America Port Equipment Market
- 12.1 Brazil
- 12.2 Argentina
- 12.3 Colombia
- 12.4 Chile
- 12.5 Rest of Latin America
Chapter 13. Middle East Port Equipment Market
- 13.1 Saudi Arabia
- 13.2 United Arab Emirates
- 13.3 Turkey
- 13.4 Israel
- 13.5 Iran
- 13.6 Rest of the Middle East
Chapter 14. Africa Port Equipment Market
- 14.1 South Africa
- 14.2 Egypt
- 14.3 Nigeria
- 14.4 Morocco
- 14.5 Rest of Africa
Chapter 15. Port Equipment Company Profiles
- 15.1 [Company 01]
- 15.1.1 Company Overview
- 15.1.2 Key Management Personnel
- 15.1.3 Products & Services Portfolio
- 15.1.4 Financial Performance
- 15.1.5 Key Market Focus & Geographic Presence
- 15.1.6 Recent Developments & Strategic Initiatives
Note: The company profile list is preliminary and may change based on research findings, market developments, data availability, and client requirements.
Chapter 16. Appendices
- Appendix A – List of Abbreviations & Acronyms
- Appendix B – Industry Classification Code Reference – Full Series
- Appendix C – Supply, Output & Operating Capacity Data Tables
- Appendix D – End-Use & Demand Base Tables
- Appendix E – Demand, Adoption & Usage Assumptions
- Appendix F – Pricing & Revenue Metric Reference Tables
- Appendix G – Company Operations & Infrastructure Database
- Appendix H – Cross-Border Trade & Activity Data Tables (Where Applicable)
- Appendix I – Regulatory Summary Tables
- Appendix J – Primary Research Participant List (Anonymized)
- Appendix K – Primary Research Questionnaire Framework
- Appendix L – Data Sources & Bibliography
- Appendix M – Market Size Divergence & Source Comparison
Chapter 17. Research Methodology
- 17.1 Research Framework & Philosophy
- 17.2 Secondary Research – Sources, Hierarchy & Data Extraction
- 17.3 Data Modeling – Bottom-Up & Top-Down Market Sizing
- 17.4 Primary Research – Stakeholder Framework, LOI & Sample Sizes
- 17.5 Forecast Methodology – Regression, Scenario & Sensitivity Analysis
- 17.6 Quality Control – Four-Layer Validation Framework
- 17.7 Limitations & Standard Assumptions
- 17.8 Disclaimer
