CHAPTER NO. 1 : INTRODUCTION 20
1.1.1. Report Description 20
Purpose of the Report 20
USP & Key Offerings 20
1.1.2. Key Benefits for Stakeholders 20
1.1.3. Target Audience 21
1.1.4. Report Scope 21
CHAPTER NO. 2 : EXECUTIVE SUMMARY 22
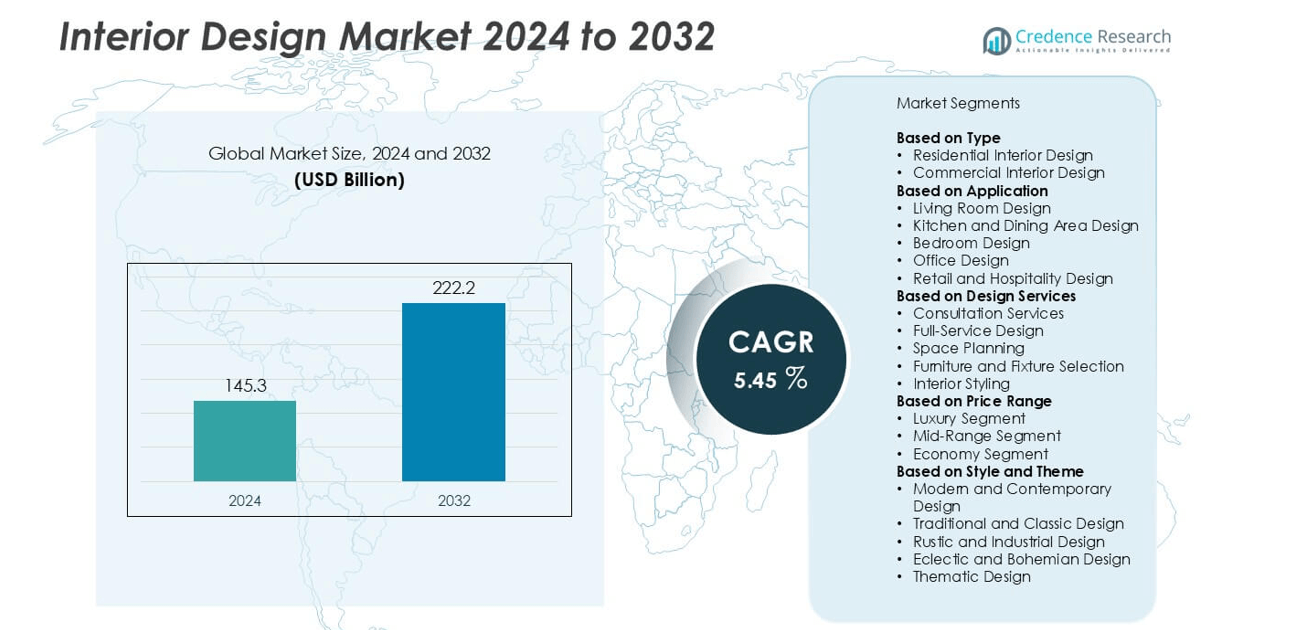
2.1. Interior Design Market Snapshot 22
2.1.1. Global Interior Design Market, 2019 – 2032 (USD Million) 23
CHAPTER NO. 3 : GEOPOLITICAL CRISIS IMPACT ANALYSIS 24
3.1. Russia-Ukraine and Israel-Palestine War Impacts 24
CHAPTER NO. 4 : INTERIOR DESIGN MARKET – INDUSTRY ANALYSIS 25
4.1. Introduction 25
4.2. Market Drivers 26
4.2.1. Driving Factor 1 Analysis 26
4.2.2. Driving Factor 2 Analysis 27
4.3. Market Restraints 28
4.3.1. Restraining Factor Analysis 28
4.4. Market Opportunities 29
4.4.1. Market Opportunity Analysis 29
4.5. Porter’s Five Forces Analysis 30
CHAPTER NO. 5 : ANALYSIS COMPETITIVE LANDSCAPE 31
5.1. Company Market Share Analysis – 2024 31
5.1.1. Global Interior Design Market: Company Market Share, by Volume, 2024 31
5.1.2. Global Interior Design Market: Company Market Share, by Revenue, 2024 32
5.1.3. Global Interior Design Market: Top 6 Company Market Share, by Revenue, 2024 32
5.1.4. Global Interior Design Market: Top 3 Company Market Share, by Revenue, 2024 33
5.2. Global Interior Design Market Company Revenue Market Share, 2024 34
5.3. Company Assessment Metrics, 2024 35
5.3.1. Stars 35
5.3.2. Emerging Leaders 35
5.3.3. Pervasive Players 35
5.3.4. Participants 35
5.4. Start-ups /SMEs Assessment Metrics, 2024 35
5.4.1. Progressive Companies 35
5.4.2. Responsive Companies 35
5.4.3. Dynamic Companies 35
5.4.4. Starting Blocks 35
5.5. Strategic Developments 36
5.5.1. Acquisitions & Mergers 36
New Product Launch 36
Global Expansion 36
5.6. Key Players Product Matrix 37
CHAPTER NO. 6 : PESTEL & ADJACENT MARKET ANALYSIS 38
6.1. PESTEL 38
6.1.1. Political Factors 38
6.1.2. Economic Factors 38
6.1.3. Social Factors 38
6.1.4. Technological Factors 38
6.1.5. Environmental Factors 38
6.1.6. Legal Factors 38
6.2. Adjacent Market Analysis 38
CHAPTER NO. 7 : INTERIOR DESIGN MARKET – BY TYPE SEGMENT ANALYSIS 39
7.1. Interior Design Market Overview, by Type Segment 39
7.1.1. Interior Design Market Revenue Share, By Type, 2024 & 2032 40
7.1.2. Interior Design Market Attractiveness Analysis, By Type 41
7.1.3. Incremental Revenue Growth Opportunity, by Type, 2024 – 2032 41
7.1.4. Interior Design Market Revenue, By Type, 2019, 2024, 2027 & 2032 42
7.2. Residential 43
7.3. Commercial 44
7.4. Others 45
CHAPTER NO. 8 : INTERIOR DESIGN MARKET – BY APPLICATION SEGMENT ANALYSIS 46
8.1. Interior Design Market Overview, by Application Segment 46
8.1.1. Interior Design Market Revenue Share, By Application, 2024 & 2032 47
8.1.2. Interior Design Market Attractiveness Analysis, By Application 48
8.1.3. Incremental Revenue Growth Opportunity, by Application, 2024 – 2032 48
8.1.4. Interior Design Market Revenue, By Application, 2019, 2024, 2027 & 2032 49
8.2. Newly decorated 50
8.3. Repeated decorated 51
CHAPTER NO. 9 : INTERIOR DESIGN MARKET – BY DESIGN SERVICES SEGMENT ANALYSIS 52
9.1. Interior Design Market Overview, by Design Services Segment 52
9.1.1. Interior Design Market Revenue Share, By Design Services, 2024 & 2032 53
9.1.2. Interior Design Market Attractiveness Analysis, By Design Services 54
9.1.3. Incremental Revenue Growth Opportunity, by Design Services, 2024 – 2032 54
9.1.4. Interior Design Market Revenue, By Design Services, 2019, 2024, 2027 & 2032 55
9.2. Full Service Interior Design 56
9.3. Consultant and Advice 57
9.4. Staging Services 58
CHAPTER NO. 10 : INTERIOR DESIGN MARKET – BY PRICE RANGE SEGMENT ANALYSIS 59
10.1. Interior Design Market Overview, by Price Range Segment 59
10.1.1. Interior Design Market Revenue Share, By Price Range, 2024 & 2032 60
10.1.2. Interior Design Market Attractiveness Analysis, By Price Range 61
10.1.3. Incremental Revenue Growth Opportunity, by Price Range, 2024 – 2032 61
10.1.4. Interior Design Market Revenue, By Price Range, 2019, 2024, 2027 & 2032 62
10.2. Affordable Interior Design 63
10.3. Mid Range Interior Design 64
10.4. Premium Interior Design 65
CHAPTER NO. 11 : INTERIOR DESIGN MARKET – BY STYLE AND THEME SEGMENT ANALYSIS 66
11.1. Interior Design Market Overview, by Style and Theme Segment 66
11.1.1. Interior Design Market Revenue Share, By Style and Theme, 2024 & 2032 67
11.1.2. Interior Design Market Attractiveness Analysis, By Style and Theme 68
11.1.3. Incremental Revenue Growth Opportunity, by Style and Theme, 2024 – 2032 68
11.1.4. Interior Design Market Revenue, By Style and Theme, 2019, 2024, 2027 & 2032 69
11.2. Modern and Contempary Design 70
11.3. Traditional Design 71
11.4. Transitional Design 72
11.5. Industrial Design 73
11.6. Others 74
CHAPTER NO. 12 : INTERIOR DESIGN MARKET – GLOBAL ANALYSIS 75
12.1. Type 75
12.1.1. Global Interior Design Market Revenue, By Type, 2019 – 2024 (USD Million) 75
12.2. Global Interior Design Market Revenue, By Type, 2024 – 2032 (USD Million) 75
12.3. Application 76
12.3.1. Global Interior Design Market Revenue, By Application, 2019 – 2024 (USD Million) 76
12.3.2. Global Interior Design Market Revenue, By Application, 2024 – 2032 (USD Million) 76
12.4. Design Services 77
12.4.1. Global Interior Design Market Revenue, By Design Services, 2019 – 2024 (USD Million) 77
12.4.2. Global Interior Design Market Revenue, By Design Services, 2024 – 2032 (USD Million) 77
12.5. Price Range 78
12.5.1. Global Interior Design Market Revenue, By Price Range, 2019 – 2024 (USD Million) 78
12.5.2. Global Interior Design Market Revenue, By Price Range, 2024 – 2032 (USD Million) 78
12.6. Style and Theme 79
12.6.1. Global Interior Design Market Revenue, By Style and Theme, 2019 – 2024 (USD Million) 79
12.6.2. Global Interior Design Market Revenue, By Style and Theme, 2024 – 2032 (USD Million) 79
CHAPTER NO. 13 : INTERIOR DESIGN MARKET – NORTH AMERICA 80
13.1. North America 80
13.1.1. Key Highlights 80
13.1.2. North America Interior Design Market Revenue, By Country, 2019 – 2024 (USD Million) 81
13.1.3. North America Interior Design Market Revenue, By Type, 2019 – 2024 (USD Million) 82
13.1.4. North America Interior Design Market Revenue, By Application, 2019 – 2024 (USD Million) 83
13.1.5. North America Interior Design Market Revenue, By Design Services, 2019 – 2024 (USD Million) 84
13.1.6. North America Interior Design Market Revenue, By Price Range, 2019 – 2024 (USD Million) 85
13.1.7. North America Interior Design Market Revenue, By Style and Theme, 2019 – 2024 (USD Million) 86
13.2. U.S. 87
13.3. Canada 87
13.4. Mexico 87
CHAPTER NO. 14 : INTERIOR DESIGN MARKET – EUROPE 88
14.1. Europe 88
14.1.1. Key Highlights 88
14.1.2. Europe Interior Design Market Revenue, By Country, 2019 – 2024 (USD Million) 89
14.1.3. Europe Interior Design Market Revenue, By Type, 2019 – 2024 (USD Million) 90
14.1.4. Europe Interior Design Market Revenue, By Application, 2019 – 2024 (USD Million) 91
14.1.5. Europe Interior Design Market Revenue, By Design Services, 2019 – 2024 (USD Million) 92
14.1.6. Europe Interior Design Market Revenue, By Price Range, 2019 – 2024 (USD Million) 93
14.1.7. Europe Interior Design Market Revenue, By Style and Theme, 2019 – 2024 (USD Million) 94
14.2. UK 95
14.3. France 95
14.4. Germany 95
14.5. Italy 95
14.6. Spain 95
14.7. Russia 95
14.8. Belgium 95
14.9. Netherland 95
14.10. Austria 95
14.11. Sweden 95
14.12. Poland 95
14.13. Denmark 95
14.14. Switzerland 95
14.15. Rest of Europe 95
CHAPTER NO. 15 : INTERIOR DESIGN MARKET – ASIA PACIFIC 96
15.1. Asia Pacific 96
15.1.1. Key Highlights 96
15.1.2. Asia Pacific Interior Design Market Revenue, By Country, 2019 – 2024 (USD Million) 97
15.1.3. Asia Pacific Interior Design Market Revenue, By Type, 2019 – 2024 (USD Million) 98
15.1.4. Asia Pacific Interior Design Market Revenue, By Application, 2019 – 2024 (USD Million) 99
15.1.5. Asia Pacific Interior Design Market Revenue, By Design Services, 2019 – 2024 (USD Million) 100
15.1.6. Asia Pacific Interior Design Market Revenue, By Price Range, 2019 – 2024 (USD Million) 101
15.1.7. Asia Pacific Interior Design Market Revenue, By Style and Theme, 2019 – 2024 (USD Million) 102
15.2. China 103
15.3. Japan 103
15.4. South Korea 103
15.5. India 103
15.6. Australia 103
15.7. Thailand 103
15.8. Indonesia 103
15.9. Vietnam 103
15.10. Malaysia 103
15.11. Philippines 103
15.12. Taiwan 103
15.13. Rest of Asia Pacific 103
CHAPTER NO. 16 : INTERIOR DESIGN MARKET – LATIN AMERICA 104
16.1. Latin America 104
16.1.1. Key Highlights 104
16.1.2. Latin America Interior Design Market Revenue, By Country, 2019 – 2024 (USD Million) 105
16.1.3. Latin America Interior Design Market Revenue, By Type, 2019 – 2024 (USD Million) 106
16.1.4. Latin America Interior Design Market Revenue, By Application, 2019 – 2024 (USD Million) 107
16.1.5. Latin America Interior Design Market Revenue, By Design Services, 2019 – 2024 (USD Million) 108
16.1.6. Latin America Interior Design Market Revenue, By Price Range, 2019 – 2024 (USD Million) 109
16.1.7. Latin America Interior Design Market Revenue, By Style and Theme, 2019 – 2024 (USD Million) 110
16.2. Brazil 111
16.3. Argentina 111
16.4. Peru 111
16.5. Chile 111
16.6. Colombia 111
16.7. Rest of Latin America 111
CHAPTER NO. 17 : INTERIOR DESIGN MARKET – MIDDLE EAST 112
17.1. Middle East 112
17.1.1. Key Highlights 112
17.1.2. Middle East Interior Design Market Revenue, By Country, 2019 – 2024 (USD Million) 113
17.1.3. Middle East Interior Design Market Revenue, By Type, 2019 – 2024 (USD Million) 114
17.1.4. Middle East Interior Design Market Revenue, By Application, 2019 – 2024 (USD Million) 115
17.1.5. Middle East Interior Design Market Revenue, By Design Services, 2019 – 2024 (USD Million) 116
17.1.6. Middle East Interior Design Market Revenue, By Price Range, 2019 – 2024 (USD Million) 117
17.1.7. Middle East Interior Design Market Revenue, By Style and Theme, 2019 – 2024 (USD Million) 118
17.2. UAE 119
17.3. KSA 119
17.4. Israel 119
17.5. Turkey 119
17.6. Iran 119
17.7. Rest of Middle East 119
CHAPTER NO. 18 : INTERIOR DESIGN MARKET – AFRICA 120
18.1. Africa 120
18.1.1. Key Highlights 120
18.1.2. Africa Interior Design Market Revenue, By Country, 2019 – 2024 (USD Million) 121
18.1.3. Africa Interior Design Market Revenue, By Type, 2019 – 2024 (USD Million) 122
18.1.4. Africa Interior Design Market Revenue, By Application, 2019 – 2024 (USD Million) 123
18.1.5. Africa Interior Design Market Revenue, By Design Services, 2019 – 2024 (USD Million) 124
18.1.6. Africa Interior Design Market Revenue, By Price Range, 2019 – 2024 (USD Million) 125
18.1.7. Africa Interior Design Market Revenue, By Style and Theme, 2019 – 2024 (USD Million) 126
18.2. Egypt 127
18.3. Nigeria 127
18.4. Algeria 127
18.5. Morocco 127
18.6. Rest of Africa 127
CHAPTER NO. 19 : COMPANY PROFILES 128
19.1. Aamir & Hameeda 128
19.1.1. Company Overview 128
19.1.2. Product Portfolio 128
19.1.3. Swot Analysis 128
19.1.4. Business Strategy 129
19.1.5. Financial Overview 129
19.2. Livspace 130
19.3. Sobha Interiors 130
19.4. Acme Interiors 130
19.5. Ace Interiors 130
19.6. Lipika Sud Interiors Pvt. Ltd 130
19.7. Chaukor Studio 130
19.8. Futomic Design Services Pvt. Ltd 130
19.9. Bonito Designs 130
19.10. Carafina Interior Designers 130
CHAPTER NO. 20 : RESEARCH METHODOLOGY 131
20.1. Research Methodology 131
20.1.1. Phase I – Secondary Research 132
20.1.2. Phase II – Data Modeling 132
Company Share Analysis Model 133
Revenue Based Modeling 133
20.1.3. Phase III – Primary Research 134
20.1.4. Research Limitations 135
Assumptions 135
List of Figures
FIG NO. 1. Global Interior Design Market Revenue, 2019 – 2032 (USD Million) 23
FIG NO. 2. Porter’s Five Forces Analysis for Global Interior Design Market 30
FIG NO. 3. Company Share Analysis, 2024 31
FIG NO. 4. Company Share Analysis, 2024 32
FIG NO. 5. Company Share Analysis, 2024 32
FIG NO. 6. Company Share Analysis, 2024 33
FIG NO. 7. Interior Design Market – Company Revenue Market Share, 2024 34
FIG NO. 8. Interior Design Market Revenue Share, By Type, 2024 & 2032 40
FIG NO. 9. Market Attractiveness Analysis, By Type 41
FIG NO. 10. Incremental Revenue Growth Opportunity by Type, 2024 – 2032 41
FIG NO. 11. Interior Design Market Revenue, By Type, 2019, 2024, 2027 & 2032 42
FIG NO. 12. Global Interior Design Market for Residential, Revenue (USD Million) 2019 – 2032 43
FIG NO. 13. Global Interior Design Market for Commercial, Revenue (USD Million) 2019 – 2032 44
FIG NO. 14. Global Interior Design Market for Others, Revenue (USD Million) 2019 – 2032 45
FIG NO. 15. Interior Design Market Revenue Share, By Application, 2024 & 2032 47
FIG NO. 16. Market Attractiveness Analysis, By Application 48
FIG NO. 17. Incremental Revenue Growth Opportunity by Application, 2024 – 2032 48
FIG NO. 18. Interior Design Market Revenue, By Application, 2019, 2024, 2027 & 2032 49
FIG NO. 19. Global Interior Design Market for Newly decorated, Revenue (USD Million) 2019 – 2032 50
FIG NO. 20. Global Interior Design Market for Repeated decorated, Revenue (USD Million) 2019 – 2032 51
FIG NO. 21. Interior Design Market Revenue Share, By Design Services, 2024 & 2032 53
FIG NO. 22. Market Attractiveness Analysis, By Design Services 54
FIG NO. 23. Incremental Revenue Growth Opportunity by Design Services, 2024 – 2032 54
FIG NO. 24. Interior Design Market Revenue, By Design Services, 2019, 2024, 2027 & 2032 55
FIG NO. 25. Global Interior Design Market for Full Service Interior Design, Revenue (USD Million) 2019 – 2032 56
FIG NO. 26. Global Interior Design Market for Consultant and Advice, Revenue (USD Million) 2019 – 2032 57
FIG NO. 27. Global Interior Design Market for Staging Services, Revenue (USD Million) 2019 – 2032 58
FIG NO. 28. Interior Design Market Revenue Share, By Price Range, 2024 & 2032 60
FIG NO. 29. Market Attractiveness Analysis, By Price Range 61
FIG NO. 30. Incremental Revenue Growth Opportunity by Price Range, 2024 – 2032 61
FIG NO. 31. Interior Design Market Revenue, By Price Range, 2019, 2024, 2027 & 2032 62
FIG NO. 32. Global Interior Design Market for Affordable Interior Design, Revenue (USD Million) 2019 – 2032 63
FIG NO. 33. Global Interior Design Market for Mid Range Interior Design, Revenue (USD Million) 2019 – 2032 64
FIG NO. 34. Global Interior Design Market for Premium Interior Design, Revenue (USD Million) 2019 – 2032 65
FIG NO. 35. Interior Design Market Revenue Share, By Style and Theme, 2024 & 2032 67
FIG NO. 36. Market Attractiveness Analysis, By Style and Theme 68
FIG NO. 37. Incremental Revenue Growth Opportunity by Style and Theme, 2024 – 2032 68
FIG NO. 38. Interior Design Market Revenue, By Style and Theme, 2019, 2024, 2027 & 2032 69
FIG NO. 39. Global Interior Design Market for Modern and Contempary Design, Revenue (USD Million) 2019 – 2032 70
FIG NO. 40. Global Interior Design Market for Traditional Design, Revenue (USD Million) 2019 – 2032 71
FIG NO. 41. Global Interior Design Market for Transitional Design, Revenue (USD Million) 2019 – 2032 72
FIG NO. 42. Global Interior Design Market for Industrial Design, Revenue (USD Million) 2019 – 2032 73
FIG NO. 43. Global Interior Design Market for Others, Revenue (USD Million) 2019 – 2032 74
FIG NO. 44. North America Interior Design Market Revenue, 2019 – 2032 (USD Million) 80
FIG NO. 45. Europe Interior Design Market Revenue, 2019 – 2032 (USD Million) 88
FIG NO. 46. Asia Pacific Interior Design Market Revenue, 2019 – 2032 (USD Million) 96
FIG NO. 47. Latin America Interior Design Market Revenue, 2019 – 2032 (USD Million) 104
FIG NO. 48. Middle East Interior Design Market Revenue, 2019 – 2032 (USD Million) 112
FIG NO. 49. Africa Interior Design Market Revenue, 2019 – 2032 (USD Million) 120
FIG NO. 50. Research Methodology – Detailed View 131
FIG NO. 51. Research Methodology 132
List of Tables
TABLE NO. 1. : Global Interior Design Market: Snapshot 22
TABLE NO. 2. : Drivers for the Interior Design Market: Impact Analysis 26
TABLE NO. 3. : Restraints for the Interior Design Market: Impact Analysis 28
TABLE NO. 4. : Global Interior Design Market Revenue, By Type, 2019 – 2024 (USD Million) 75
TABLE NO. 5. : Global Interior Design Market Revenue, By Type, 2024 – 2032 (USD Million) 75
TABLE NO. 6. : Global Interior Design Market Revenue, By Application, 2019 – 2024 (USD Million) 76
TABLE NO. 7. : Global Interior Design Market Revenue, By Application, 2024 – 2032 (USD Million) 76
TABLE NO. 8. : Global Interior Design Market Revenue, By Design Services, 2019 – 2024 (USD Million) 77
TABLE NO. 9. : Global Interior Design Market Revenue, By Design Services, 2024 – 2032 (USD Million) 77
TABLE NO. 10. : Global Interior Design Market Revenue, By Price Range, 2019 – 2024 (USD Million) 78
TABLE NO. 11. : Global Interior Design Market Revenue, By Price Range, 2024 – 2032 (USD Million) 78
TABLE NO. 12. : Global Interior Design Market Revenue, By Style and Theme, 2019 – 2024 (USD Million) 79
TABLE NO. 13. : Global Interior Design Market Revenue, By Style and Theme, 2024 – 2032 (USD Million) 79
TABLE NO. 14. : North America Interior Design Market Revenue, By Country, 2019 – 2024 (USD Million) 81
TABLE NO. 15. : North America Interior Design Market Revenue, By Country, 2024 – 2032 (USD Million) 81
TABLE NO. 16. : North America Interior Design Market Revenue, By Type, 2019 – 2024 (USD Million) 82
TABLE NO. 17. : North America Interior Design Market Revenue, By Type, 2024 – 2032 (USD Million) 82
TABLE NO. 18. : North America Interior Design Market Revenue, By Application, 2019 – 2024 (USD Million) 83
TABLE NO. 19. : North America Interior Design Market Revenue, By Application, 2024 – 2032 (USD Million) 83
TABLE NO. 20. : North America Interior Design Market Revenue, By Design Services, 2019 – 2024 (USD Million) 84
TABLE NO. 21. : North America Interior Design Market Revenue, By Design Services, 2024 – 2032 (USD Million) 84
TABLE NO. 22. : North America Interior Design Market Revenue, By Price Range, 2019 – 2024 (USD Million) 85
TABLE NO. 23. : North America Interior Design Market Revenue, By Price Range, 2024 – 2032 (USD Million) 85
TABLE NO. 24. : North America Interior Design Market Revenue, By Style and Theme, 2019 – 2024 (USD Million) 86
TABLE NO. 25. : North America Interior Design Market Revenue, By Style and Theme, 2024 – 2032 (USD Million) 86
TABLE NO. 26. : Europe Interior Design Market Revenue, By Country, 2019 – 2024 (USD Million) 89
TABLE NO. 27. : Europe Interior Design Market Revenue, By Country, 2024 – 2032 (USD Million) 89
TABLE NO. 28. : Europe Interior Design Market Revenue, By Type, 2019 – 2024 (USD Million) 90
TABLE NO. 29. : Europe Interior Design Market Revenue, By Type, 2024 – 2032 (USD Million) 90
TABLE NO. 30. : Europe Interior Design Market Revenue, By Application, 2019 – 2024 (USD Million) 91
TABLE NO. 31. : Europe Interior Design Market Revenue, By Application, 2024 – 2032 (USD Million) 91
TABLE NO. 32. : Europe Interior Design Market Revenue, By Design Services, 2019 – 2024 (USD Million) 92
TABLE NO. 33. : Europe Interior Design Market Revenue, By Design Services, 2024 – 2032 (USD Million) 92
TABLE NO. 34. : Europe Interior Design Market Revenue, By Price Range, 2019 – 2024 (USD Million) 93
TABLE NO. 35. : Europe Interior Design Market Revenue, By Price Range, 2024 – 2032 (USD Million) 93
TABLE NO. 36. : Europe Interior Design Market Revenue, By Style and Theme, 2019 – 2024 (USD Million) 94
TABLE NO. 37. : Europe Interior Design Market Revenue, By Style and Theme, 2024 – 2032 (USD Million) 94
TABLE NO. 38. : Asia Pacific Interior Design Market Revenue, By Country, 2019 – 2024 (USD Million) 97
TABLE NO. 39. : Asia Pacific Interior Design Market Revenue, By Country, 2024 – 2032 (USD Million) 97
TABLE NO. 40. : Asia Pacific Interior Design Market Revenue, By Type, 2019 – 2024 (USD Million) 98
TABLE NO. 41. : Asia Pacific Interior Design Market Revenue, By Type, 2024 – 2032 (USD Million) 98
TABLE NO. 42. : Asia Pacific Interior Design Market Revenue, By Application, 2019 – 2024 (USD Million) 99
TABLE NO. 43. : Asia Pacific Interior Design Market Revenue, By Application, 2024 – 2032 (USD Million) 99
TABLE NO. 44. : Asia Pacific Interior Design Market Revenue, By Design Services, 2019 – 2024 (USD Million) 100
TABLE NO. 45. : Asia Pacific Interior Design Market Revenue, By Design Services, 2024 – 2032 (USD Million) 100
TABLE NO. 46. : Asia Pacific Interior Design Market Revenue, By Price Range, 2019 – 2024 (USD Million) 101
TABLE NO. 47. : Asia Pacific Interior Design Market Revenue, By Price Range, 2024 – 2032 (USD Million) 101
TABLE NO. 48. : Asia Pacific Interior Design Market Revenue, By Style and Theme, 2019 – 2024 (USD Million) 102
TABLE NO. 49. : Asia Pacific Interior Design Market Revenue, By Style and Theme, 2024 – 2032 (USD Million) 102
TABLE NO. 50. : Latin America Interior Design Market Revenue, By Country, 2019 – 2024 (USD Million) 105
TABLE NO. 51. : Latin America Interior Design Market Revenue, By Country, 2024 – 2032 (USD Million) 105
TABLE NO. 52. : Latin America Interior Design Market Revenue, By Type, 2019 – 2024 (USD Million) 106
TABLE NO. 53. : Latin America Interior Design Market Revenue, By Type, 2024 – 2032 (USD Million) 106
TABLE NO. 54. : Latin America Interior Design Market Revenue, By Application, 2019 – 2024 (USD Million) 107
TABLE NO. 55. : Latin America Interior Design Market Revenue, By Application, 2024 – 2032 (USD Million) 107
TABLE NO. 56. : Latin America Interior Design Market Revenue, By Design Services, 2019 – 2024 (USD Million) 108
TABLE NO. 57. : Latin America Interior Design Market Revenue, By Design Services, 2024 – 2032 (USD Million) 108
TABLE NO. 58. : Latin America Interior Design Market Revenue, By Price Range, 2019 – 2024 (USD Million) 109
TABLE NO. 59. : Latin America Interior Design Market Revenue, By Price Range, 2024 – 2032 (USD Million) 109
TABLE NO. 60. : Latin America Interior Design Market Revenue, By Style and Theme, 2019 – 2024 (USD Million) 110
TABLE NO. 61. : Latin America Interior Design Market Revenue, By Style and Theme, 2024 – 2032 (USD Million) 110
TABLE NO. 62. : Middle East Interior Design Market Revenue, By Country, 2019 – 2024 (USD Million) 113
TABLE NO. 63. : Middle East Interior Design Market Revenue, By Country, 2024 – 2032 (USD Million) 113
TABLE NO. 64. : Middle East Interior Design Market Revenue, By Type, 2019 – 2024 (USD Million) 114
TABLE NO. 65. : Middle East Interior Design Market Revenue, By Type, 2024 – 2032 (USD Million) 114
TABLE NO. 66. : Middle East Interior Design Market Revenue, By Application, 2019 – 2024 (USD Million) 115
TABLE NO. 67. : Middle East Interior Design Market Revenue, By Application, 2024 – 2032 (USD Million) 115
TABLE NO. 68. : Middle East Interior Design Market Revenue, By Design Services, 2019 – 2024 (USD Million) 116
TABLE NO. 69. : Middle East Interior Design Market Revenue, By Design Services, 2024 – 2032 (USD Million) 116
TABLE NO. 70. : Middle East Interior Design Market Revenue, By Price Range, 2019 – 2024 (USD Million) 117
TABLE NO. 71. : Middle East Interior Design Market Revenue, By Price Range, 2024 – 2032 (USD Million) 117
TABLE NO. 72. : Middle East Interior Design Market Revenue, By Style and Theme, 2019 – 2024 (USD Million) 118
TABLE NO. 73. : Middle East Interior Design Market Revenue, By Style and Theme, 2024 – 2032 (USD Million) 118
TABLE NO. 74. : Africa Interior Design Market Revenue, By Country, 2019 – 2024 (USD Million) 121
TABLE NO. 75. : Africa Interior Design Market Revenue, By Country, 2024 – 2032 (USD Million) 121
TABLE NO. 76. : Africa Interior Design Market Revenue, By Type, 2019 – 2024 (USD Million) 122
TABLE NO. 77. : Africa Interior Design Market Revenue, By Type, 2024 – 2032 (USD Million) 122
TABLE NO. 78. : Africa Interior Design Market Revenue, By Application, 2019 – 2024 (USD Million) 123
TABLE NO. 79. : Africa Interior Design Market Revenue, By Application, 2024 – 2032 (USD Million) 123
TABLE NO. 80. : Africa Interior Design Market Revenue, By Design Services, 2019 – 2024 (USD Million) 124
TABLE NO. 81. : Africa Interior Design Market Revenue, By Design Services, 2024 – 2032 (USD Million) 124
TABLE NO. 82. : Africa Interior Design Market Revenue, By Price Range, 2019 – 2024 (USD Million) 125
TABLE NO. 83. : Africa Interior Design Market Revenue, By Price Range, 2024 – 2032 (USD Million) 125
TABLE NO. 84. : Africa Interior Design Market Revenue, By Style and Theme, 2019 – 2024 (USD Million) 126
TABLE NO. 85. : Africa Interior Design Market Revenue, By Style and Theme, 2024 – 2032 (USD Million) 126