| REPORT ATTRIBUTE |
DETAILS |
| Historical Period |
2020-2023 |
| Base Year |
2024 |
| Forecast Period |
2025-2032 |
| U.S. Tire Market Size 2024 |
USD 86,804.50 million |
| U.S. Tire Market, CAGR |
4.42% |
| U.S. Tire Market Size 2032 |
USD 1,22,709.25 million |
Market Overview
U.S. Tire market size was valued at USD 86,804.50 million in 2024 and is anticipated to reach USD 1,22,709.25 million by 2032, at a CAGR of 4.42% during the forecast period (2024-2032).
The U.S. tire market is experiencing steady growth driven by the expanding vehicle parc, increasing demand for replacement tires, and advancements in tire technology focused on fuel efficiency and durability. The rise in electric vehicle (EV) adoption has further spurred demand for specialized tires designed to support heavier loads and deliver low rolling resistance. Additionally, heightened consumer awareness regarding vehicle safety and performance is prompting more frequent tire inspections and replacements. Trends such as the growing popularity of all-season and run-flat tires, along with the integration of smart tire technologies, are reshaping consumer preferences. Moreover, sustainability initiatives by manufacturers—such as using eco-friendly materials and improving recycling practices—are aligning with regulatory mandates and environmental consciousness. The flourishing e-commerce sector also contributes to market expansion by offering consumers easier access to a wide range of tire brands and types, thereby enhancing product availability and competitive pricing across both urban and rural regions.
The U.S. tire market demonstrates diverse regional demand dynamics, with significant activity across the Western, Midwestern, Southern, and Northeastern regions. Each region presents unique preferences influenced by vehicle ownership trends, climate conditions, and transportation infrastructure. For instance, Southern and Western states experience high demand for passenger and light truck tires due to warm climates and long driving distances, while the Midwest and Northeast emphasize winter and heavy-duty tires. Key players shaping the competitive landscape include Goodyear Tire & Rubber Company, Cooper Tire & Rubber Company, Carlisle Companies Inc., Titan International, and Greenball Corporation. These companies are actively expanding their product lines and investing in technology to meet rising consumer expectations for durability, fuel efficiency, and performance. Partnerships with automakers and innovations in smart tire technologies are further enabling these brands to strengthen their market presence and respond to shifting demands across different regions. Their strategic focus on sustainability and aftermarket services continues to drive competitive growth.
Access crucial information at unmatched prices!
Request your sample report today & start making informed decisions powered by Credence Research Inc.!
Download Sample
Market Insights
- The U.S. tire market was valued at USD 86,804.50 million in 2024 and is expected to reach USD 1,22,709.25 million by 2032, growing at a CAGR of 4.42% during the forecast period (2024-2032).
- The global tire market was valued at USD 3,29,521.50 million in 2024 and is projected to reach USD 4,62,900.23 million by 2032, growing at a CAGR of 4.34% during the forecast period.
- Growing demand for all-season and high-performance tires, particularly for electric and hybrid vehicles, is driving market growth.
- Rising adoption of smart tire technologies, such as embedded sensors for real-time monitoring, is gaining traction across commercial fleets and consumer segments.
- Increasing focus on sustainability, with manufacturers exploring eco-friendly materials and energy-efficient production processes, is becoming a key trend.
- Strong competition from major players like Goodyear, Cooper Tire, and Titan International continues to shape the market, with companies emphasizing innovation and product differentiation.
- Supply chain disruptions and volatility in raw material prices remain major market restraints.
- The Southern and Western U.S. regions account for the largest share, driven by high vehicle ownership and strong commercial activity.
Report Scope
This report segments the U.S. Tire Market as follows:
Market Drivers
Expanding Vehicle Parc and Increasing Vehicle Miles Driven
One of the primary drivers of the U.S. tire market is the continuous growth in the number of vehicles on the road, commonly referred to as the expanding vehicle parc. As the U.S. economy remains relatively stable, consumer purchasing power supports strong vehicle ownership rates across both passenger and commercial segments. For instance, the U.S. tire market is experiencing robust momentum due to a surge in vehicle ownership and expansion of cross-border transport operations. Moreover, the average vehicle age in the country continues to rise, leading to more frequent maintenance and replacement requirements, especially for consumables like tires. Increased vehicle usage translates into higher vehicle miles traveled annually, which directly impacts tire wear and replacement cycles. As a result, demand for both original equipment (OE) and replacement tires continues to rise, offering consistent revenue opportunities for tire manufacturers and retailers alike.
Growth in Electric Vehicle Adoption and Technological Advancements
The rapid adoption of electric vehicles (EVs) across the U.S. is another significant market driver. EVs require specialized tires that support heavier battery loads, offer low rolling resistance, and provide enhanced traction to accommodate instant torque delivery. This shift is prompting tire manufacturers to invest in the development of advanced tire technologies tailored specifically to EVs. Furthermore, ongoing innovations such as run-flat tires, self-sealing tires, and smart tires with embedded sensors are becoming increasingly popular among consumers and fleet operators. These technologies improve vehicle safety, reduce downtime, and enhance fuel efficiency, all of which are critical purchasing considerations in both personal and commercial transportation sectors. As technological integration within vehicles grows, the demand for next-generation tires is expected to follow suit.
Rising Focus on Safety, Performance, and Consumer Awareness
Consumer awareness regarding road safety, tire performance, and fuel efficiency is growing steadily across the U.S., serving as a key driver for tire replacements and upgrades. Modern consumers are increasingly educated about tire-related aspects such as tread depth, inflation pressure, and seasonal suitability. For instance, the increasing demand for fuel-efficient and sustainable tires has prompted manufacturers to invest in research and development for eco-friendly materials and manufacturing processes. As a result, they are more inclined to invest in high-quality tires that enhance driving comfort, braking performance, and overall safety. Government regulations and campaigns emphasizing vehicle safety and emissions control have also played a role in boosting tire inspection rates and compliance with replacement guidelines. This heightened focus on safety standards has fostered demand for premium and all-weather tires that provide superior handling across various road and weather conditions.
E-Commerce Expansion and Wider Product Accessibility
The rapid growth of the e-commerce industry in the U.S. has significantly improved tire availability and accessibility, especially in remote and rural areas. Online tire sales platforms allow consumers to easily compare prices, read product reviews, and select from a wide variety of brands and models, thereby enhancing the overall buying experience. Additionally, several online retailers offer installation services through partner garages or mobile setups, making tire purchasing more convenient than ever before. This omnichannel retail approach has expanded the customer base for both domestic and international tire manufacturers. The improved distribution network, coupled with competitive pricing strategies and promotional campaigns, has further fueled consumer interest, contributing positively to the market’s expansion trajectory.
Market Trends
Sustainability and Eco-Friendly Manufacturing Practices
Sustainability is becoming a central focus in the U.S. tire industry as manufacturers align with regulatory standards and consumer demand for environmentally responsible products. Companies are increasingly investing in the development of tires made from sustainable materials such as recycled rubber, soybean oil, and silica derived from rice husk ash. For instance, the U.S. Tire Manufacturers Association (USTMA) reported strong progress in reducing CO2 emissions and advancing sustainability efforts in tire production. In addition, energy-efficient manufacturing processes and extended tire lifespans are being prioritized to reduce the environmental impact of production and waste. Retreaded tires are also gaining traction in commercial fleets due to their cost-effectiveness and lower carbon footprint. These eco-conscious innovations not only support environmental goals but also serve as a market differentiator for tire brands committed to sustainability.
Shift Toward All-Season and High-Performance Tires
A notable trend shaping the U.S. tire market is the growing consumer preference for all-season and high-performance tires. With increasingly unpredictable weather patterns and the desire for convenience, many vehicle owners are opting for tires that deliver reliable performance across varying conditions, including wet, dry, and lightly snowy roads. All-season tires reduce the need for seasonal changeovers, making them more cost-effective and user-friendly. Meanwhile, high-performance tires are gaining popularity among driving enthusiasts and luxury vehicle owners for their superior handling, cornering ability, and enhanced safety features. This trend is prompting manufacturers to expand their product portfolios to cater to different vehicle types and driving needs while maintaining a focus on durability and fuel efficiency.
Increasing Integration of Smart Tire Technology
Smart tire technology is gradually transforming the U.S. tire market, particularly in the commercial and fleet segments. These advanced tires are embedded with sensors that monitor critical parameters such as tire pressure, temperature, tread wear, and road conditions in real-time. The integration of these features allows fleet operators to minimize downtime, optimize fuel consumption, and ensure safety compliance, leading to more efficient fleet management. For instance, connected vehicles are becoming more common, leading to a growing trend toward intelligent tire technologies with embedded sensors to monitor real-time performance parameters. In the consumer market, connected vehicles and mobile applications are enabling users to track tire health and receive alerts, improving maintenance schedules and reducing the risk of tire-related accidents. As vehicle connectivity and automation grow, the demand for intelligent tire systems is expected to rise substantially.
Growth of Online Tire Sales and Mobile Installation Services
The rise of digital retail platforms has significantly altered how U.S. consumers purchase tires. Online tire sales are growing steadily, offering buyers the convenience of browsing a wide selection, comparing prices, and reading product reviews from the comfort of their homes. Furthermore, mobile tire installation services are becoming increasingly popular, especially in urban areas, as they provide time-saving solutions by offering on-site fitting at homes or workplaces. This seamless integration of e-commerce and service delivery is enhancing customer satisfaction and loyalty, driving a shift in the retail landscape of the tire industry and enabling manufacturers and distributors to reach broader markets more effectively.
Market Challenges Analysis
Volatile Raw Material Costs and Supply Chain Disruptions
One of the key challenges facing the U.S. tire market is the volatility in raw material prices, particularly for rubber, carbon black, and synthetic polymers. These materials form the backbone of tire manufacturing, and fluctuations in their costs can significantly impact production expenses and profit margins. For instance, shipping container costs in late 2021 were about eight times higher than in early 2020, compounding the effects of rising raw material prices. The U.S. market is heavily reliant on both domestic and imported raw materials, making it vulnerable to global supply chain disruptions, geopolitical tensions, and trade restrictions. In recent years, disruptions caused by the COVID-19 pandemic, rising freight costs, and delays at major ports have strained the timely availability of materials, leading to production slowdowns and inventory shortages. Tire manufacturers often struggle to pass on these rising costs to consumers due to high market competition, which can further compress margins and hinder profitability.
Stringent Regulatory Compliance and Environmental Pressures
Increasingly strict environmental and safety regulations are also posing substantial challenges for tire manufacturers operating in the U.S. market. Agencies such as the Environmental Protection Agency (EPA) and the National Highway Traffic Safety Administration (NHTSA) impose rigorous standards related to tire emissions, fuel efficiency, rolling resistance, and recycling. Compliance with these regulations requires substantial investments in R&D, testing, and production re-engineering, which can be financially burdensome, particularly for small and mid-sized manufacturers. Additionally, growing pressure to develop sustainable and recyclable tires while maintaining performance and cost efficiency adds complexity to the product development cycle. Non-compliance risks penalties and reputational damage, making it imperative for companies to balance innovation with regulatory adherence. This evolving regulatory landscape continues to challenge manufacturers to innovate responsibly while managing costs and timelines.
Market Opportunities
The U.S. tire market presents substantial opportunities driven by the rapid expansion of the electric vehicle (EV) sector and growing demand for advanced tire technologies. As EV adoption accelerates nationwide, tire manufacturers have the chance to develop and supply specialized products that meet the unique requirements of these vehicles, such as low rolling resistance, enhanced durability, and noise reduction. With automakers and consumers prioritizing energy efficiency and performance, there is a rising demand for innovative tire designs tailored for EVs and hybrid vehicles. Furthermore, the integration of smart technologies into tires, including embedded sensors for real-time monitoring of pressure, temperature, and tread wear, opens up new revenue streams. Fleet operators and commercial vehicle owners are increasingly adopting these intelligent solutions to reduce maintenance costs and improve operational efficiency, creating lucrative opportunities for tire brands that invest in R&D and digital integration.
In addition to technological advancements, the aftermarket and e-commerce segments offer significant potential for market expansion. As more consumers turn to online platforms for automotive products, tire manufacturers and retailers can capitalize on the growing digital demand by enhancing their online presence and offering personalized services, such as mobile tire fitting and virtual tire selection tools. The shift in consumer behavior toward convenience, transparency, and wider product accessibility is driving the growth of direct-to-consumer channels, especially in urban areas. Meanwhile, the aging vehicle fleet in the U.S. presents ongoing opportunities in the replacement tire market. Older vehicles require more frequent tire changes, fueling consistent aftermarket demand. Manufacturers that align their strategies with sustainability trends—such as eco-friendly materials, recyclable components, and longer-lasting tire designs—are also well-positioned to attract environmentally conscious consumers and gain a competitive edge in the evolving market landscape. These combined factors make the U.S. tire market ripe for innovation and strategic expansion.
Market Segmentation Analysis:
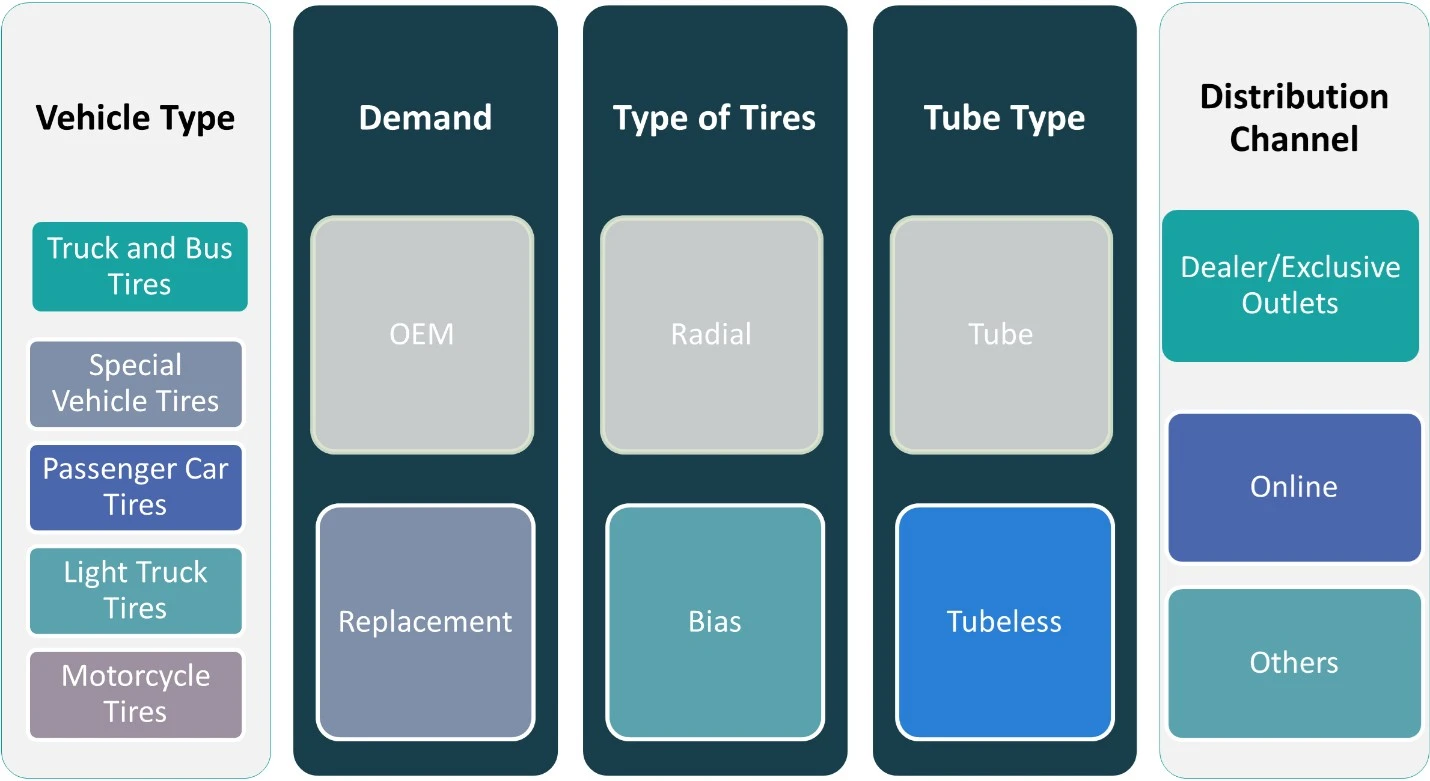
By Vehicle Type:
The U.S. tire market is segmented by vehicle type into truck and bus tires, special vehicle tires, passenger car tires, light truck tires, and motorcycle tires. Among these, passenger car tires represent the largest market share, supported by the high volume of personal vehicles in operation across the country. Consumers consistently prioritize safety, comfort, and fuel efficiency, which drives steady demand for replacement tires in this segment. Light truck tires also hold a substantial share due to the popularity of pickup trucks and SUVs, particularly in rural and suburban areas. Meanwhile, the demand for truck and bus tires is rising with the expansion of freight transportation and logistics services, especially for long-haul routes. Special vehicle tires, including those used in agriculture, mining, and construction, remain niche but essential, particularly in industrial zones. The motorcycle tire segment is comparatively smaller but benefits from seasonal demand and a growing base of recreational riders. Each segment presents unique design and performance requirements, prompting continuous innovation among manufacturers.
By Demand:
Based on demand, the U.S. tire market is categorized into Original Equipment Manufacturer (OEM) and replacement segments. The replacement tire segment dominates the market, accounting for a significantly higher volume of sales compared to OEM tires. This is largely driven by the aging vehicle fleet in the U.S., frequent tire wear due to extensive commuting, and increased consumer awareness of tire maintenance. Consumers actively seek high-performance, durable, and all-season tires for improved safety and fuel efficiency. The replacement market also benefits from the growth of online tire sales and mobile installation services. In contrast, the OEM segment, while smaller in volume, is influenced by new vehicle production trends and technological partnerships between automakers and tire manufacturers. OEM tires must meet strict quality and performance benchmarks, especially for electric vehicles and luxury models. As vehicle production stabilizes post-pandemic and EV manufacturing accelerates, the OEM tire segment is expected to witness gradual growth. Both segments are essential for long-term market sustainability and innovation.
Segments:
Based on Vehicle Type:
- Truck and Bus Tires
- Special Vehicle Tires
- Passenger Car Tires
- Light Truck Tires
- Motorcycle Tires
Based on Demand:
Based on Type of Tires:
Based on Tube Type
Based on Distribution Channel:
- Dealer/Exclusive Outlets
- Online
- Others
Based on the Geography:
- Western United States
- Midwestern United States
- Southern United States
- Northeastern United States
Regional Analysis
Western United States
The Western United States accounted for approximately 28% of the U.S. tire market share in 2024. This region benefits from a diverse mix of urban centers, industrial zones, and long-haul trucking routes that generate sustained demand for various tire types. States like California, Washington, and Arizona contribute significantly due to high vehicle density, environmental awareness, and widespread use of electric and hybrid vehicles. Additionally, the increasing adoption of smart and eco-friendly tire technologies aligns with the region’s strong regulatory push toward sustainability. The presence of extensive road networks, mountainous terrains, and fluctuating weather conditions drives demand for specialized tires, including all-terrain and all-season variants. Moreover, with California leading in electric vehicle sales, tire manufacturers are focusing on low rolling resistance and high-durability tires suited for EVs. The region also benefits from well-established distribution channels and a robust aftermarket network, enhancing its dominance in both OEM and replacement segments.
Midwestern United States
The Midwestern United States held a market share of approximately 24% in 2024. This region is characterized by its strong manufacturing base, extensive agricultural operations, and year-round trucking activity. States like Michigan, Illinois, and Ohio are central hubs for automotive production and component supply chains, bolstering the OEM tire segment. The Midwest’s harsh winters and variable road conditions increase the demand for durable, weather-resistant tires, particularly winter and snow tires. Furthermore, the high number of commercial vehicles supporting agriculture, mining, and freight transport contributes significantly to demand for truck, bus, and special vehicle tires. The aftermarket segment remains strong, driven by routine tire replacements due to seasonal wear and usage in industrial applications. Additionally, regional investments in infrastructure and interstate logistics continue to stimulate demand for high-performance and heavy-duty tires, offering growth opportunities for both local distributors and global manufacturers targeting fleet and utility markets.
Southern United States
The Southern United States dominated the U.S. tire market with a leading share of 30% in 2024. This region benefits from a large population base, a high number of registered vehicles, and favorable weather conditions that support year-round driving. States such as Texas, Florida, and Georgia have some of the highest vehicle ownership rates in the country, which significantly boosts demand for passenger car and light truck tires. The region is also a critical logistics and distribution hub, supporting significant commercial and freight traffic that increases demand for truck and bus tires. Replacement tires are particularly dominant in this region, with strong retail networks and rising e-commerce penetration. The warm climate leads to different tire wear patterns, prompting consumers to frequently replace worn-out tires, further supporting market growth. Additionally, the increasing popularity of SUVs and crossovers among Southern drivers is expected to keep the demand for all-season and high-performance tires robust in the coming years.
Northeastern United States
The Northeastern United States captured around 18% of the U.S. tire market share in 2024. Although the smallest among the four regions in terms of market size, it remains a key area for seasonal and specialty tire sales. States like New York, Pennsylvania, and Massachusetts experience long and harsh winters, leading to consistent demand for winter tires and all-weather variants. Urban congestion, shorter driving distances, and a higher concentration of commuters contribute to frequent tire replacements in densely populated areas. The OEM segment is relatively limited in this region; however, the aftermarket is vibrant, driven by consumer preference for quality and performance-oriented tires. Additionally, growing awareness of tire safety, coupled with advanced tire service centers and retail outlets, supports steady demand. As electric vehicles gain traction in urban centers, tire makers are increasingly introducing EV-compatible products in the Northeast, positioning the region as an important market for innovation and sustainable tire solutions.
Shape Your Report to Specific Countries or Regions & Enjoy 30% Off!
Key Player Analysis
- Goodyear Tire & Rubber Company
- Cooper Tire & Rubber Company
- Carlisle Companies Inc.
- Titan International
- Greenball Corporation
Competitive Analysis
The U.S. tire market is highly competitive, with leading players striving to maintain their dominance through innovation, strategic partnerships, and expanding product portfolios. Goodyear Tire & Rubber Company, Cooper Tire & Rubber Company, Carlisle Companies Inc., Titan International, and Greenball Corporation are the primary competitors shaping the landscape. Companies are also prioritizing sustainability by incorporating eco-friendly materials and adopting greener production processes. To further differentiate themselves, many players are investing in smart tire technologies, offering products with embedded sensors for real-time monitoring of tire health, pressure, and wear. This shift towards connected solutions is particularly appealing in fleet management, where operational efficiency and cost savings are crucial. Additionally, brands are increasing their focus on the aftermarket sector, with tire replacement and repair services becoming significant revenue streams. As regional preferences evolve, companies are adapting their offerings to meet specific demands, such as winter tires in colder regions and all-season tires in warmer climates. The competitive environment remains dynamic, with firms aiming to capture market share through strategic collaborations, expanded distribution networks, and continuous product innovation.
Recent Developments
- In May 2025,Continental reported its best Q1 earnings since 2021, with adjusted group earnings of €586 million, driven by cost reductions and a rebound in tire replacement demand. The company is undergoing a major overhaul, spinning off its automotive unit and planning to divest the ContiTech industrial division to focus on its profitable tires business.
- In March 2025, Bridgestone announced its 2025 motorsports plan, continuing support for professional and grassroots motorsports globally. The company is emphasizing sustainable motorsport as a “mobile laboratory” to refine technologies for commercial tire development. Bridgestone remains the exclusive tire supplier for major race series, including Japan’s SUPER GT and North America’s NTT INDYCAR® SERIES.
- In March 2025, Michelin was named one of the world’s 100 most innovative companies by Clarivate, recognizing its strong R&D capabilities. The company also launched the MICHELIN City Touring tire for bicycles, emphasizing safety and sustainability.
- In February 2025,Goodyear announced a capacity expansion at its Lawton, Oklahoma facility, targeting production of 10 million additional premium tires annually, especially larger rim sizes and higher-margin segments.
- In January 2025,Apollo highlighted double-digit growth in commercial vehicle and farm tires, high single-digit growth in passenger car tires, and continued investment in R&D and AI-driven efficiency. The company is also investing in natural rubber cultivation in India to address commodity challenges.
Market Concentration & Characteristics
The U.S. tire market exhibits moderate concentration, with several leading players dominating the landscape while numerous smaller brands cater to niche segments. The market is characterized by a few large multinational companies that hold a significant market share, driving innovation and setting industry standards in terms of quality, performance, and sustainability. These major players invest heavily in research and development to produce high-performance tires that cater to evolving consumer needs, such as fuel efficiency, durability, and smart tire technologies. Additionally, the market has a robust aftermarket sector, where tire replacements and related services contribute significantly to overall growth. The tire industry is also seeing a shift towards sustainability, with manufacturers increasingly adopting eco-friendly materials and processes. Consumer demand for all-season and specialized tires, driven by regional climate conditions, further influences the characteristics of the market. Overall, while the market is competitive, the trend towards innovation and sustainability continues to reshape its landscape.
Report Coverage
The research report offers an in-depth analysis based on Vehicle Type, Demand, Type of Tires, Tube Type, Distribution Channel and Geography. It details leading market players, providing an overview of their business, product offerings, investments, revenue streams, and key applications. Additionally, the report includes insights into the competitive environment, SWOT analysis, current market trends, as well as the primary drivers and constraints. Furthermore, it discusses various factors that have driven market expansion in recent years. The report also explores market dynamics, regulatory scenarios, and technological advancements that are shaping the industry. It assesses the impact of external factors and global economic changes on market growth. Lastly, it provides strategic recommendations for new entrants and established companies to navigate the complexities of the market.
Future Outlook
- The U.S. tire market is projected to continue its steady growth trajectory, driven by advancements in tire technology and increasing consumer demand for specialized tire solutions.
- The rise of electric vehicles (EVs) is influencing tire design, with manufacturers focusing on developing tires that offer low rolling resistance and enhanced durability to meet the unique needs of EVs.
- Smart tire technologies are gaining traction, enabling real-time monitoring of tire health and performance, thereby enhancing vehicle safety and maintenance efficiency.
- Sustainability remains a key focus, with tire manufacturers adopting eco-friendly materials and processes to align with environmental regulations and consumer preferences.
- The aftermarket segment is expected to experience significant growth, fueled by the increasing vehicle fleet and the need for regular tire replacements.
- Online sales channels are becoming more prevalent, offering consumers convenience and a wider selection of tire options.
- Regulatory pressures are prompting manufacturers to innovate and comply with stringent safety and environmental standards.
- Supply chain dynamics are evolving, with companies exploring localized production and sourcing strategies to mitigate risks associated with global trade uncertainties.
- Consumer preferences are shifting towards tires that offer improved fuel efficiency, longer lifespan, and enhanced performance characteristics.
- Collaboration between automakers and tire manufacturers is intensifying, leading to the development of integrated solutions that enhance overall vehicle performance and safety.
Frequently Asked Questions
Q: What is the current size of the U.S. Tire?
The U.S. Tire market was valued at USD 86,804.50 million in 2024 and is projected to reach USD 122,709.25 million by 2032, growing at a CAGR of 4.42%.
Q: What factors are driving the growth of the U.S. Tire?
Key drivers include rising vehicle ownership, growing demand for replacement and EV-specific tires, smart tire innovations, and expanding e-commerce channels.
Q: What are the key segments within the U.S. Tire?
Segments include vehicle type (e.g., passenger car, light truck, bus), demand (OEM and replacement), tire type, tube type, distribution channel, and regional geography.
Q: What are some challenges faced by the U.S. Tire?
Challenges include volatile raw material prices, global supply chain disruptions, and strict regulatory compliance related to sustainability and safety.
Q: Who are the major players in the U.S. Tire?
Major players include Goodyear Tire & Rubber Company, Cooper Tire & Rubber Company, Carlisle Companies Inc., Titan International, and Greenball Corporation.


