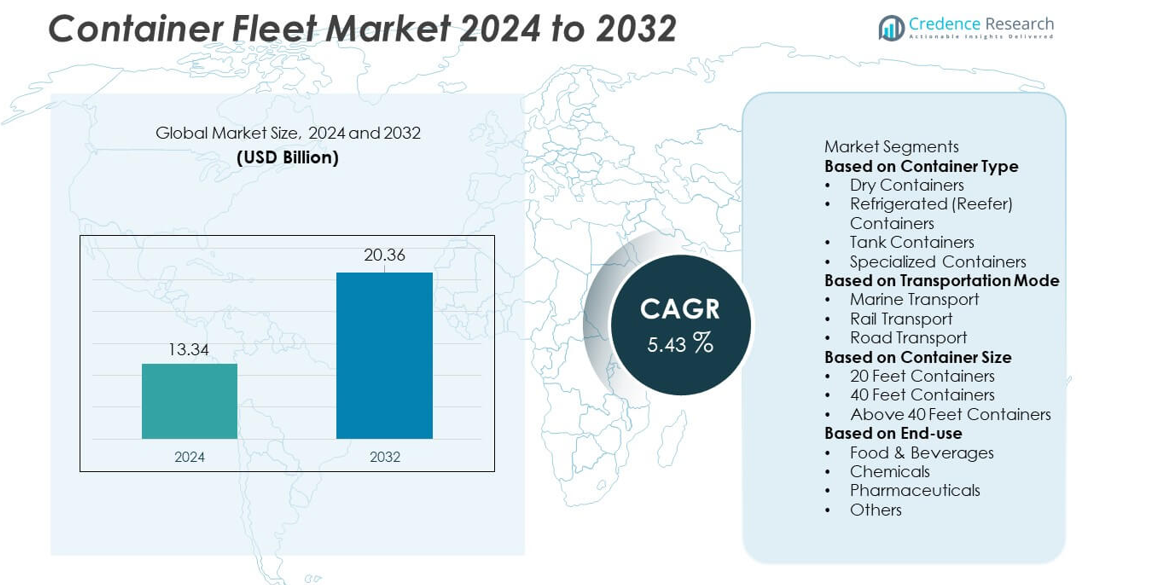
Container Fleet Market By Type ( Dry Container Fleet, Reefer Container Fleet, Tank Container Fleet, Special Container) By Application Analysis (Automotive, Oil and Gas, Mining and Minerals, Agriculture, Food and Others ) – Growth, Future Prospects And Competitive Analysis, 2020 – 2030

Report ID: 4261 | Report Format : Excel, PDF

Market Overview

The global container fleet market is poised for significant expansion, projected to reach an impressive USD 18,036.98 million by 2030 from its current value of USD 11,897.5 million in 2022. This translates to a robust compound annual growth rate (CAGR) of 6.12% from 2023 to 2030.

The container fleet market encompasses various activities, including manufacturing, maintenance, operation, and leasing of shipping containers, all of which contribute to the overall market revenue. The market’s growth is driven by a convergence of factors, such as technological advancements, increased demand in downstream sectors, and favorable market conditions.

Moreover, the trajectory of the market is influenced by global demand for goods, advancements in shipping technology, and international trade regulations. Considering these factors, the future of the container fleet market appears promising, offering ample opportunities to stakeholders in this dynamic sector.

Market Growth Drivers and Trends

The expansion of the container fleet market is being fueled by several critical trends and growth drivers. One primary driver is the increasing global trade, particularly in emerging economies, which necessitates efficient, reliable, and cost-effective methods of transporting goods. Technological innovations, such as smart containers equipped with tracking devices and sensors, are playing a significant role in container fleet operations. These innovations enhance supply chain visibility and efficiency, further bolstering market growth.

Environmental regulations are also exerting a growing influence on the shipping industry. The shift towards sustainability is driving the adoption of eco-friendly containers and the retrofitting of existing fleets, factors that contribute to the growth of the container fleet market. Moreover, the rise of e-commerce is generating unprecedented demand for container shipping as businesses strive to meet consumer expectations for swift and secure delivery of goods. This trend serves as a strong growth impetus for the container fleet market.

The increasing demand for high-capacity vessels globally presents a positive outlook for the market. These vessels can accommodate more containers at a time, significantly reducing operational costs and contributing to market growth. Additionally, the growing emphasis on safety in logistics, coupled with increasing trade activities, is another factor driving growth. The widespread adoption of dry container fleets, known for their spaciousness, convenience, and durability, is favoring market expansion.

Furthermore, the rising demand for fresh, healthy, and high-quality food products, such as fruits, vegetables, and dairy products, is driving growth due to the high reliance on the cold chain and logistics industries. The adoption of returnable container tracking systems using radio frequency identification (RFID) or beacon technology helps improve asset management and plays a crucial role in controlling, recovering, and securing returnable shipping containers, further facilitating market growth.

Combinable containers are also gaining popularity, offering the flexibility to be used in a standard or combined state by adjusting the dimensions to match the cargo size. This adaptability positively influences market growth. The utilization of Internet of Things (IoT) technology to track shipments in real-time is another driving factor for market expansion. Additionally, the widespread adoption of reefer containers, along with continuous technological advancements and extensive research and development (R&D) activities, are expected to further drive the market.

Market restraint factors

Despite the promising growth trajectory, several factors may hinder the expansion of the container fleet market. One major challenge is the significant capital and operational costs associated with container shipping. The costs of manufacturing, maintaining, and upgrading shipping containers are substantial, potentially impeding market growth. Moreover, the shipping industry is subject to stringent regulations, and changes in international trade policies can have a negative impact on the market. Regulatory constraints, particularly those aimed at reducing carbon emissions, may necessitate costly compliance measures, adding to operational expenses in the industry. Additionally, global economic uncertainties, such as trade wars and economic downturns, can decrease the demand for goods, subsequently reducing the need for shipping containers. Similarly, fluctuations in fuel prices can greatly affect shipping costs, thereby impacting the profitability of entities in the container fleet market. Lastly, the threat of piracy and terrorism at sea remains a significant concern for the shipping industry, necessitating heightened security measures and incurring additional costs. If not carefully managed, these factors have the potential to impede the growth of the container fleet market.

Access crucial information at unmatched prices!

Request your sample report today & start making informed decisions powered by Credence Research Inc.!

Download Sample

Challenges and opportunities

Challenges in the Container Fleet Market:

The container fleet market encounters several challenges that could impede its growth. Firstly, substantial operational costs pose a significant obstacle. Manufacturing, maintaining, and upgrading shipping containers require considerable capital investments, which can hinder market expansion. Secondly, regulatory constraints, such as changes in international trade policies and environmental regulations, can result in costly compliance measures, further escalating operational expenses. Another pressing concern is the economic uncertainty on a global scale. Factors like trade conflicts, economic downturns, and fluctuating fuel prices can significantly impact the demand for goods and shipping costs, potentially affecting market profitability. Additionally, security concerns cannot be disregarded. With threats like piracy and terrorism at sea, heightened security measures are necessary, which could lead to additional expenditures.

Opportunities in the Container Fleet Market:

On a positive note, the container fleet market presents several growth opportunities. Technological advancements, particularly in smart containers and digital solutions, can greatly enhance supply chain visibility and efficiency. This offers significant growth potential for market players. Additionally, as the world increasingly focuses on sustainability, there is a drive for more eco-friendly practices. This trend creates opportunities for the adoption of green containers and retrofitting existing fleets to be more environmentally friendly. The booming e-commerce sector, which has experienced unprecedented growth in recent years, also fuels the demand for container shipping. This provides a strong incentive for market expansion. Lastly, the emergence of leasing services for shipping containers presents a lucrative opportunity. Companies offering these services provide cost-effective solutions for businesses, strengthening the growth prospects of the market.

The container fleet market, despite its challenges, holds immense potential. By prioritizing technological innovation, sustainability, and operational efficiency, companies can not only enhance their competitive edge but also make significant contributions to the expansion of the market.

Regulatory Analysis in the Container Fleet Market:

The container fleet market operates within a comprehensive regulatory framework that extends across international waters, with these regulations exerting a significant influence on market dynamics. The International Maritime Organization (IMO) serves as the primary global authority overseeing maritime safety, security, and the prevention of marine and atmospheric pollution caused by ships.

One noteworthy regulation is the IMO 2020 rule, which mandates a maximum sulfur content of 0.5% in marine fuels, down from the previous 3.5%. This rule aims to mitigate the environmental impact of the shipping industry, yet it also imposes a financial burden on operators, necessitating investments in cleaner, albeit more expensive, fuels or retrofitting ships with sulfur scrubbers.

Additional regulations of consideration include the Ballast Water Management Convention, which aims to prevent the spread of harmful aquatic organisms between regions, and the Hong Kong International Convention for the Safe and Environmentally Sound Recycling of Ships, which establishes regulations for ship recycling.

Given the intricate nature of these regulations, market players must navigate them diligently. Ensuring compliance can be costly, while non-compliance may result in severe penalties and reputational damage for companies. Therefore, it is imperative for businesses in the container fleet market to remain informed about regulatory changes and proactively adjust their operations accordingly.

Competitive Analysis

Top Players in the Container Fleet Market:

  1. Maersk
  2. CMA CGM Group
  3. China COSCO Shipping Corporation Limited
  4. MSC Mediterranean Shipping Company S.A.
  5. Hapag-Lloyd AG
  6. Evergreen Marine Corporation
  7. HMM Co., Ltd.
  8. Hyundai Merchant Marine Co., Ltd.
  9. Coca Shipping Lines Co., Ltd.
  10. ONE (Ocean Network Express)

Emerging Players in the Container Fleet Market:

  1. Traxens
  2. Loginno
  3. Seaco
  4. Triton International
  5. Textainer Group Holdings Limited
  6. Blue Sky Intermodal
  7. Florens Container Services
  8. CXIC Group Containers Company Limited
  9. Touax Container Solutions
  10. UES International (HK) Holdings Limited

The container fleet market is characterized by the coexistence of established players and emerging entrants, creating a competitive landscape. Leading companies such as Maersk, CMA CGM Group, and China COSCO Shipping Corporation Limited dominate the market due to their global presence, extensive fleet sizes, and comprehensive service offerings. These market leaders are also pioneers in technological innovation, introducing smart containers and eco-friendly ships.

Simultaneously, smaller companies and start-ups contribute to market competition by providing innovative solutions that enhance efficiency and reduce costs. For example, Traxens and Loginno disrupt the market with their smart container solutions, offering real-time tracking and condition monitoring of cargo.

Leasing companies like Seaco and Triton International play a vital role in the market by offering cost-effective solutions for businesses requiring cargo transportation but lacking their own fleet resources.

While competition remains fierce, the sustained growth of global trade and the ongoing digital transformation in the shipping industry provide ample opportunities for both existing companies and new entrants in the container fleet market.

Recent developments and news

In January 2022, Evergreen Marine Corp. announced a new initiative to construct 20 carbon-neutral vessels, with the goal of meeting the International Maritime Organization’s ambitious carbon reduction targets by 2050. This strategic decision underscores the shipping giant’s ongoing dedication to sustainability and environmental responsibility.

In February 2022, MSC Mediterranean Shipping Company unveiled its plans to develop a new digital platform that enhances transparency and traceability in the supply chain. Leveraging blockchain technology, the platform will provide real-time updates and tracking information, significantly enhancing the customer experience.

In March 2022, ONE (Ocean Network Express) announced the launch of a new service route, bolstering its network between Asia and the East Coast of North America. This move is a response to the increasing demand for container shipping services in these regions, showcasing the company’s proactive measures to capitalize on market trends.

ZIM Integrated Shipping Services made headlines in April 2022 with its announcement to acquire 10 new ultra-large container vessels. These additions will effectively expand ZIM’s operating capacity, enabling the company to cater to the growing demand in the market.

In early 2023, Seaspan Corporation, a leading independent charter owner, reported a significant increase in revenue, attributing the growth to escalating leasing rates and robust demand. The company also unveiled plans to add an additional 50,000 TEU to its fleet, demonstrating its confidence in sustained market growth.

Segmentation Analysis

Based on the type of container fleet, the container fleet market is segmented into:

  • dry container fleet
  • Reefer Container Fleet
  • Tank Container Fleet
  • Special Container Fleet

Shape Your Report to Specific Countries or Regions & Enjoy 30% Off!

In 2020, the dry container fleet accounted for the largest market share of 69% of the global container fleet market. During the forecast period of 2024–2030, the reefer fleet is expected to grow at a significant rate of 3.2%. The reefer container fleet market is expected to expand as a result of the rising global meat and frozen food trade, rising demand for refrigerated trade, particularly in North and South East Asia, and rising demand for reefer containers for fruits and vegetable trade. According to a published study article, reefer shipping has outperformed dry cargo in the first half of 2016, and it was also observed that from January to June 2016, reefer cargo racked up 163,000 extra TEU in the same period last year, and chilled foods grew by 7% and frozen foods by 4% compared to last year.

Based on Application Analysis

  • Automotive
  • Oil and Gas
  • Mining and Minerals
  • Agriculture
  • Food and Others

For the purpose of this study, the global container fleet market is categorized into three segments:

  • North America
  • Europe
  • Asia Pacific
  • Latin America
  • Middle East and Africa

Asia-Pacific was observed as the largest market in the container fleet industry due to factors such as increasing demand for intermodal transportation and a rising global need for reefer cargo shipping. According to market experts, developing countries are producing more with noticeable growth in industrialization and are expected to make their way to being exporting nations. Because Asia-Pacific has a greater number of developing countries in the majority of key business sectors, it is the largest market for the cargo shipping trade. The major Asian countries are Hong Kong, Japan, China, Singapore, Malaysia, and Thailand. China was identified as one of the major manufacturers of the container fleet in Asia-Pacific due to constant technological innovation, particularly in ship capacity and developing infrastructure, which is assisting the manufacturing industry’s growth.

Chapter No. 1 :………. Introduction.. 20

1.1.      Report Description. 20

1.1.1.    Purpose of the Report 20

1.1.2.    USP & Key Offerings. 20

1.2.      Key Benefits for Stakeholders. 20

1.3.      Target Audience. 21

1.4.      Report Scope  22

Chapter No. 2 :………. Executive Summary. 24

2.1.      Container Fleet Market Snapshot. 24

2.2.      Global Container Fleet Market, 2017 – 2022 (USD Million) 25

Chapter No. 3 :………. Impact Analysis of COVID 19 & Russia-Ukraine War on Container Fleet Market. 26

3.1.      Impact Assessment of COVID-19 Pandemic, By Region. 26

3.1.1.    Supply chain disruptions. 26

3.1.2.    Demand fluctuations. 26

3.1.3.    Shift in product mix. 26

3.1.4.    Reduced industrial activity. 26

3.1.5.    Temporary disruptions and delays. 26

3.1.6.    Shift in focus towards essential services. 26

3.2.      Russia-Ukraine War Impacts. 27

3.2.1.    Uncertainty and economic instability. 27

3.2.2.    Supply chain disruptions. 27

3.2.3.    Regional market shifts. 27

3.2.4.    Shift in government priorities. 27

Chapter No. 4 :………. Container Fleet Market – Industry Analysis. 28

4.1.      Introduction  28

4.2.      Market Drivers  29

4.2.1.    Driving Factor 1 Analysis. 29

4.2.2.    Driving Factor 2 Analysis. 30

4.3.      Market Restraints. 31

4.3.1.    Restraining Factor Analysis. 31

4.4.      Market Opportunities. 32

4.4.1.    Market Opportunity Analysis. 32

4.5.      Porter’s Five Forces Analysis. 33

4.6.      Value Chain Analysis. 34

4.7.      Buying Criteria  35

Chapter No. 5 :………. Analysis Competitive Landscape. 36

5.1.      Company Market Share Analysis – 2022. 36

5.1.1.    Global Container Fleet Market: Company Market Share, by Revenue2022. 36

5.1.2.    Global Container Fleet Market: Top 6 Company Market Share, by Revenue2022. 36

5.1.3.    Global Container Fleet Market: Top 3 Company Market Share, by Revenue2022. 37

5.1.      Global Container Fleet Market Company Revenue Market Share, 2022  38

5.2.      Company Assessment Metrics, 2022. 39

5.2.1.    Stars  39

5.2.2.    Emerging Leaders. 39

5.2.3.    Pervasive Players. 39

5.2.4.    Participants. 39

5.3.      Start-ups /SMEs Assessment Metrics, 2022. 39

5.3.1.    Progressive Companies. 39

5.3.2.    Responsive Companies. 39

5.3.3.    Dynamic Companies. 39

5.3.4.    Starting Blocks. 39

5.4.      Strategic Developments. 40

5.4.1.    Acquisitions & Mergers. 40

5.4.2.    New Product Launch. 40

5.4.3.    Regional Expansion. 40

5.5.      Key Players Product Matrix. 41

Chapter No. 6 :………. PESTEL & Adjacent Market Analysis. 42

6.1.      PESTEL  42

6.1.1.    Political Factors. 42

6.1.2.    Economic Factors. 42

6.1.3.    Social Factors. 42

6.1.4.    Technological Factors. 42

6.1.5.    Environmental Factors. 42

6.1.6.    Legal Factors. 42

6.2.      Adjacent Market Analysis. 42

Chapter No. 7 :………. Container Fleet Market – By Type Segment Analysis. 43

7.1.      Container Fleet Market Overview, by Type Segment. 43

7.1.1.    Container Fleet Market Revenue Share, By Type, 2022 & 2030. 44

7.1.2.    Container Fleet Market Attractiveness Analysis, By Type  45

7.1.3.    Incremental Revenue Growth Opportunity, by Type, 2023 – 2030. 45

7.1.4.    Container Fleet Market Revenue, By Type, 2017, 2022, 2026 & 2030. 46

7.2.      Dry Container  47

7.2.1.    Global Dry Container Container Fleet Market Revenue, By Region, 2017 – 2022 (USD Million) 48

7.2.2.    Global Dry Container Container Fleet Market Revenue, By Region, 2017 – 2022 (USD Million) 48

7.3.      Reefer Container. 49

7.3.1.    Global Reefer Container Container Fleet Market Revenue, By Region, 2017 – 2022 (USD Million) 50

7.3.2.    Global Reefer Container Container Fleet Market Revenue, By Region, 2017 – 2022 (USD Million) 50

7.4.      Tank Container  51

7.4.1.    Global Tank Container Container Fleet Market Revenue, By Region, 2017 – 2022 (USD Million) 52

7.4.2.    Global Tank Container Container Fleet Market Revenue, By Region, 2017 – 2022 (USD Million) 52

7.5.      Special Container. 53

7.5.1.    Global Special Container Container Fleet Market Revenue, By Region, 2017 – 2022 (USD Million) 54

7.5.2.    Global Special Container Container Fleet Market Revenue, By Region, 2017 – 2022 (USD Million) 54

7.6.      Others  55

7.6.1.    Global Others Container Fleet Market Revenue, By Region, 2017 – 2022 (USD Million) 56

7.6.2.    Global Others Container Fleet Market Revenue, By Region, 2017 – 2022 (USD Million) 56

Chapter No. 8 :………. Container Fleet Market – By Application Segment Analysis. 57

8.1.      Container Fleet Market Overview, by Application Segment. 57

8.1.1.    Container Fleet Market Revenue Share, By Application, 2022 & 2030. 58

8.1.2.    Container Fleet Market Attractiveness Analysis, By Application. 59

8.1.3.    Incremental Revenue Growth Opportunity, by Application, 2023 – 2030. 59

8.1.4.    Container Fleet Market Revenue, By Application, 2017, 2022, 2026 & 2030. 60

8.2.      Automotive  61

8.2.1.    Global Automotive Container Fleet Market Revenue, By Region, 2017 – 2022 (USD Million) 62

8.2.2.    Global Automotive Container Fleet Market Revenue, By Region, 2017 – 2022 (USD Million) 62

8.3.      Oil and Gas  63

8.3.1.    Global Oil and Gas Container Fleet Market Revenue, By Region, 2017 – 2022 (USD Million) 64

8.3.2.    Global Oil and Gas Container Fleet Market Revenue, By Region, 2017 – 2022 (USD Million) 64

8.4.      Mining and Minerals. 65

8.4.1.    Global Mining and Minerals Container Fleet Market Revenue, By Region, 2017 – 2022 (USD Million) 66

8.4.2.    Global Mining and Minerals Container Fleet Market Revenue, By Region, 2017 – 2022 (USD Million) 66

8.5.      Agriculture  67

8.5.1.    Global Agriculture Container Fleet Market Revenue, By Region, 2017 – 2022 (USD Million) 68

8.5.2.    Global Agriculture Container Fleet Market Revenue, By Region, 2017 – 2022 (USD Million) 68

8.6.      Food and Others. 69

8.6.1.    Global Food and Others Container Fleet Market Revenue, By Region, 2017 – 2022 (USD Million) 70

8.6.2.    Global Food and Others Container Fleet Market Revenue, By Region, 2017 – 2022 (USD Million) 70

Chapter No. 9 :………. Container Fleet Market – Regional Analysis. 71

9.1.      Container Fleet Market Overview, by Regional Segments. 71

9.2.      Region  72

9.2.1.    Global Container Fleet Market Revenue Share, By Region, 2022 & 2030. 72

9.2.2.    Container Fleet Market Attractiveness Analysis, By Region  73

9.2.3.    Incremental Revenue Growth Opportunity, by Region, 2023 – 2030. 73

9.2.4.    Container Fleet Market Revenue, By Region, 2017, 2022, 2026 & 2030. 74

9.2.5.    Global Container Fleet Market Revenue, By Region, 2017 – 2022 (USD Million) 75

9.2.6.    Global Container Fleet Market Revenue, By Region, 2023 – 2030 (USD Million) 75

9.3.      Type  76

9.3.1.    Global Container Fleet Market Revenue, By Type, 2017 – 2022 (USD Million) 76

9.3.2.    Global Container Fleet Market Revenue, By Type, 2023 – 2030 (USD Million) 76

9.4.      Application  77

9.4.1.    Global Container Fleet Market Revenue, By Application, 2017 – 2022 (USD Million) 77

9.4.2.    Global Container Fleet Market Revenue, By Application, 2023 – 2030 (USD Million) 77

Chapter No. 10 :…….. Container Fleet Market – North America.. 78

10.1.    North America  78

10.1.    Key Highlights  78

10.1.1.  North America Container Fleet Market Revenue, By Country, 2017 – 2022 (USD Million) 79

10.1.2.  North America Container Fleet Market Revenue, By Type, 2017 – 2022 (USD Million) 80

10.1.3.  North America Container Fleet Market Revenue, By Application, 2017 – 2022 (USD Million) 81

10.1.4.  U.S. 82

10.1.5.  Canada  82

10.1.6.  Mexico  82

Chapter No. 11 :…….. Container Fleet Market – Europe. 83

11.1.    Europe  83

11.2.    Key Highlights  83

11.2.1.  Europe Container Fleet Market Revenue, By Country, 2017 – 2022 (USD Million) 84

11.2.2.  Europe Container Fleet Market Revenue, By Type, 2017 – 2022 (USD Million) 85

11.2.3.  Europe Container Fleet Market Revenue, By Application, 2017 – 2022 (USD Million) 86

11.2.4.  UK  87

11.2.5.  France  87

11.2.6.  Germany. 87

11.2.7.  Italy  87

11.2.8.  Spain  87

11.2.9.  Russia  87

11.2.10.            BENELUX. 87

11.2.11.            Sweden. 87

11.2.12.            Denmark. 87

11.2.13.            Poland. 87

11.2.14.            Austria. 87

11.2.15.            Rest of Europe. 87

Chapter No. 12 :…….. Container Fleet Market – Asia Pacific. 88

12.1.    Asia Pacific  88

12.2.    Key Highlights  88

12.2.1.  Asia Pacific Container Fleet Market Revenue, By Country, 2017 – 2022 (USD Million) 89

12.2.2.  Asia Pacific Container Fleet Market Revenue, By Type, 2017 – 2022 (USD Million) 90

12.2.3.  Asia Pacific Container Fleet Market Revenue, By Application, 2017 – 2022 (USD Million) 91

12.2.4.  China  92

12.2.5.  Japan  92

12.2.6.  South Korea. 92

12.2.7.  India  92

12.2.8.  Thailand. 92

12.2.9.  Indonesia. 92

12.2.10.            Vietnam.. 92

12.2.11.            Malaysia. 92

12.2.12.            Philippines. 92

12.2.13.            Taiwan. 92

12.2.14.            Rest of Asia Pacific. 92

Chapter No. 13 :…….. Container Fleet Market – Latin America.. 93

13.1.    Latin America  93

13.2.    Key Highlights  93

13.2.1.  Latin America Container Fleet Market Revenue, By Country, 2017 – 2022 (USD Million) 94

13.2.2.  Latin America Container Fleet Market Revenue, By Type, 2017 – 2022 (USD Million) 95

13.2.3.  Latin America Container Fleet Market Revenue, By Application, 2017 – 2022 (USD Million) 96

13.2.4.  Brazil 97

13.2.5.  Argentina. 97

13.2.6.  Colombia. 97

13.2.7.  Chile  97

13.2.8.  Peru  97

13.2.9.  Rest of Latin America. 97

Chapter No. 14 :…….. Container Fleet Market – Middle East. 98

14.1.    The Middle-East. 98

14.2.    Key Highlights  98

14.2.1.  Middle East Container Fleet Market Revenue, By Country, 2017 – 2022 (USD Million) 99

14.2.2.  Middle East Container Fleet Market Revenue, By Type, 2017 – 2022 (USD Million) 100

14.2.3.  Middle East Container Fleet Market Revenue, By Application, 2017 – 2022 (USD Million) 101

14.2.4.  GCC Countries. 102

14.2.5.  Israel 102

14.2.6.  Turkey  102

14.2.7.  Iran  102

14.2.8.  Rest of Middle East & Africa. 102

Chapter No. 15 :…….. Container Fleet Market – Africa.. 103

15.1.    Africa  103

15.2.    Key Highlights  103

15.2.1.  Africa Container Fleet Market Revenue, By Country, 2017 – 2022 (USD Million) 104

15.2.2.  Africa Container Fleet Market Revenue, By Type, 2017 – 2022 (USD Million) 105

15.2.3.  Africa Container Fleet Market Revenue, By Application, 2017 – 2022 (USD Million) 106

15.2.4.  South Africa. 107

15.2.5.  Egypt 107

15.2.6.  Nigeria  107

15.2.7.  Algeria  107

15.2.8.  Morocco. 107

15.2.9.  Rest of Africa. 107

Chapter No. 16 :…….. Company Profiles. 108

16.1.    A.P. Moller – Maersk A/S. 108

16.1.1.  Company Overview.. 108

16.1.2.  Product Portfolio. 108

16.1.3.  Swot Analysis. 108

16.1.4.  Business Strategy. 109

16.1.5.  Financial Overview.. 109

16.2.    China Ocean Shipping (Group) Company (COSCO) 110

16.3.    Cma Cgm S.A   110

16.4.    Evergreen Marine Corp. (Taiwan) Ltd. 110

16.5.    Hapag-Lloyd AG   110

16.6.    HYUNDAI Merchant Marine Co., Ltd. 110

16.7.    Kawasaki Kisen Kaisha, Ltd. 110

16.8.    Mitsui O.S.K. Lines, Ltd. 110

16.9.    MSC – Mediterranean Shipping Agency AG.. 110

16.10. Westfal-Larsen group. 110

Chapter No. 17 :…….. Research Methodology. 111

17.1.    Research Methodology. 111

17.2.    Phase I – Secondary Research. 112

17.3.    Phase II – Data Modeling. 112

17.3.1.  Company Share Analysis Model 113

17.3.2.  Revenue Based Modeling. 113

17.4.    Phase III – Primary Research. 114

17.5.    Research Limitations. 115

17.5.1.  Assumptions. 115


List of Figures

FIG NO. 1……….. Global Container Fleet Market Revenue, 2017 – 2022 (USD Million) 25

FIG NO. 2……….. Porter’s Five Forces Analysis for Global Container Fleet Market 33

FIG NO. 3……….. Value Chain Analysis for Global Container Fleet Market 34

FIG NO. 4……….. Company Share Analysis, 2022. 36

FIG NO. 5……….. Company Share Analysis, 2022. 36

FIG NO. 6……….. Company Share Analysis, 2022. 37

FIG NO. 7……….. Container Fleet Market – Company Revenue Market Share, 2022. 38

FIG NO. 8……….. Container Fleet Market Revenue Share, By Type, 2022 & 2030. 44

FIG NO. 9……….. Market Attractiveness Analysis, By Type. 45

FIG NO. 10……… Incremental Revenue Growth Opportunity by Type. 45

FIG NO. 11……… Container Fleet Market Revenue, By Type, 2017, 2022, 2026 & 2030. 46

FIG NO. 12……… Global Container Fleet Market for Dry Container, Revenue (USD Million) 2017 – 2030. 47

FIG NO. 13……… Global Container Fleet Market for Reefer Container, Revenue (USD Million) 2017 – 2030. 49

FIG NO. 14……… Global Container Fleet Market for Tank Container, Revenue (USD Million) 2017 – 2030. 51

FIG NO. 15……… Global Container Fleet Market for Special Container, Revenue (USD Million) 2017 – 2030. 53

FIG NO. 16……… Global Container Fleet Market for Others, Revenue (USD Million) 2017 – 2030. 55

FIG NO. 17……… Container Fleet Market Revenue Share, By Application, 2022 & 2030. 58

FIG NO. 18……… Market Attractiveness Analysis, By Application. 59

FIG NO. 19……… Incremental Revenue Growth Opportunity by Application. 59

FIG NO. 20……… Container Fleet Market Revenue, By Application, 2017, 2022, 2026 & 2030. 60

FIG NO. 21……… Global Container Fleet Market for Automotive, Revenue (USD Million) 2017 – 2030. 61

FIG NO. 22……… Global Container Fleet Market for Oil and Gas, Revenue (USD Million) 2017 – 2030. 63

FIG NO. 23……… Global Container Fleet Market for Mining and Minerals, Revenue (USD Million) 2017 – 2030. 65

FIG NO. 24……… Global Container Fleet Market for Agriculture, Revenue (USD Million) 2017 – 2030. 67

FIG NO. 25……… Global Container Fleet Market for Food and Others, Revenue (USD Million) 2017 – 2030. 69

FIG NO. 26……… Global Container Fleet Market Revenue Share, By Region, 2022 & 2030. 72

FIG NO. 27……… Market Attractiveness Analysis, By Region. 73

FIG NO. 28……… Incremental Revenue Growth Opportunity by Region. 73

FIG NO. 29……… Container Fleet Market Revenue, By Region, 2017, 2022, 2026 & 2030. 74

FIG NO. 30……… North America Container Fleet Market Revenue, 2017 – 2022 (USD Million) 78

FIG NO. 31……… Europe Container Fleet Market Revenue, 2017 – 2022 (USD Million) 83

FIG NO. 32……… Asia Pacific Container Fleet Market Revenue, 2017 – 2022 (USD Million) 88

FIG NO. 33……… Latin America Container Fleet Market Revenue, 2017 – 2022 (USD Million) 93

FIG NO. 34……… The Middle-East Container Fleet Market Revenue, 2017 – 2022 (USD Million) 98

FIG NO. 35……… Africa Container Fleet Market Revenue, 2017 – 2022 (USD Million) 103

FIG NO. 36……… Research Methodology – Detailed View.. 111

FIG NO. 37……… Research Methodology. 112


List of Tables

TABLE NO. 1. :…. Global Container Fleet Market: Snapshot 24

TABLE NO. 2. :…. Drivers for the Container Fleet Market: Impact Analysis. 29

TABLE NO. 3. :…. Restraints for the Container Fleet Market: Impact Analysis. 31

TABLE NO. 4. :…. Global Dry Container Container Fleet Market Revenue, By Region, 2017 – 2022 (USD Million) 48

TABLE NO. 5. :…. Global Dry Container Container Fleet Market Revenue, By Region, 2023– 2030 (USD Million) 48

TABLE NO. 6. :…. Global Reefer Container Container Fleet Market Revenue, By Region, 2017 – 2022 (USD Million) 50

TABLE NO. 7. :…. Global Reefer Container Container Fleet Market Revenue, By Region, 2023– 2030 (USD Million) 50

TABLE NO. 8. :…. Global Tank Container Container Fleet Market Revenue, By Region, 2017 – 2022 (USD Million) 52

TABLE NO. 9. :…. Global Tank Container Container Fleet Market Revenue, By Region, 2023– 2030 (USD Million) 52

TABLE NO. 10. :.. Global Special Container Container Fleet Market Revenue, By Region, 2017 – 2022 (USD Million) 54

TABLE NO. 11. :.. Global Special Container Container Fleet Market Revenue, By Region, 2023– 2030 (USD Million) 54

TABLE NO. 12. :.. Global Others Container Fleet Market Revenue, By Region, 2017 – 2022 (USD Million) 56

TABLE NO. 13. :.. Global Others Container Fleet Market Revenue, By Region, 2023– 2030 (USD Million) 56

TABLE NO. 14. :.. Global Automotive Container Fleet Market Revenue, By Region, 2017 – 2022 (USD Million) 62

TABLE NO. 15. :.. Global Automotive Container Fleet Market Revenue, By Region, 2023– 2030 (USD Million) 62

TABLE NO. 16. :.. Global Oil and Gas Container Fleet Market Revenue, By Region, 2017 – 2022 (USD Million) 64

TABLE NO. 17. :.. Global Oil and Gas Container Fleet Market Revenue, By Region, 2023– 2030 (USD Million) 64

TABLE NO. 18. :.. Global Mining and Minerals Container Fleet Market Revenue, By Region, 2017 – 2022 (USD Million) 66

TABLE NO. 19. :.. Global Mining and Minerals Container Fleet Market Revenue, By Region, 2023– 2030 (USD Million) 66

TABLE NO. 20. :.. Global Agriculture Container Fleet Market Revenue, By Region, 2017 – 2022 (USD Million) 68

TABLE NO. 21. :.. Global Agriculture Container Fleet Market Revenue, By Region, 2023– 2030 (USD Million) 68

TABLE NO. 22. :.. Global Food and Others Container Fleet Market Revenue, By Region, 2017 – 2022 (USD Million) 70

TABLE NO. 23. :.. Global Food and Others Container Fleet Market Revenue, By Region, 2023– 2030 (USD Million) 70

TABLE NO. 24. :.. Global Container Fleet Market Revenue, By Region, 2017 – 2022 (USD Million) 75

TABLE NO. 25. :.. Global Container Fleet Market Revenue, By Region, 2023– 2030 (USD Million) 75

TABLE NO. 26. :.. Global Container Fleet Market Revenue, By Type, 2017 – 2022 (USD Million) 76

TABLE NO. 27. :.. Global Container Fleet Market Revenue, By Type, 2023– 2030 (USD Million) 76

TABLE NO. 28. :.. Global Container Fleet Market Revenue, By Application, 2017 – 2022 (USD Million) 77

TABLE NO. 29. :.. Global Container Fleet Market Revenue, By Application, 2023– 2030 (USD Million) 77

TABLE NO. 30. :.. North America Container Fleet Market Revenue, By Country, 2017 – 2022 (USD Million) 79

TABLE NO. 31. :.. North America Container Fleet Market Revenue, By Country, 2023– 2030 (USD Million) 79

TABLE NO. 32. :.. North America Container Fleet Market Revenue, By Type, 2017 – 2022 (USD Million) 80

TABLE NO. 33. :.. North America Container Fleet Market Revenue, By Type, 2023– 2030 (USD Million) 80

TABLE NO. 34. :.. North America Container Fleet Market Revenue, By Application, 2017 – 2022 (USD Million) 81

TABLE NO. 35. :.. North America Container Fleet Market Revenue, By Application, 2023– 2030 (USD Million) 81

TABLE NO. 36. :.. Europe Container Fleet Market Revenue, By Country, 2017 – 2022 (USD Million) 84

TABLE NO. 37. :.. Europe Container Fleet Market Revenue, By Country, 2023– 2030 (USD Million) 84

TABLE NO. 38. :.. Europe Container Fleet Market Revenue, By Type, 2017 – 2022 (USD Million) 85

TABLE NO. 39. :.. Europe Container Fleet Market Revenue, By Type, 2023– 2030 (USD Million) 85

TABLE NO. 40. :.. Europe Container Fleet Market Revenue, By Application, 2017 – 2022 (USD Million) 86

TABLE NO. 41. :.. Europe Container Fleet Market Revenue, By Application, 2023– 2030 (USD Million) 86

TABLE NO. 42. :.. Asia Pacific Container Fleet Market Revenue, By Country, 2017 – 2022 (USD Million) 89

TABLE NO. 43. :.. Asia Pacific Container Fleet Market Revenue, By Country, 2023– 2030 (USD Million) 89

TABLE NO. 44. :.. Asia Pacific Container Fleet Market Revenue, By Type, 2017 – 2022 (USD Million) 90

TABLE NO. 45. :.. Asia Pacific Container Fleet Market Revenue, By Type, 2023– 2030 (USD Million) 90

TABLE NO. 46. :.. Asia Pacific Container Fleet Market Revenue, By Application, 2017 – 2022 (USD Million) 91

TABLE NO. 47. :.. Asia Pacific Container Fleet Market Revenue, By Application, 2023– 2030 (USD Million) 91

TABLE NO. 48. :.. Latin America Container Fleet Market Revenue, By Country, 2017 – 2022 (USD Million) 94

TABLE NO. 49. :.. Latin America Container Fleet Market Revenue, By Country, 2023– 2030 (USD Million) 94

TABLE NO. 50. :.. Latin America Container Fleet Market Revenue, By Type, 2017 – 2022 (USD Million) 95

TABLE NO. 51. :.. Latin America Container Fleet Market Revenue, By Type, 2023– 2030 (USD Million) 95

TABLE NO. 52. :.. Latin America Container Fleet Market Revenue, By Application, 2017 – 2022 (USD Million) 96

TABLE NO. 53. :.. Latin America Container Fleet Market Revenue, By Application, 2023– 2030 (USD Million) 96

TABLE NO. 54. :.. Middle East Container Fleet Market Revenue, By Country, 2017 – 2022 (USD Million) 99

TABLE NO. 55. :.. Middle East Container Fleet Market Revenue, By Country, 2023– 2030 (USD Million) 99

TABLE NO. 56. :.. Middle East Container Fleet Market Revenue, By Type, 2017 – 2022 (USD Million) 100

TABLE NO. 57. :.. Middle East Container Fleet Market Revenue, By Type, 2023– 2030 (USD Million) 100

TABLE NO. 58. :.. Middle East Container Fleet Market Revenue, By Application, 2017 – 2022 (USD Million) 101

TABLE NO. 59. :.. Middle East Container Fleet Market Revenue, By Application, 2023– 2030 (USD Million) 101

TABLE NO. 60. :.. Africa Container Fleet Market Revenue, By Country, 2017 – 2022 (USD Million) 104

TABLE NO. 61. :.. Africa Container Fleet Market Revenue, By Country, 2023– 2030 (USD Million) 104

TABLE NO. 62. :.. Africa Container Fleet Market Revenue, By Type, 2017 – 2022 (USD Million) 105

TABLE NO. 63. :.. Africa Container Fleet Market Revenue, By Type, 2023– 2030 (USD Million) 105

TABLE NO. 64. :.. Africa Container Fleet Market Revenue, By Application, 2017 – 2022 (USD Million) 106

TABLE NO. 65. :.. Africa Container Fleet Market Revenue, By Application, 2023– 2030 (USD Million) 106

Request Free Sample

Ready to Transform Data into Decisions?

Request Your Sample Report and Start Your Journey of Informed Choices


Providing the strategic compass for industry titans.

cr-clients-logos
What is the projected growth of the container fleet market by 2030?

The global container fleet market is expected to reach USD 18,036.98 million by 2030, growing at a Compound Annual Growth Rate (CAGR) of 6.12% from 2023 to 2030.

What are the major growth drivers in the container fleet market?

Key growth drivers include increasing global trade, technological innovations like smart containers with tracking devices, a shift towards sustainability, the rise of e-commerce, and the demand for high-capacity vessels.

What challenges does the container fleet market face?

    Some of the challenges include high operational and capital costs, stringent international trade regulations, global economic uncertainties, fluctuating fuel prices, and security threats like piracy and terrorism at sea.

      Which region is leading in the container fleet industry?

        Asia-Pacific holds the largest market share in the container fleet industry, driven by factors like increasing intermodal transportation, rising reefer cargo shipping, and significant contributions from countries like China, Japan, and Singapore.

        About Author

        Sushant Phapale

        Sushant Phapale

        ICT & Automation Expert

        Sushant is an expert in ICT, automation, and electronics with a passion for innovation and market trends.

        View Profile

        Concentrate Containers Market

        The Global Concentrate Containers Market size was valued at USD 4,870.05 million in 2018 to USD 7,034.14 million in 2024 and is anticipated to reach USD 11,346.66 million by 2032, at a CAGR of 5.73% during the forecast period.

        Temperature Controlled Containers Market

        The Temperature Controlled Containers Market size was valued at USD 4,986.59 million in 2018 to USD 8,217.15 million in 2024 and is anticipated to reach USD 15,873.78 million by 2032, at a CAGR of 8.61% during the forecast period.

        Container Depot Market

        The global container depot market is projected to grow from USD 7,425 million in 2024 to USD 12,474.1 million by 2032, registering a CAGR of 6.7% during the forecast period.

        Bagasse Food Container Market

        The Bagasse Food Container market size was valued at USD 828.55 million in 2018, increased to USD 1,358.59 million in 2024, and is anticipated to reach USD 2,675.51 million by 2032, at a CAGR of 8.23% during the forecast period.

        Shipping Container Market

        The Shipping Containers Market size was valued at USD 9,450.00 million in 2018, increased to USD 10,299.41 million in 2024, and is anticipated to reach USD 14,003.34 million by 2032, growing at a CAGR of 3.96% during the forecast period.

        Hinged Food Containers Market

        The  Hinged Food Containers Market is projected to grow from USD 91682 million in 2024 to an estimated USD 134427.4 million by 2032, with a compound annual growth rate (CAGR) of 4.9% from 2024 to 2032.

        Intermediate Bulk Container (IBC) Liner Market

        The Intermediate Bulk Container market size was valued at USD 10,544.86 million in 2018 and USD 14,910.35 million in 2024, and is anticipated to reach USD 23,345.86 million by 2032, at a CAGR of 5.80% during the forecast period.

        Intermediate Bulk Container Market

        The Intermediate Bulk Container market size was valued at USD 10,544.86 million in 2018 and USD 14,910.35 million in 2024, and is anticipated to reach USD 23,345.86 million by 2032, at a CAGR of 5.80% during the forecast period.

        Modular Container Data Center Market

        The Modular Container Data Center Market is projected to grow significantly from USD 30,293 million in 2024 to USD 113,097.4 million by 2032, expanding at a compound annual growth rate (CAGR) of 17.9%.

        Direct-To-Shape Inkjet Printing Market

        The Global Direct-To-Shape Inkjet Printing Market size was valued at USD 2,200.0 million in 2018 to USD 2,291.7 million in 2024 and is anticipated to reach USD 2,797.9 million by 2032, at a CAGR of 2.60% during the forecast period.

        Manufacturing Carbon Management System Market

        Manufacturing Carbon Management System Market size was valued at USD 1947.8 million in 2024 and is anticipated to reach USD 4055.4 million by 2032, at a CAGR of 9.6% during the forecast period.

        Crypto Currency ATM Market

        The Crypto Currency ATM Market size was valued at USD 422 million in 2024 and is projected to reach USD 1,720 million by 2032, growing at a CAGR of 19.2%.

        Motion Sensors Market

        The Motion Sensor Market size was valued at USD 7198 million in 2024 and is anticipated to reach USD 11664.4 million by 2032, at a CAGR of 6.22% during the forecast period (2024-2032).

        Interactive Display Market

        The Global Interactive Display Market size was valued at USD 32,100.0 million in 2018, reached USD 40,656.9 million in 2024, and is anticipated to reach USD 71,181.5 million by 2032, at a CAGR of 7.30% during the forecast period.

        Interactive And Self-Service Kiosk Market

        The Global Interactive and Self-Service Kiosk Market size was valued at USD 2,320.0 million in 2018 to USD 3,212.1 million in 2024 and is anticipated to reach USD 6,777.0 million by 2032, at a CAGR of 9.90% during the forecast period.

        Hardware As A Service (HaaS) Market

        The Global Hardware as a Service (HaaS) Market size was valued at USD 2,100.0 million in 2018 to USD 4,132.6 million in 2024 and is anticipated to reach USD 16,932.8 million by 2032, at a CAGR of 19.40% during the forecast period.

        Facilities Management Market

        The Global Facilities Management Market size was valued at USD 35,600.0 million in 2018 to USD 64,299.5 million in 2024 and is anticipated to reach USD 226,330.1 million by 2032, at a CAGR of 17.10% during the forecast period.

        Inside Sales Software Market

        The Inside Sales Software Market size was valued at USD 8019.6 million in 2024 and is anticipated to reach USD 17442.4 million by 2032, at a CAGR of 10.2% during the forecast period (2024-2032).

        Harbor Management Software Market

        The Harbor Management Software market was valued at USD 1,725.4 million in 2024 and is projected to reach USD 3,540.2 million by 2032, growing at a CAGR of 9.4% during the forecast period.

        Handheld Chemical and Metal Detector Market

        Handheld Chemical and Metal Detector Market size stood at USD 3,545.3 million in 2024 and is projected to reach USD 7,823.6 million by 2032, registering a CAGR of 10.4% during the forecast period.

        Digital Risk Management Market

        The Digital Risk Management Market size was valued at USD 7213.4 million in 2024 and is anticipated to reach USD 19312.6 million by 2032, at a CAGR of 13.1% during the forecast period (2024-2032).

        Purchase Options

        The report comes as a view-only PDF document, optimized for individual clients. This version is recommended for personal digital use and does not allow printing. Use restricted to one purchaser only.
        $4999

        To meet the needs of modern corporate teams, our report comes in two formats: a printable PDF and a data-rich Excel sheet. This package is optimized for internal analysis. Unlimited users allowed within one corporate location (e.g., regional office).
        $6999

        The report will be delivered in printable PDF format along with the report’s data Excel sheet. This license offers 100 Free Analyst hours where the client can utilize Credence Research Inc. research team. Permitted for unlimited global use by all users within the purchasing corporation, such as all employees of a single company.
        $12999

        Credence Staff 3

        WILLIAM, North America

        Support Staff at Credence Research

        KEITH PHILLIPS, Europe

        Lee - CR Sales Staff

        LEE VALLANCE, Asia Pacific

        Kieran Jameson

        KIERAN JAMESON, Australia

        Report delivery within 24 to 48 hours

        User Review

        Thank you for the data! The numbers are exactly what we asked for and what we need to build our business case.

        Materials Scientist
        (privacy requested)

        User Review

        The report was an excellent overview of the Industrial Burners market. This report does a great job of breaking everything down into manageable chunks.

        Imre Hof
        Management Assistant, Bekaert

        cr-clients-logos

        Request Sample