Facilities Management Market By Solutions (Facility Operations And Security Management, Facility Environment Management, Facility Property Management), By Services (Deployment And Integration, Consulting, Support And Maintenance), By Deployment (Cloud, On-Premise), By Organization Size (Large Enterprises, Smes), By Vertical (Retail, Healthcare, Construction, Energy & Utilities, Manufacturing, Education, Government, Others) – Growth, Future Prospects And Competitive Analysis, 2019 – 2027

Report ID: 6066 | Report Format : Excel, PDF

Increasing Requirements for Maintaining Environmental and Regulatory Compliance Has Increased the Demand for Facilities Management Market

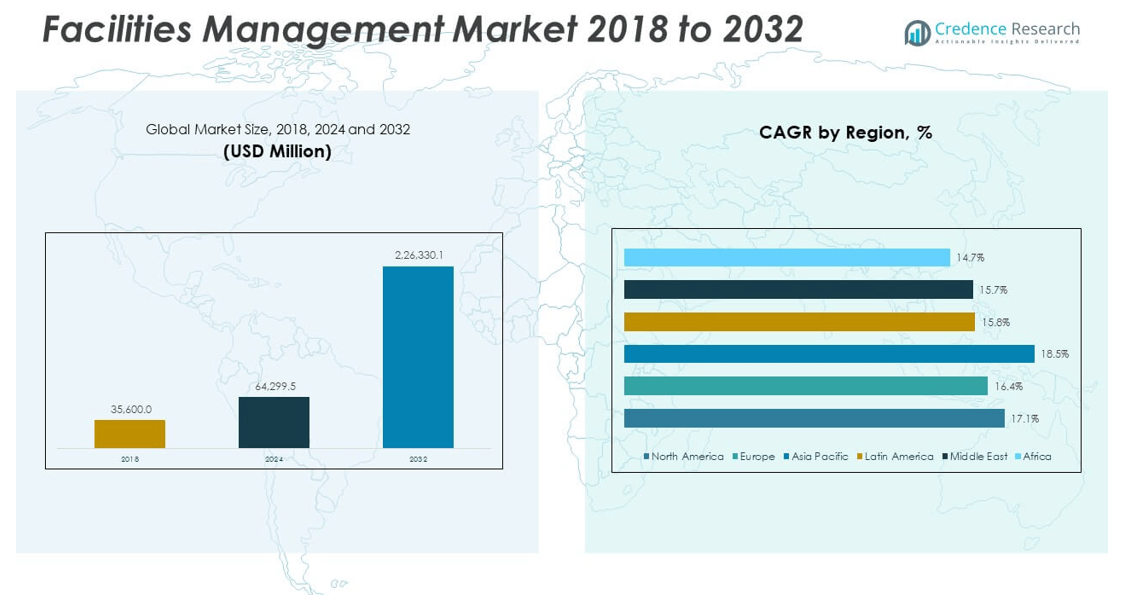
Globally, the facilities management market is expected to grow with a CAGR of 13.60% during the forecast period from 2019 to 2027 and has registered a market value of US$ 33.60 Bn by 2018. Facilities management is defined as an organizational functioning that integrates the premises, individuals, and processes within a facility to improve the productivity of the core business. In addition, the facility management services ensure the facility environment’s safety, comfort, and efficiency. Moreover, facility management is categorized into hard and soft facilities management.

Hard facilities management deals with an organization’s physical assets, including machinery functionality, elevators, air conditioning, and others. Whereas soft facilities management aims toward the tasks performed by an individual such as accounting, custodial services, catering, and others. With the increasing environmental and regulatory compliances, the companies and organizations have to maintain the data of the work, health, material usage, and others within the premise. Moreover, these regulations are one of the major factors driving the global growth of the market. Moreover, the rising infrastructure and facilities development is also considered a major factor driving the market globally.

Access crucial information at unmatched prices!

Request your sample report today & start making informed decisions powered by Credence Research Inc.!

Download Sample

Market Synopsis

Facilities Management with Integrated Workplace Management System in its Solutions Segment Continue Dominating the Market

In 2018, the overall facilities management market was led by the integrated workplace management system segment contributed a high percentage of around 20% of the market share of the total revenue generated globally 2018. This segment is expected to grow with a significant CAGR during the forecast period. The integrated workplace management system is a software solution that reduces the facility’s maintenance cost, offers flexibility and transparency, and increases the work efficiency of an organization’s overall business.

North America Dominates the Market by Region

The global facilities management market was led by North America, with a market share of more than 30.0% in 2018. The region is one of the earliest adopters of technology, and the increasing adoption of government and private enterprises in the region is one factor driving the market growth. US accounts for the largest market share in the region due to the presence of various IT, BFSI, manufacturing, automotive, and other companies that are adopting the facilities management software to reduce increase the productivity of the facility and reduce the overall cost for the functionality.

Some prominent players operating in facilities management are CA Technologies, Archibus Inc., FM System Inc., iOffice Corporation, IBM Corporation, Oracle Corporation, SAP SE, Planon Corporation, Satnav Technologies, Indus Systems, Trimble Navigation Ltd, and Autodesk Inc.

Historical & Forecast Period

This research report presents the analysis of each segment from 2017 to 2027, considering 2018 as the base year for the research. In addition, compounded Annual Growth Rate (CAGR) for each respective segment was calculated for the forecast period from 2019 to 2027.

Shape Your Report to Specific Countries or Regions & Enjoy 30% Off!

Report Scope by Segments

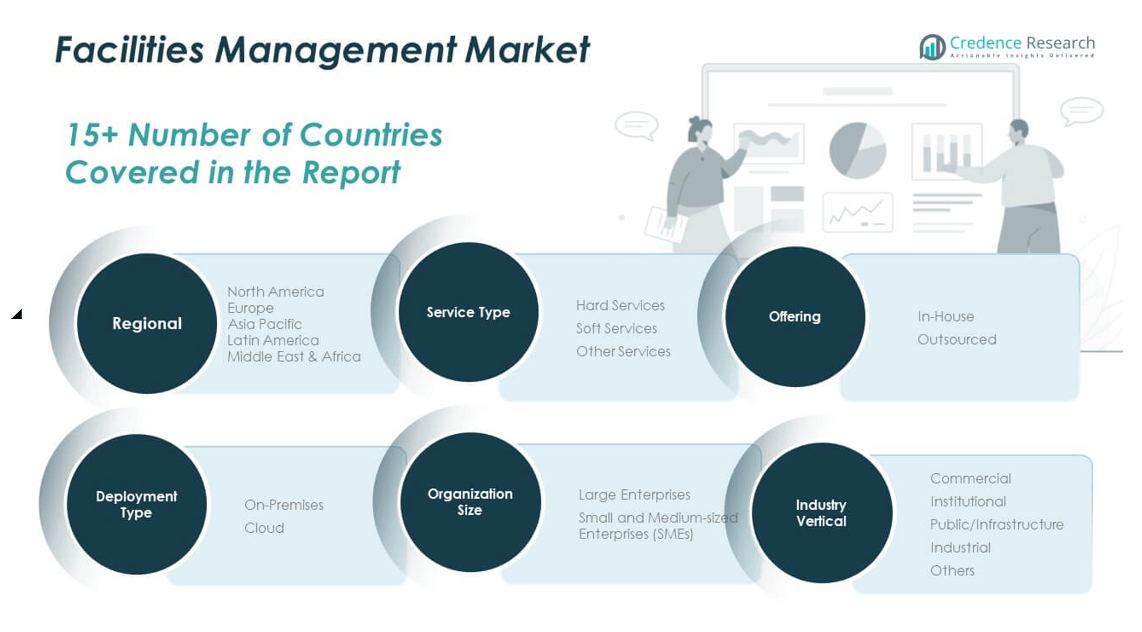
The Facilities Management market report provides market size and estimates based on market dynamics and key trends observed in the industry. In addition, the report provides a holistic view of the global facilities management market based on solutions, services, organization size, deployment, verticals, and geography.

Chapter 1 Preface
1.1 Report Description
1.1.1 Purpose of the Report
1.1.2 Target Audience
1.1.3 USP and Key Offerings
1.2 Research Scope
1.3 Market Segmentation
1.4 Research Methodology
1.4.1 Phase I – Secondary Research
1.4.2 Phase II – Primary Research
1.4.3 Phase III – Expert Panel Review
1.4.4 Assumptions
1.4.5 Approach Adopted

Chapter 2 Executive Summary
2.1 Market Snapshot: Global FM Market
2.2 Global FM Market, By Solutions, 2018 (US$ Bn)
2.3 Global FM Market, By Deployment, 2018 (US$ Bn)
2.4 Global FM Market, By Organization Size, 2018 (US$ Bn)
2.5 Global FM Market, By Services, 2018 (US$ Bn)
2.6 Global FM Market, By Vertical, 2018 (US$ Bn)
2.7 Global FM Market, By Geography, 2018 (US$ Bn)

Chapter 3 Market Dynamics
3.1 Introduction
3.1.1 Global FM Market Value, 2017 – 2027, (US$ Bn)
3.2 Market Drivers
3.3 Market Growth Inhibitors
3.3.1 Impact Analysis of Drivers and Restraints
3.4 Key Market Trends
3.5 Attractive Investment Proposition, by Geography, 2018
3.6 Competitive Analysis
3.6.1 Market Positioning of Key FM Vendors, 2018
3.6.2 Key Strategies Adopted by the Leading Players

Chapter 4 Global Facilities Management (FM) Market Analysis, by Solutions, 2017 – 2027 (US$ Bn)
4.1 Overview
4.2 Integrated Workplace Management System
4.3 Building Information Modeling
4.4 Facility Operations and Security Management
4.5 Facility Environment Management
4.6 Facility Property Management

Chapter 5 Global Facilities Management (FM) Market Analysis, by Services, 2017 – 2027 (US$ Bn)
5.1 Overview
5.2 Deployment and Integration
5.3 Consulting
5.4 Auditing and Quality Assessment
5.5 Support and Maintenance

Chapter 6 Global Facilities Management (FM) Market Analysis, by Deployment, 2017 – 2027 (US$ Bn)
6.1 Overview
6.2 Cloud
6.3 On-Premise

Chapter 7 Global Facilities Management (FM) Market Analysis, by Organization Size, 2017 – 2027 (US$ Bn)
7.1 Overview
7.2 Large Enterprises
7.3 SMEs

Chapter 8 Global Facilities Management (FM) Market Analysis, by Vertical, 2017 – 2027 (US$ Bn)
8.1 Overview
8.2 BFSI
8.3 Retail
8.4 Healthcare
8.5 IT & Telecom
8.6 Construction
8.7 Energy & Utilities
8.8 Manufacturing
8.9 Education
8.10 Government
8.11 Others

Chapter 9 North America Facilities Management (FM) Market Analysis, 2017 – 2027 (US$ Bn)
9.1 Overview
9.2 North America FM Market Analysis, By Solutions, 2017 – 2027
9.2.1 Market Analysis
9.3 North America FM Market Analysis, By Deployment, 2017 – 2027
9.3.1 Market Analysis
9.4 North America FM Market Analysis, By Organization Size, 2017 – 2027
9.4.1 Market Analysis
9.5 North America FM Market Analysis, By Services, 2017 – 2027
9.5.1 Market Analysis
9.6 North America FM Market Analysis, By Vertical, 2017 – 2027
9.6.1 Market Analysis
9.7 North America FM Market Analysis, By Region/Country, 2017 – 2027
9.7.1 U.S.
9.7.1.1 U.S. FM Market Value, By Solutions, 2017 – 2027 (US$ Bn)
9.7.1.2 U.S. FM Market Value, By Deployment, 2017 – 2027 (US$ Bn)
9.7.1.3 U.S. FM Market Value, By Organization Size, 2017 – 2027 (US$ Bn)
9.7.1.4 U.S. FM Market Value, By Services, 2017 – 2027 (US$ Bn)
9.7.1.5 U.S. FM Market Value, By Vertical, 2017 – 2027 (US$ Bn)
9.7.2 Rest of North America
9.7.2.1 Rest of North America FM Market Value, By Solutions, 2017 – 2027 (US$ Bn)
9.7.2.2 Rest of North America FM Market Value, By Deployment, 2017 – 2027 (US$ Bn)
9.7.2.3 Rest of North America FM Market Value, By Organization Size, 2017 – 2027 (US$ Bn)
9.7.2.4 Rest of North America FM Market Value, By Services, 2017 – 2027 (US$ Bn)
9.7.2.5 Rest of North America FM Market Value, By Vertical, 2017 – 2027 (US$ Bn)

Chapter 10 Europe Facilities Management (FM) Market Analysis, 2017 – 2027 (US$ Bn)
10.1 Overview
10.2 Europe FM Market Analysis, By Solutions, 2017 – 2027
10.2.1 Market Analysis
10.3 Europe FM Market Analysis, By Deployment, 2017 – 2027
10.3.1 Market Analysis
10.4 Europe FM Market Analysis, By Organization Size, 2017 – 2027
10.4.1 Market Analysis
10.5 Europe FM Market Analysis, By Services, 2017 – 2027
10.5.1 Market Analysis
10.6 Europe FM Market Analysis, By Vertical, 2017 – 2027
10.6.1 Market Analysis
10.7 Europe FM Market Analysis, By Region/Country, 2017 – 2027
10.7.1 U.K.
10.7.1.1 U.K. FM Market Value, By Solutions, 2017 – 2027 (US$ Bn)
10.7.1.2 U.K.FM Market Value, By Deployment, 2017 – 2027 (US$ Bn)
10.7.1.3 U.K.FM Market Value, By Organization Size, 2017 – 2027 (US$ Bn)
10.7.1.4 U.K.FM Market Value, By Services, 2017 – 2027 (US$ Bn)
10.7.1.5 U.K.FM Market Value, By Vertical, 2017 – 2027 (US$ Bn)
10.7.2 Germany
10.7.2.1 Germany FM Market Value, By Solutions, 2017 – 2027 (US$ Bn)
10.7.2.2 Germany FM Market Value, By Deployment, 2017 – 2027 (US$ Bn)
10.7.2.3 Germany FM Market Value, By Organization Size, 2017 – 2027 (US$ Bn)
10.7.2.4 Germany FM Market Value, By Services, 2017 – 2027 (US$ Bn)
10.7.2.5 Germany FM Market Value, By Vertical
10.7.3 France
10.7.3.1 France FM Market Value, By Vertical, 2017 – 2027 (US$ Bn)
10.7.3.2 France FM Market Value, By Deployment, 2017 – 2027 (US$ Bn)
10.7.3.3 France FM Market Value, By Organization Size, 2017 – 2027 (US$ Bn)
10.7.3.4 France FM Market Value, By Services, 2017 – 2027 (US$ Bn)
10.7.3.5 France FM Market Value, By Vertical, 2017 – 2027 (US$ Bn)
10.7.4 Rest of Europe
10.7.4.1 Rest of Europe FM Market Value, By Solutions, 2017 – 2027 (US$ Bn)
10.7.4.2 Rest of Europe FM Market Value, By Deployment, 2017 – 2027 (US$ Bn)
10.7.4.3 Rest of Europe FM Market Value, By Organization Size, 2017 – 2027 (US$ Bn)
10.7.4.4 Rest of Europe FM Market Value, By Services, 2017 – 2027 (US$ Bn)
10.7.4.5 Rest of Europe FM Market Value, By Vertical, 2017 – 2027 (US$ Bn)

Chapter 11 Asia Pacific Facilities Management (FM) Market Analysis, 2017 – 2027 (US$ Bn)
11.1 Overview
11.2 Asia Pacific FM Market Analysis, By Solutions, 2017 – 2027
11.2.1 Market Analysis
11.3 Asia Pacific FM Market Analysis, By Deployment, 2017 – 2027
11.3.1 Market Analysis
11.4 Asia Pacific FM Market Analysis, By Organization Size, 2017 – 2027
11.4.1 Market Analysis
11.5 Asia Pacific FM Market Analysis, By Services, 2017 – 2027
11.5.1 Market Analysis
11.6 Asia Pacific FM Market Analysis, By Vertical, 2017 – 2027
11.6.1 Market Analysis
11.7 Asia Pacific FM Market Analysis, By Region/Country, 2017 – 2027
11.7.1 China
11.7.1.1 China FM Market Value, By Solutions, 2017 – 2027 (US$ Bn)
11.7.1.2 China FM Market Value, By Deployment, 2017 – 2027 (US$ Bn)
11.7.1.3 China FM Market Value, By Organization Size, 2017 – 2027 (US$ Bn)
11.7.1.4 China FM Market Value, By Services, 2017 – 2027 (US$ Bn)
11.7.1.5 China FM Market Value, By Vertical, 2017 – 2027 (US$ Bn)
11.7.2 Japan
11.7.2.1 Japan FM Market Value, By Solutions, 2017 – 2027 (US$ Bn)
11.7.2.2 Japan FM Market Value, By Deployment, 2017 – 2027 (US$ Bn)
11.7.2.3 JapanFM Market Value, By Organization Size, 2017 – 2027 (US$ Bn)
11.7.2.4 Japan FM Market Value, By Services, 2017 – 2027 (US$ Bn)
11.7.2.5 Japan FM Market Value, By Vertical, 2017 – 2027 (US$ Bn)
11.7.3 India
11.7.3.1 India FM Market Value, By Solutions, 2017 – 2027 (US$ Bn)
11.7.3.2 India FM Market Value, By Deployment, 2017 – 2027 (US$ Bn)
11.7.3.3 India FM Market Value, By Organization Size, 2017 – 2027 (US$ Bn)
11.7.3.4 India FM Market Value, By Services, 2017 – 2027 (US$ Bn)
11.7.3.5 India FM Market Value, By Vertical, 2017 – 2027 (US$ Bn)
11.7.4 Rest of Asia Pacific
11.7.4.1 Rest of Asia Pacific FM Market Value, By Solutions, 2017 – 2027 (US$ Bn)
11.7.4.2 Rest of Asia Pacific FM Market Value, By Deployment, 2017 – 2027 (US$ Bn)
11.7.4.3 Rest of Asia Pacific FM Market Value, By Organization Size, 2017 – 2027 (US$ Bn)
11.7.4.4 Rest of Asia-Pacific FM Market Value, By Services, 2017 – 2027 (US$ Bn)
11.7.4.5 Rest of Asia-Pacific FM Market Value, By Vertical, 2017 – 2027 (US$ Bn)

Chapter 12 Rest of the World (RoW) Facilities Management (FM) Market Analysis, 2017 – 2027 (US$ Bn)
12.1 Overview
12.2 RoW FM Market Analysis, By Solutions, 2017 – 2027
12.2.1 Market Analysis
12.3 RoW FM Market Analysis, By Deployment, 2017 – 2027
12.3.1 Market Analysis
12.4 RoW FM Market Analysis, By Organization Size, 2017 – 2027
12.4.1 Market Analysis
12.5 RoW FM Market Analysis, By Services, 2017 – 2027
12.5.1 Market Analysis
12.6 RoW FM Market Analysis, By Vertical, 2017 – 2027
12.6.1 Market Analysis
12.7 RoW FM Market Analysis, By Region/Country, 2017 – 2027
12.7.1 Middle East & Africa (MEA)
12.7.1.1 MEA FM Market Value, By Solutions, 2017 – 2027 (US$ Bn)
12.7.1.2 MEA FM Market Value, By Deployment, 2017 – 2027 (US$ Bn)
12.7.1.3 MEA FM Market Value, By Organization Size, 2017 – 2027 (US$ Bn)
12.7.1.4 MEA FM Market Value, By Services, 2017 – 2027 (US$ Bn)
12.7.1.5 MEA FM Market Value, By Vertical, 2017 – 2027 (US$ Bn)
12.7.2 Latin America
12.7.2.1 Latin America FM Market Value, By Solutions, 2017 – 2027 (US$ Bn)
12.7.2.2 Latin America FM Market Value, By Deployment, 2017 – 2027 (US$ Bn)
12.7.2.3 Latin America FM Market Value, By Organization Size, 2017 – 2027 (US$ Bn)
12.7.2.4 Latin America FM Market Value, By Services, 2017 – 2027 (US$ Bn)
12.7.2.5 Latin America FM Market Value, By Vertical, 2017 – 2027 (US$ Bn)

Chapter 13 Company Profiles
13.1 Archibus Inc.
13.2 CA Technologies
13.3 FM System Inc.
13.4 IBM Corporation
13.5 iOffice Corporation
13.6 Oracle Corporation
13.7 Planon Corporation
13.8 SAP SE
13.9 Satnav Technologies
13.10 Trimble Navigation Ltd
13.11 Indus Systems
13.12 Autodesk Inc.

List of Figures

FIG. 1 Global Facilities Management (FM): Market Segmentation
FIG. 2 Global FM Market: Research Methodology
FIG. 3 Top-Down and Bottom Up Approach
FIG. 4 Global FM Market, By Solutions, 2018 (US$ Bn)
FIG. 5 Global FM Market, By Deployment, 2018 (US$ Bn)
FIG. 6 Global FM Market, By Organization Size, 2018 (US$ Bn)
FIG. 7 Global FM Market, By Services, 2018 (US$ Bn)
FIG. 8 Global FM Market, By Vertical, 2018 (US$ Bn)
FIG. 9 Global FM Market, By Geography, 2018 (US$ Bn)
FIG. 10 Global FM Market Value, 2017 – 2027, (US$ Bn)
FIG. 11 Attractive Investment Proposition, by Geography, 2018
FIG. 12 Market Positioning of Key FMVendors, 2018
FIG. 13 Global FM Market Value Contribution, By Solutions, 2018 & 2027 (%)
FIG. 14 Global Integrated Workplace Management System, FM Market Value, 2017 – 2027, (US$ Bn)
FIG. 15 Global Building Information Modeling, FM Market Value, 2017 – 2027, (US$ Bn)
FIG. 16 Global Facility Operations and Security Management, FM Market Value, 2017 – 2027, (US$ Bn)
FIG. 17 Global Facility Environment Management, FM Market Value, 2017 – 2027, (US$ Bn)
FIG. 18 Global Facility Property Management, FM Market Value, 2017 – 2027, (US$ Bn)
FIG. 19 Global FM Market Value Contribution, By Services, 2018 & 2027 (%)
FIG. 20 Global Deployment and Integration FM Market Value, 2017 – 2027, (US$ Bn)
FIG. 21 Global Consulting, FM Market Value, 2017 – 2027, (US$ Bn)
FIG. 22 Global Auditing and Quality Assessment, FM Market Value, 2017 – 2027, (US$ Bn)
FIG. 23 Global Support and Maintenance, FM Market Value, 2017 – 2027, (US$ Bn)
FIG. 24 Global FM Market Value Contribution, By Deployment, 2018 & 2027 (%)
FIG. 25 Global Cloud, FM, Market Value, 2017 – 2027, (US$ Bn)
FIG. 26 Global On-Premise, FM Market Value, 2017 – 2027, (US$ Bn)
FIG. 27 Global FM Market Value Contribution, By Organization Size, 2018 & 2027 (%)
FIG. 28 Global FM Market Value from Large Enterprises, 2017 – 2027(US$ Bn)
FIG. 29 Global FM Market Value from SMEs, 2017 – 2027(US$ Bn)
FIG. 30 Global FM Market Value Contribution, By Vertical, 2018 & 2027 (%)
FIG. 31 Global FM Market Value from BFSI, 2017 – 2027(US$ Bn)
FIG. 32 Global FM Market Value from Retail, 2017 – 2027(US$ Bn)
FIG. 33 Global FM Market Value from Healthcare, 2017 – 2027 (US$ Bn)
FIG. 34 Global FM Market Value from IT & Telecom, 2017 – 2027 (US$ Bn)
FIG. 35 Global FM Market Value from Construction, 2017 – 2027 (US$ Bn)
FIG. 36 Global FM Market Value from Energy & Utilities, 2017 – 2027 (US$ Bn)
FIG. 37 Global FM Market Value from Manufacturing, 2017 – 2027 (US$ Bn)
FIG. 38 Global FM Market Value from Education, 2017 – 2027 (US$ Bn)
FIG. 39 Global FM Market Value from Government, 2017 – 2027 (US$ Bn)
FIG. 40 Global FM Market Value from Others, 2017 – 2027 (US$ Bn)
FIG. 41 North America FM Market Value, 2017 – 2027, (US$ Bn)
FIG. 42 Europe FM Market Value, 2017 – 2027, (US$ Bn)
FIG. 43 Asia Pacific FM Market Value, 2017 – 2027, (US$ Bn)
FIG. 44 RoWFM Market Value, 2017 – 2027, (US$ Bn)

List of Tables

TABLE 1 Market Snapshot: Global Facilities Management (FM) Market
TABLE 2 Impact Indicators
TABLE 3 Impact Analysis of Drivers and Restraints
TABLE 4 North America FM Market Value, By Solutions, 2017 – 2027(US$ Bn)
TABLE 5 North America FM Market Value, By Deployment, 2017 – 2027(US$ Bn)
TABLE 6 North America FM Market Value, By Organization Size, 2017 – 2027(US$ Bn)
TABLE 7 North America FM Market Value, By Services, 2017 – 2027(US$ Bn)
TABLE 8 North America FM Market Value, By Vertical, 2017 – 2027(US$ Bn)
TABLE 9 North America FM Market Value, By Region/Country, 2017 – 2027 (US$ Bn)
TABLE 10 U.S. FM Market Value, By Solutions, 2017 – 2027 (US$ Bn)
TABLE 11 U.S. FM Market Value, By Deployment, 2017 – 2027 (US$ Bn)
TABLE 12 U.S. FM Market Value, By Organization Size, 2017 – 2027 (US$ Bn)
TABLE 13 U.S. FM Market Value, By Services, 2017 – 2027 (US$ Bn)
TABLE 14 U.S. FM Market Value, By Vertical, 2017 – 2027 (US$ Bn)
TABLE 15 Rest of North America FM Market Value, By Solutions, 2017 – 2027 (US$ Bn)
TABLE 16 Rest of North America FM Market Value, By Deployment, 2017 – 2027 (US$ Bn)
TABLE 17 Rest of North America FM Market Value, By Organization Size, 2017 – 2027 (US$ Bn)
TABLE 18 Rest of North America FM Market Value, By Services, 2017 – 2027 (US$ Bn)
TABLE 19 Rest of North America FM Market Value, By Vertical, 2017 – 2027 (US$ Bn)
TABLE 20 Europe FM Market Value, By Solutions, 2017 – 2027(US$ Bn)
TABLE 21 Europe FM Market Value, By Deployment, 2017 – 2027(US$ Bn)
TABLE 22 Europe FM Market Value, By Organization Size, 2017 – 2027(US$ Bn)
TABLE 23 Europe FM Market Value, By Services, 2017 – 2027(US$ Bn)
TABLE 24 Europe FM Market Value, By Vertical, 2017 – 2027(US$ Bn)
TABLE 25 Europe FM Market Value, By Region/Country, 2017 – 2027 (US$ Bn)
TABLE 26 U.K. FM Market Value, By Solutions, 2017 – 2027 (US$ Bn)
TABLE 27 U.K. FM Market Value, By Deployment, 2017 – 2027 (US$ Bn)
TABLE 28 U.K. FM Market Value, By Organization Size, 2017 – 2027 (US$ Bn)
TABLE 29 U.K. FM Market Value, By Services, 2017 – 2027 (US$ Bn)
TABLE 30 U.K. FM Market Value, By Vertical, 2017 – 2027 (US$ Bn)
TABLE 31 Germany FM Market Value, By Solutions, 2017 – 2027 (US$ Bn)
TABLE 32 Germany FM Market Value, By Deployment, 2017 – 2027 (US$ Bn)
TABLE 33 Germany FM Market Value, By Organization Size, 2017 – 2027 (US$ Bn)
TABLE 34 Germany FM Market Value, By Services, 2017 – 2027 (US$ Bn)
TABLE 35 France FM Market Value, By Solutions, 2017 – 2027 (US$ Bn)
TABLE 36 France FM Market Value, By Deployment, 2017 – 2027 (US$ Bn)
TABLE 37 France FM Market Value, By Organization Size, 2017 – 2027 (US$ Bn)
TABLE 38 France FM Market Value, By Services, 2017 – 2027 (US$ Bn)
TABLE 39 France FM Market Value, By Vertical, 2017 – 2027 (US$ Bn)
TABLE 40 Rest of Europe FM Market Value, By Solutions, 2017 – 2027 (US$ Bn)
TABLE 41 Rest of Europe FM Market Value, By Deployment, 2017 – 2027 (US$ Bn)
TABLE 42 Rest of Europe FM Market Value, By Organization Size, 2017 – 2027 (US$ Bn)
TABLE 43 Rest of Europe FM Market Value, By Services, 2017 – 2027 (US$ Bn)
TABLE 44 Rest of Europe FM Market Value, By Vertical, 2017 – 2027 (US$ Bn)
TABLE 45 Asia Pacific FM Market Value, By Solutions, 2017 – 2027(US$ Bn)
TABLE 46 Asia Pacific FM Market Value, By Deployment, 2017 – 2027(US$ Bn)
TABLE 47 Asia Pacific FM Market Value, By Organization Size, 2017 – 2027(US$ Bn)
TABLE 48 Asia Pacific FM Market Value, By Services, 2017 – 2027(US$ Bn)
TABLE 49 Asia Pacific FM Market Value, By Vertical, 2017 – 2027(US$ Bn)
TABLE 50 Asia Pacific FM Market Value, By Region/Country, 2017 – 2027 (US$ Bn)
TABLE 51 China FM Market Value, By Solutions, 2017 – 2027 (US$ Bn)
TABLE 52 China FM Market Value, By Deployment, 2017 – 2027 (US$ Bn)
TABLE 53 China FM Market Value, By Organization Size, 2017 – 2027 (US$ Bn)
TABLE 54 China FM Market Value, By Services, 2017 – 2027 (US$ Bn)
TABLE 55 China FM Market Value, By Vertical, 2017 – 2027 (US$ Bn)
TABLE 56 Japan FM Market Value, By Solutions, 2017 – 2027 (US$ Bn)
TABLE 57 Japan FM Market Value, By Deployment, 2017 – 2027 (US$ Bn)
TABLE 58 Japan FM Market Value, By Organization Size, 2017 – 2027 (US$ Bn)
TABLE 59 Japan FM Market Value, By Services, 2017 – 2027 (US$ Bn)
TABLE 60 Japan FM Market Value, By Vertical, 2017 – 2027 (US$ Bn)
TABLE 61 India FM Market Value, By Solutions, 2017 – 2027 (US$ Bn)
TABLE 62 India FM Market Value, By Deployment, 2017 – 2027 (US$ Bn)
TABLE 63 India FM Market Value, By Organization Size, 2017 – 2027 (US$ Bn)
TABLE 64 India FM Market Value, By Services, 2017 – 2027 (US$ Bn)
TABLE 65 India FM Market Value, By Vertical, 2017 – 2027 (US$ Bn)
TABLE 66 Rest of Asia Pacific FM Market Value, By Solutions, 2017 – 2027 (US$ Bn)
TABLE 67 Rest of Asia Pacific FM Market Value, By Deployment, 2017 – 2027 (US$ Bn)
TABLE 68 Rest of Asia Pacific FM Market Value, By Organization Size, 2017 – 2027 (US$ Bn)
TABLE 69 Rest of Asia-Pacific FM Market Value, By Services, 2017 – 2027 (US$ Bn)
TABLE 70 Rest of Asia-Pacific FM Market Value, By Vertical, 2017 – 2027 (US$ Bn)
TABLE 71 RoW FM Market Value, By Solutions, 2017 – 2027(US$ Bn)
TABLE 72 RoW FM Market Value, By Deployment, 2017 – 2027(US$ Bn)
TABLE 73 RoW FM Market Value, By Organization Size, 2017 – 2027(US$ Bn)
TABLE 74 RoW FM Market Value, By Services, 2017 – 2027(US$ Bn)
TABLE 75 RoW FM Market Value, By Vertical, 2017 – 2027(US$ Bn)
TABLE 76 RoW FM Market Value, By Region/Country, 2017 – 2027 (US$ Bn)
TABLE 77 MEA FM Market Value, By Solutions, 2017 – 2027 (US$ Bn)
TABLE 78 MEA FM Market Value, By Deployment, 2017 – 2027 (US$ Bn)
TABLE 79 MEA FM Market Value, By Organization Size, 2017 – 2027 (US$ Bn)
TABLE 80 MEA FM Market Value, By Services, 2017 – 2027 (US$ Bn)
TABLE 81 MEA FM Market Value, By Vertical, 2017 – 2027 (US$ Bn)
TABLE 82 Latin America FM Market Value, By Solutions, 2017 – 2027 (US$ Bn)
TABLE 83 Latin America FM Market Value, By Deployment, 2017 – 2027 (US$ Bn)
TABLE 84 Latin America FM Market Value, By Organization Size, 2017 – 2027 (US$ Bn)
TABLE 85 Latin America FM Market Value, By Services, 2017 – 2027 (US$ Bn)
TABLE 86 Latin America FM Market Value, By Vertical, 2017 – 2027 (US$ Bn)
TABLE 87 Archibus Inc.: Company Snapshot (Company Details, Geographical Presence, Product Portfolio,Recent Developments)
TABLE 88 CA Technologies: Company Snapshot (Company Details, Geographical Presence, Product Portfolio,Recent Developments)
TABLE 89 FM System Inc.: Company Snapshot (Company Details, Geographical Presence, Product Portfolio,Recent Developments)
TABLE 90 IBM Corporation: Company Snapshot (Company Details, Geographical Presence, Product Portfolio,Recent Developments)
TABLE 91 iOffice Corporation: Company Snapshot (Company Details, Geographical Presence, Product Portfolio,Recent Developments)
TABLE 92 Oracle Corporation: Company Snapshot (Company Details, Geographical Presence, Product Portfolio,Recent Developments)
TABLE 93 Planon Corporation: Company Snapshot (Company Details, Geographical Presence, Product Portfolio,Recent Developments)
TABLE 94 SAP SE: Company Snapshot (Company Details, Geographical Presence, Product Portfolio,Recent Developments)
TABLE 95 Satnav Technologies: Company Snapshot (Company Details, Geographical Presence, Product Portfolio,Recent Developments)
TABLE 96 Trimble Navigation Ltd: Company Snapshot (Company Details, Geographical Presence, Product Portfolio,Recent Developments)
TABLE 97 Indus Systems.: Company Snapshot (Company Details, Geographical Presence, Product Portfolio,Recent Developments)
TABLE 98 Autodesk Inc.: Company Snapshot (Company Details, Geographical Presence, Product Portfolio,Recent Developments)

Ready to Transform Data into Decisions?

Request Your Sample Report and Start Your Journey of Informed Choices


Providing the strategic compass for industry titans.

cr-clients-logos
Request Free Sample

Frequently Asked Questions

What is the size of Facilities Management Market?

The market for Facilities Management is expected to reach USD XX Mn by 2027.

What is the Facilities Management Market CAGR?

The Facilities Management market is expected to see significant CAGR growth over the coming years, at 13.60%.

What is the Forecast period considered for Facilities Management Market?

The report is forecasted from 2019-2027.

What is the base year considered for Facilities Management Market?

The base year of this report is 2018.

Who are the major players in this market?

Archibus Inc., CA Technologies, FM System Inc., IBM Corporation, iOffice Corporation, Oracle Corporation, Planon Corporation, SAP SE, Satnav Technologies, Trimble Navigation Ltd. are some of the major players in the global market.

About Author

Sushant Phapale

Sushant Phapale

ICT & Automation Expert

Sushant is an expert in ICT, automation, and electronics with a passion for innovation and market trends.

View Profile

North America Facilities Management Market

The North America Facilities Management Market size was valued at USD 265.53 million in 2018 to USD 388.53 million in 2024 and is anticipated to reach USD 641.86 million by 2032, at a CAGR of 6.03% during the forecast period.

Laundry For Healthcare Facilities Market

Laundry For Healthcare Facilities Market size was valued at USD 5825.58 million in 2024 and is anticipated to reach USD 8805.7 million by 2032, at a CAGR of 5.3% during the forecast period (2024-2032).

North America Golf Training Aids Market

The North America Golf Training Aids Market size was valued at USD 141.11 million in 2018 to USD 197.88 million in 2024 and is anticipated to reach USD 289.77 million by 2032, at a CAGR of 4.80% during the forecast period.

U.K. Golf Training Aids Market

The U.K. Golf Training Aids Market size was valued at USD 28.24 million in 2018 to USD 44.18 million in 2024 and is anticipated to reach USD 65.44 million by 2032, at a CAGR of 5.06% during the forecast period.

Europe Golf Club Market

The Europe Golf Club Market size was valued at USD 746.64 million in 2018 to USD 888.17 million in 2024 and is anticipated to reach USD 1,155.70 million by 2032, at a CAGR of 3.35% during the forecast period.

Europe Golf Training Aids Market

The Europe Golf Training Aids Market size was valued at USD 164.19 million in 2018 to USD 237.18 million in 2024 and is anticipated to reach USD 361.56 million by 2032, at a CAGR of 5.40% during the forecast period.

Ketamine Treatment Market

The ketamine treatment market is projected to grow from USD 1,280.3 million in 2024 to USD 3,526 million by 2032, registering a CAGR of 13.5% during the forecast period.

Commercial Distribution Panel Market

The Commercial distribution panel market size was valued at USD 2,802.5 million in 2024 and is anticipated to reach USD 4300.9  million by 2032, at a CAGR of 5.5 % during the forecast period (2024-2032).

Clinical Informatics Market

Clinical Informatics Market size was valued at USD 83.15 million in 2018 to USD 174.07 million in 2024 and is anticipated to reach USD 596.09 million by 2032, at a CAGR of 15.51% during the forecast period.

Corporate Performance Management Market

The Corporate Performance Management Market size was valued at USD 9529.7 million in 2024 and is anticipated to reach USD 25514.1 million by 2032, at a CAGR of 13.1% during the forecast period (2024-2032).

End User Experience Monitoring Market

The End User Experience Monitoring (EUEM) Market size was valued at USD 3890.5 million in 2024 and is anticipated to reach USD 12321.4 million by 2032, growing at a CAGR of 15.5% during the forecast period.

Composite AI Market

The Global Composite AI Market size was valued at USD 1,847.20 million in 2018 to USD 11,791.70 million in 2024 and is anticipated to reach USD 1,39,634.72 million by 2032, at a CAGR of 36.20% during the forecast period.

Cloud Social Media Management Market

The Global Cloud Social Media Management Market size was valued at USD 4,335.18 million in 2018 to USD 8,453.98 million in 2024 and is anticipated to reach USD 23,463.33 million by 2032, at a CAGR of 12.68% during the forecast period.

Canada Telecommunication Services Market

The Canada Telecommunication Services Market size was valued at USD 42,325.05 million in 2018 to USD 52,251.2 million in 2024 and is anticipated to reach USD 73,791.98 million by 2032, at a CAGR of 4.41% during the forecast period.

Connected Baby Monitor Market

The Global Connected Baby Monitor Market size was valued at USD 800.28 million in 2018 to USD 1,370.37 million in 2024 and is anticipated to reach USD 2,910.31 million by 2032, at a CAGR of 9.20% during the forecast period.

Enterprise Wireless Local Area Network (WLAN) Market

The Enterprise Wireless Local Area Network (WLAN) market was valued at USD 8,060.4 million in 2024. It is projected to grow to USD 21,428.1 million by 2032, reflecting a compound annual growth rate (CAGR) of 13% over the forecast period.

Travel Technology Solutions Market

The Travel Technology Solutions Market size was valued at USD 9308 million in 2024 and is anticipated to reach USD 19664.1 million by 2032, at a CAGR of 9.8% during the forecast period (2024-2032).

Explosive Detectors Market

The Explosive Detectors Market size was valued at USD 11214.2 million in 2024 and is anticipated to reach USD 27765.9 million by 2032, at a CAGR of 12% during the forecast period (2024-2032).

Live Streaming Market

The live streaming market size was valued at USD 79554.6 million in 2024 and is anticipated to reach USD 214504.7 million by 2032, at a CAGR of 13.2 % during the forecast period (2024-2032).

Distributed Antenna Systems Market

Distributed Antenna Systems (DAS) Market size was valued at USD 2809 million in 2024 and is anticipated to reach USD 5597.1 million by 2032, at a CAGR of 9% during the forecast period.

Image Processing Systems Market

The Image Processing Systems Market size was valued at USD 13646 million in 2024 and is anticipated to reach USD 26208.6 million by 2032, at a CAGR of 8.5% during the forecast period (2024-2032).

Purchase Options

The report comes as a view-only PDF document, optimized for individual clients. This version is recommended for personal digital use and does not allow printing.
$4699

To meet the needs of modern corporate teams, our report comes in two formats: a printable PDF and a data-rich Excel sheet. This package is optimized for internal analysis and multi-location access, making it an excellent choice for organizations with distributed workforce.
$5699

The report will be delivered in printable PDF format along with the report’s data Excel sheet. This license offers 100 Free Analyst hours where the client can utilize Credence Research Inc.’s research team. It is highly recommended for organizations seeking to execute short, customized research projects related to the scope of the purchased report.
$12699

Credence Staff 3

WILLIAM, North America

Support Staff at Credence Research

KEITH PHILLIPS, Europe

Lee - CR Sales Staff

LEE VALLANCE, Asia Pacific

Kieran Jameson

KIERAN JAMESON, Australia

Report delivery within 24 to 48 hours

User Review

Thank you for the data! The numbers are exactly what we asked for and what we need to build our business case.

Materials Scientist
(privacy requested)

User Review

The report was an excellent overview of the Industrial Burners market. This report does a great job of breaking everything down into manageable chunks.

Imre Hof
Management Assistant, Bekaert

cr-clients-logos