Market Overview:
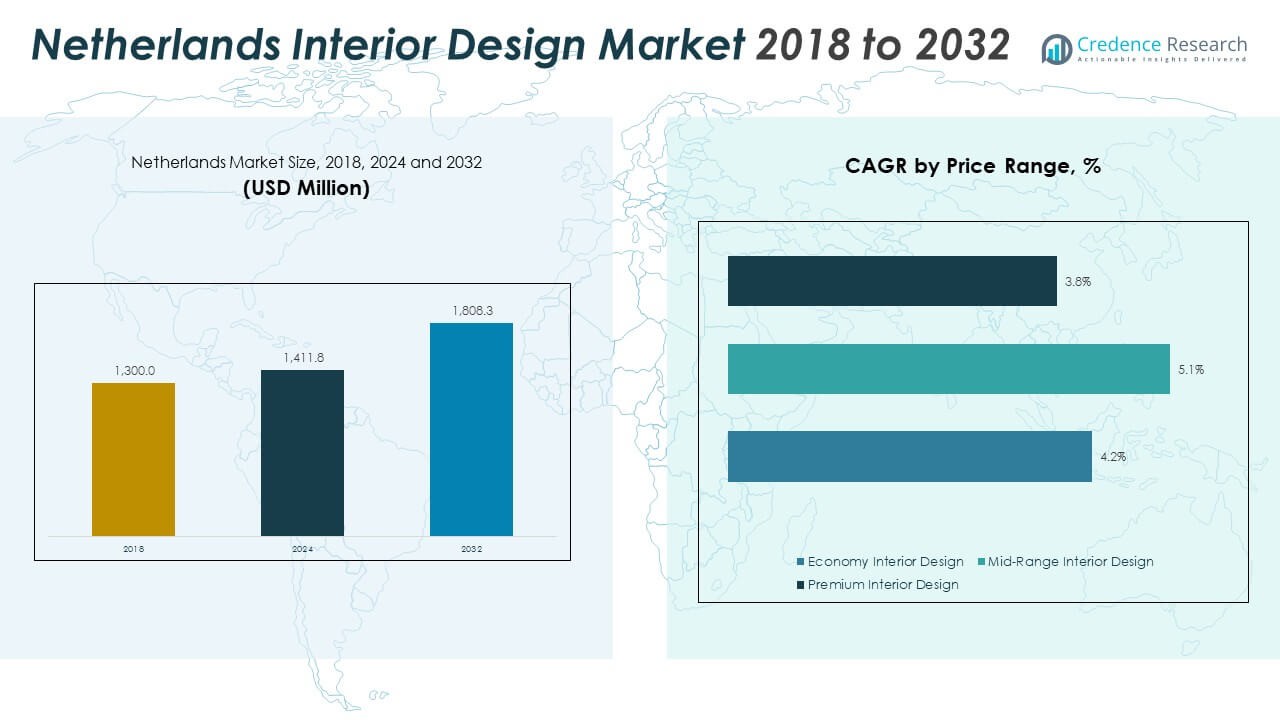
The Netherlands Interior Design Market size was valued at USD 1,300.0 million in 2018 to USD 1,411.8 million in 2024 and is anticipated to reach USD 1,808.3 million by 2032, at a CAGR of 3.20% during the forecast period
| REPORT ATTRIBUTE |
DETAILS |
| Historical Period |
2020-2023 |
| Base Year |
2024 |
| Forecast Period |
2025-2032 |
| Netherlands Interior Design Market Size 2024 |
USD 1,411.8 Million |
| Netherlands Interior Design Market, CAGR |
3.20% |
| Netherlands Interior Design Market Size 2032 |
USD 1,808.3 Million |
Strong housing renovation activity shapes market growth across Dutch cities. Urban buyers seek functional layouts due to compact home sizes, pushing designers to create flexible spaces. Retail and hospitality units invest in themed interiors to lift customer experience. Office operators redesign workspaces to support hybrid routines and improve staff comfort. Energy-efficient materials gain traction due to national sustainability goals. Smart lighting, modular furniture, and eco-certified décor support new projects across the country. These shifts help designers meet evolving preferences for comfort and style.
Regional demand stays strong across the Randstad, driven by dense populations and higher project volumes. Amsterdam leads with frequent commercial upgrades, while Rotterdam grows through steady residential conversions. Utrecht gains traction from mixed-use development and rising student housing projects. Cities in the southern provinces show opportunities due to expanding suburban projects. Northern areas remain slower but offer potential through government-backed modernization plans. This geographic mix supports long-term interior design activity across the nation.
Access crucial information at unmatched prices!
Request your sample report today & start making informed decisions powered by Credence Research Inc.!
Download Sample
Market Insights:
- The Netherlands Interior Design Market grew from USD 1,300.0 million in 2018 to USD 1,411.8 million in 2024 and is projected to reach USD 1,808.3 million by 2032, supported by a steady CAGR of 3.20%.
- The Randstad region leads with 48% share, driven by dense populations and high renovation cycles, followed by the Southern region at 30% due to strong suburban growth, and the Northern & Eastern regions at 22%, supported by public building upgrades and university housing demand.
- The Southern region is the fastest-growing, holding 30% share, supported by innovation clusters in Eindhoven, rising suburban housing development, and increasing demand for hybrid workspace layouts.
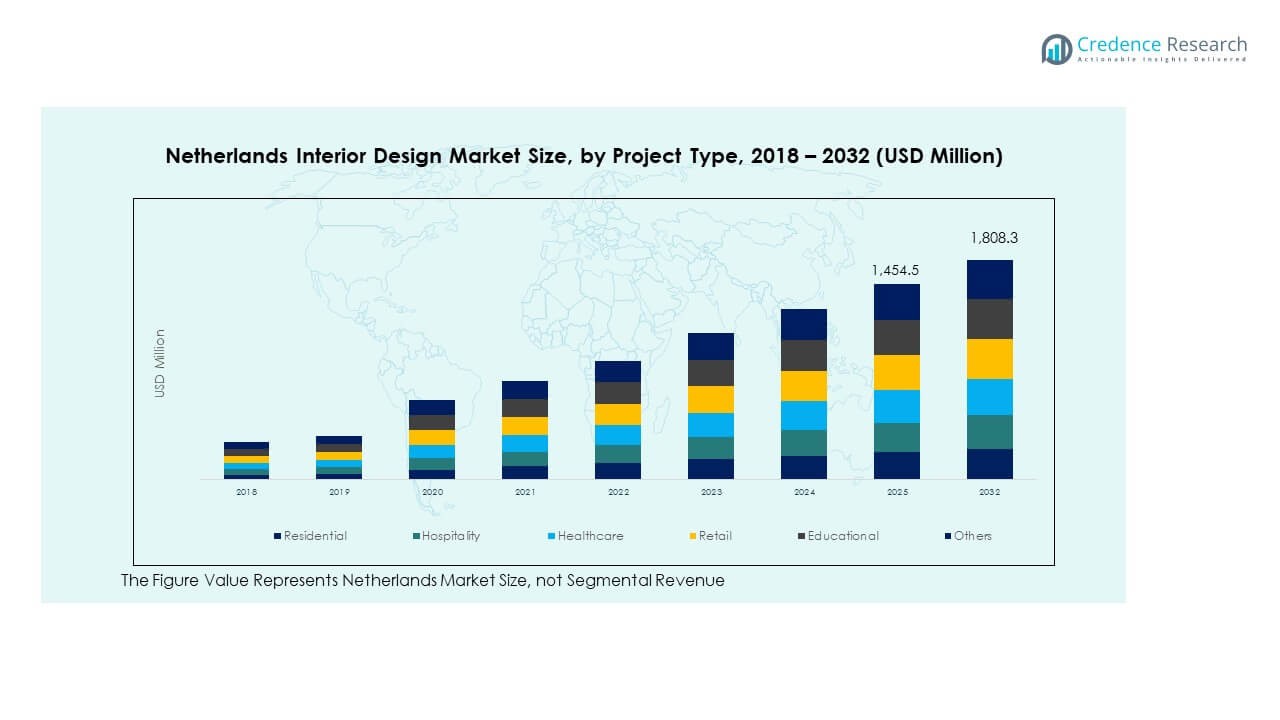
- Residential projects dominate the segment structure in the chart with an estimated 35% share, supported by frequent home upgrades and compact urban living requirements.
- Retail and hospitality together represent an estimated 32% share in the visual distribution, reflecting strong brand-driven redesign activity and steady commercial refurbishment across major Dutch cities.
Market Drivers:
Growing Demand for Functional and Aesthetic Living Environments
Rising interest in flexible layouts drives strong momentum in the Netherlands Interior Design Market. Homeowners want spaces that support both work and leisure. Designers focus on compact rooms due to dense urban zones. Sustainable materials shape buying choices across new projects. Smart lighting upgrades gain traction in renovated homes. Retail units invest in branded themes to improve footfall. It pushes steady innovation in space planning. Firms adopt technology to shorten project cycles.
- For instance, IKEA Netherlands has responded to this demand by launching its KAJPLATS smart bulb range in November 2025, comprising 11 variations with adjustable color and white spectrum options, delivering lumen outputs ranging from 470 to 1,521 lumens with dimmable functionality, enabling homeowners to create versatile lighting environments that transition seamlessly between work and relaxation modes.
Rising Renovation Cycles Across Residential and Commercial Sectors
Frequent renovation cycles strengthen demand across major Dutch cities. Older housing stock encourages a shift toward modern designs. Commercial units refresh interiors to build strong customer engagement. Hospitality players invest in themed décor to maintain brand appeal. Local offices focus on hybrid work layouts to lift productivity. Designers push ergonomic solutions for staff comfort. It keeps the market active across dense business districts. New materials support faster and cleaner upgrades.
- For instance, IKEA Amsterdam completed a comprehensive store transformation in February 2024, eliminating its external 7,800-square-meter warehouse through implementation of vertical storage systems within two state-of-the-art vending machines measuring 8 meters in height and 8.5 meters in diameter, capable of processing 480 orders daily through automated retrieval mechanisms.
Shift Toward Sustainable and Energy-Efficient Interior Choices
Green preferences influence project planning across homes and offices. Buyers prefer energy-saving systems for long-term benefits. Eco-certified décor attracts interest from urban households. Corporate units deploy low-impact materials to meet ESG goals. Designers use recycled elements for modern layouts. Demand grows for natural lighting and insulation support. It aligns with national sustainability programs that influence design activity. Firms adopt ethical sourcing to lift brand trust.
Increasing Influence of Technology and Digital Design Tools
Digital design tools improve planning speed across many projects. Virtual previews guide homeowners through layout decisions. Firms use advanced software to avoid design errors. Smart-home growth supports integrated interior concepts. Designers link automation with comfort-focused layouts. Commercial units deploy sensor-based lighting to lift efficiency. It supports higher accuracy in every stage of design delivery. Technology adoption helps firms handle rising customer expectations.
Market Trends:
Growing Popularity of Minimalist Scandinavian and Dutch Design Aesthetics
Minimalist themes shape new layouts across urban homes. Clean lines create calming interiors in compact spaces. Neutral tones guide most modern concepts in key districts. Buyers want simplicity supported by premium craftsmanship. Commercial units adopt warm materials to enhance footfall. Designers highlight open layouts that improve movement flow. It strengthens visual coherence across new projects in the Netherlands Interior Design Market. Natural textures gain rapid traction across lifestyle spaces.
- For instance, IKEA’s STOCKHOLM 2025 collection, launched in April 2025, comprises the largest collection iteration with 96 thoughtfully designed pieces featuring premium materials including solid woods, handwoven wool rugs with earth-tone palettes, and mouth-blown glass vases reflecting Scandinavian design philosophy and Stockholm’s urban landscape.
Rise of Modular and Customizable Furniture Solutions
Modular setups support flexible living requirements across cities. Homeowners want products that adapt to layout changes. Custom pieces help consumers shape personal styling goals. Commercial units adopt flexible seating for multi-use zones. Designers choose modular units to speed installation. Local brands promote multifunction furniture for small homes. It helps users unlock space efficiency in dense regions. Strong demand lifts the share of modular concepts.
- For instance, IKEA’s STOCKHOLM 2025 collection features two distinctly different modular sofa designs developed as collection centerpieces—designer Ola Wihlborg’s wide modular sofa developed after testing over 30 prototypes to achieve the perfect shape for everyday comfort, and designer Nike Karlsson’s sofa constructed from natural materials including natural latex and coconut fiber—supporting various spatial adaptations.
Wider Adoption of Smart Interiors and Connected Living Concepts
Smart-home penetration drives new layout strategies in modern homes. Buyers prefer automated lighting for comfort and style. Connected climate-control tools shape smart living choices. Offices use real-time systems to cut energy waste. Designers integrate IoT sensors with premium décor. Hospitality units adopt contactless features for guest convenience. It brings strong digital influence across design workflows. Smart interiors gain support from tech-aware urban groups.
Growing Use of Natural Elements and Biophilic Design
Biophilic design improves wellness across homes and offices. Designers use plants to create fresh indoor zones. Natural stone adds texture across new interiors. Offices adopt daylight-focused layouts to lift productivity. Hospitality units apply wood elements for warmth. Buyers choose earthy palettes for calm environments. It pushes nature-inspired themes across Dutch commercial and residential spaces. Demand for organic materials grows across modern projects.
Market Challenges Analysis:
High Cost of Premium Materials and Skilled Design Services
Premium materials create cost pressure for many buyers in the Netherlands Interior Design Market. Imported décor items raise project budgets quickly. Skilled designer fees add complexity for mid-income families. Local supply gaps slow procurement stages across cities. Firms struggle to meet budgets without quality compromise. Commercial units face rising installation expenses in busy hubs. It reduces spending scope for large renovation cycles. Market players adapt pricing to maintain customer trust.
Supply Chain Pressure, Compliance Rules, and Slower Project Turnarounds
Material shortages extend delivery timelines across new projects. Regulations increase compliance tasks for design firms. Contractors face delays due to labor scarcity in peak seasons. Urban sites create logistical challenges for large installations. Many small firms lack tools to manage complex procurement. Energy-efficiency rules require detailed planning for older buildings. It leads to slower turnaround in major redesign phases. Market players invest in workflow tools to reduce risk.
Market Opportunities:
Growing Scope for Eco-Friendly Interiors and Low-Impact Renovations
The push for green living creates strong potential in the Netherlands Interior Design Market. Buyers want eco-certified materials for long-term durability. Offices explore low-impact upgrades that align with ESG plans. Designers use recycled options to build fresh modern looks. Hospitality units adopt sustainable décor for brand value. It unlocks a wide space for innovative natural designs. Firms gain new revenue streams through green-focused offerings.
Rising Demand for High-Tech, Hybrid, and Multi-Use Interior Concepts
Hybrid work culture generates opportunities for flexible layouts. Buyers look for smart features across compact homes. Offices invest in multi-use zones to lift staff comfort. Tech-driven décor helps firms enhance visual appeal. Designers add intelligent lighting for improved ambiance. Hospitality units deploy digital systems for faster service. It drives long-term growth for high-tech interiors. Multi-functional trends shape promising demand across dense Dutch regions.
Market Segmentation Analysis:
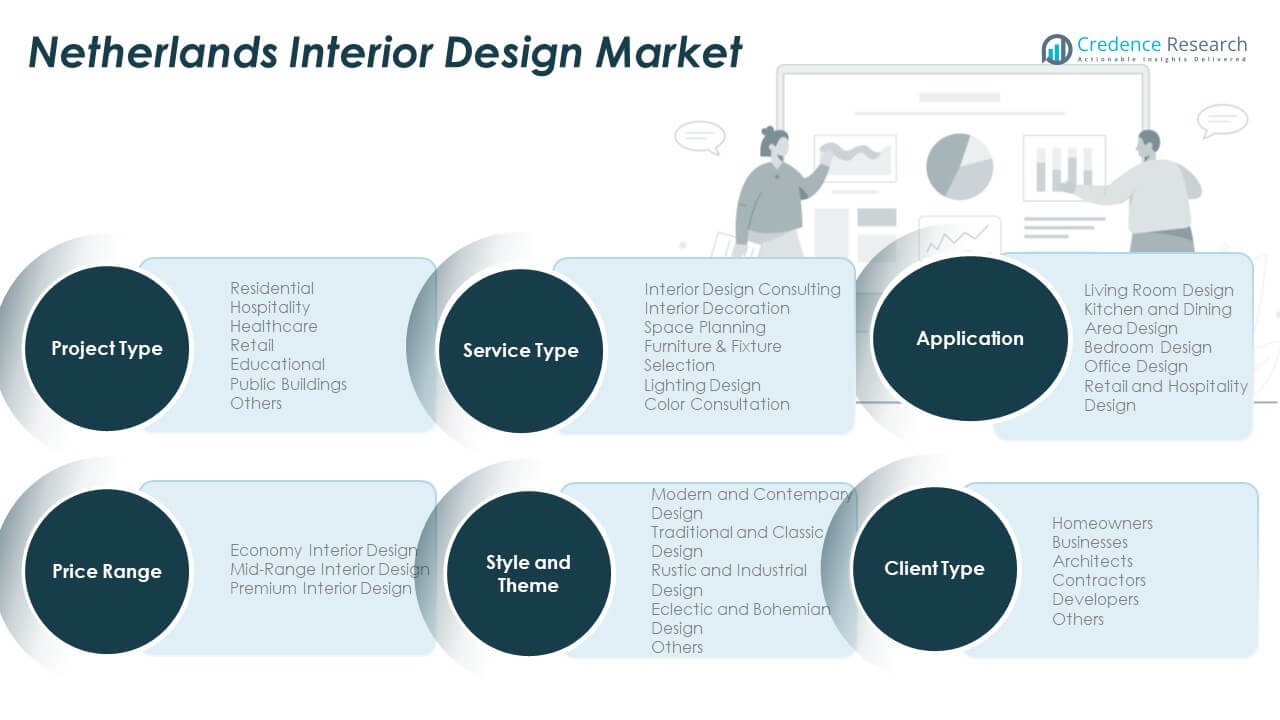
Project Type Segments
The Netherlands Interior Design Market grows through broad demand across project types. Residential projects lead due to steady renovation cycles and compact urban homes that require efficient layouts. Hospitality and retail segments upgrade interiors to strengthen brand identity and improve customer flow. Healthcare facilities adopt modern concepts that support patient comfort and operational efficiency. Educational and public buildings integrate flexible spaces and durable materials for long-term performance. Others include niche projects that support specialized design needs.
- For instance, Framework Studio has completed extensive residential portfolio work including warehouse renovations in Amsterdam and penthouse projects in Overhoeks, each requiring custom material palettes and spatial optimization for urban dwellings.
Service Type Segments
Service adoption stays strong across consulting, decoration, space planning, fixture selection, lighting design, and color consultation. Interior design consulting helps clients shape early planning choices. Decoration services support style refinement in homes and commercial spaces. Space planning remains vital in dense cities where clients want optimized layouts. Fixture and lighting selection gain traction with the rise of smart systems. Color consultation enhances visual harmony across many projects.
Application Segments
Living room, bedroom, kitchen, dining, office, retail, and hospitality designs create steady demand. Living spaces require functional concepts for everyday use. Kitchens and dining areas reflect lifestyle upgrades. Bedrooms focus on comfort and storage. Offices adopt hybrid work layouts. Retail and hospitality projects use thematic interiors to lift engagement.
Project Stage, Price Range, Style, and Client Type Segments
Renovation leads due to frequent upgrades, while new builds expand through urban development. Economy, mid-range, and premium designs target varied budgets. Style choices range from modern, classic, rustic, eclectic, and other themes. Homeowners, businesses, architects, contractors, developers, and others drive broad adoption across the country.
Segmentation:
By Project Type Segments
- Residential
- Hospitality
- Healthcare
- Retail
- Educational
- Public Buildings
- Others
By Service Type Segments
- Interior Design Consulting
- Interior Decoration
- Space Planning
- Furniture & Fixture Selection
- Lighting Design
- Color Consultation
By Application Segments
- Living Room Design
- Kitchen and Dining Area Design
- Bedroom Design
- Office Design
- Retail and Hospitality Design
By Project Stage Segments
By Price Range Segments
- Economy Interior Design
- Mid-Range Interior Design
- Premium Interior Design
By Style and Theme Segments
- Modern and Contemporary Design
- Traditional and Classic Design
- Rustic and Eclectic and Bohemian Design
- Eclectic and Bohemian Design
- Others
By Client Type Segments
- Homeowners
- Businesses
- Architects
- Contractors
- Developers
- Others
Regional Analysis:
Randstad Region
The Netherlands Interior Design Market records its highest activity in the Randstad, holding an estimated 48% market share. Amsterdam drives strong demand through rapid renovation cycles, premium residential upgrades, and frequent commercial refresh projects. Rotterdam supports design growth through urban redevelopment and a rising number of mixed-use buildings. The Hague contributes steady demand from government offices, public facilities, and diplomatic zones. Utrecht expands through student housing growth and compact residential layouts that need efficient planning. The region benefits from high-income groups and strong design awareness. It remains the core hub for design studios and premium service providers.
Northern and Eastern Netherlands
Northern and Eastern provinces together account for nearly 22% market share. Groningen and Zwolle drive moderate activity through university housing, public buildings, and small commercial units. Local homeowners focus on functional layouts with durable materials due to colder climates. Flexible mid-range interior design services gain traction in this region. The market sees gradual upgrades in retail zones and hospitality facilities that want modern themes. It shows growing interest in smart lighting and sustainable décor options. Design activity remains steady with long-term potential from residential and municipal projects.
Southern Netherlands
The Southern region holds an estimated 30% market share, supported by cities such as Eindhoven, Breda, and Tilburg. Eindhoven leads through strong innovation culture and modern residential developments. Local businesses invest in interior upgrades to improve workplace comfort and branding. Hospitality and retail sectors adopt creative layouts to engage a diverse customer base. Homeowners in suburban areas prefer modern and contemporary styles for new homes. It draws strong demand for space planning, color consultation, and furniture selection. The region maintains a balanced mix of premium and mid-range design projects that support stable long-term growth.
Shape Your Report to Specific Countries or Regions & Enjoy 30% Off!
Key Player Analysis:
Competitive Analysis:
The Netherlands Interior Design Market features strong competition driven by established studios, design-led retailers, and specialized consultancies. Large players focus on brand recognition and scalable service models, while boutique firms compete through customized concepts and premium styling. Product variety, material quality, and design innovation influence buyer choices across homes and commercial spaces. Digital tools help firms improve planning efficiency and client engagement. It supports faster delivery cycles and stronger visual accuracy during consultations. Companies expand portfolios with modular furniture, smart lighting, and eco-certified décor. The market stays dynamic due to evolving aesthetics and rising renovation interest across major cities.
Recent Developments:
- IKEA launched the eighth edition of its iconic STOCKHOLM 2025 collection in April 2025, representing the largest iteration of this premium line to date with 96 thoughtfully curated pieces. The collection celebrates 40 years since its 1985 debut and prioritizes high-quality materials—including solid woods, handwoven wool rugs, mouth-blown glass, and handcrafted rattan—all offered at accessible price points. Drawing inspiration from Stockholm’s urban and natural landscapes, the collection features rich earth tones and seasonal color palettes reflecting Scandinavian design philosophy.
- Additionally, IKEA’s sixth edition of the Nytillverkad collection launched in February 2025, reimagining design icons from the 1960s through 1980s. Featuring bold color-forward designs and customizable shelving systems, the collection celebrates creativity and self-expression through reinterpreted standalone chairs, reversible shelving units, playful textiles, and curvy vases.
- In October 2024, IKEA Netherlands marked a significant strategic shift within the interior design and retail landscape of the Netherlands by opening its smallest store concept to date. The inaugural Plan & Order Point opened on October 3, 2024, in Leeuwarden, Friesland, with a compact footprint of just 650 square meters—approximately 40 times smaller than traditional IKEA stores. This innovative retail strategy represents IKEA’s commitment to bringing expert consultation services closer to customers within Dutch city centers, focusing on major purchases such as kitchens and bathroom furnishings.
Report Coverage:
The research report offers an in-depth analysis based on Project Type, Service Type, Application, Project Stage, Price Range, Style and Theme, and Client Type. It details leading market players, providing an overview of their business, product offerings, investments, revenue streams, and key applications. Additionally, the report includes insights into the competitive environment, SWOT analysis, current market trends, as well as the primary drivers and constraints. Furthermore, it discusses various factors that have driven market expansion in recent years. The report also explores market dynamics, regulatory scenarios, and technological advancements that are shaping the industry. It assesses the impact of external factors and global economic changes on market growth. Lastly, it provides strategic recommendations for new entrants and established companies to navigate the complexities of the market.
Future Outlook:
- Demand will grow through steady residential renovation cycles and compact urban living needs.
- Hybrid work patterns will expand office design projects focused on comfort and flexibility.
- Smart lighting and connected interiors will gain traction in tech-aware home and commercial spaces.
- Eco-friendly materials will rise in adoption due to strong sustainability priorities nationwide.
- Boutique studios will capture premium clients seeking personalized themes and curated styling.
- Hospitality and retail upgrades will strengthen due to brand-focused design investments.
- Modular furniture and multifunction layouts will support space optimization trends across Dutch cities.
- Education and public building modernization will encourage long-term project activity.
- Digital design tools will improve project accuracy and customer engagement across regions.
- Expanding suburban and new-build zones will create fresh opportunities for broad service portfolios.


