Market Overview
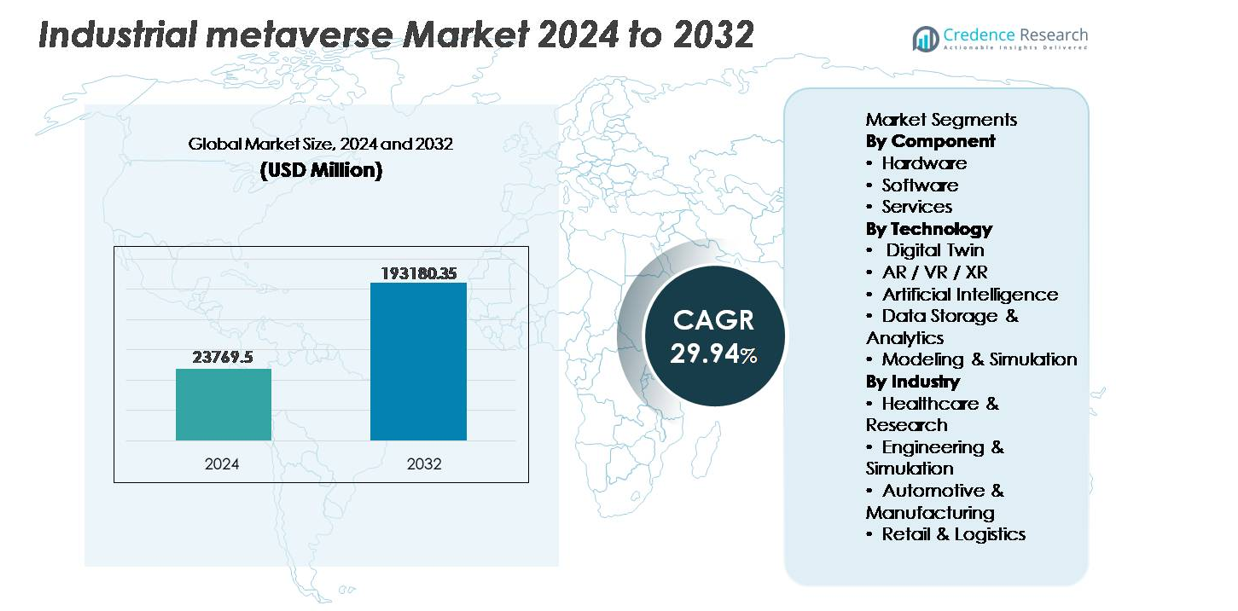
The industrial metaverse market was valued at USD 23,769.5 million in 2024 and is projected to reach USD 193,180.35 million by 2032, reflecting a robust CAGR of 29.94% over the forecast period.
| REPORT ATTRIBUTE |
DETAILS |
| Historical Period |
2020-2023 |
| Base Year |
2024 |
| Forecast Period |
2025-2032 |
| Industrial Metaverse Market Size 2024 |
USD 23,769.5 million |
| Industrial Metaverse Market, CAGR |
29.94% |
| Industrial Metaverse Market Size 2032 |
USD 193,180.35 million |
The industrial metaverse market is shaped by leading global players, including Samsung, Microsoft, Meta, Sony, Siemens AG, Google, HTC Corporation, Unity Technologies, Magic Leap, and EON Reality, actively developing immersive collaboration platforms, digital twin environments, spatial computing hardware, and AI-driven industrial applications. North America remains the leading region with approximately 34-36% market share, supported by strong technological infrastructure, metaverse-focused R&D investments, and early adoption across aerospace, automotive, and advanced manufacturing. Europe and Asia-Pacific intensify competition through Industry 5.0 initiatives, robotics advancement, and digital factory deployments, fostering a dynamic, innovation-driven competitive landscape.
Market Insights
- The industrial metaverse market was valued at USD 23,769.5 million in 2024 and is projected to reach USD 193,180.35 million by 2032, at a CAGR of 29.94% during the forecast period.
- Market growth is driven by increasing adoption of digital twins, AI-enabled predictive control, and immersive remote training solutions, enhancing productivity, safety, and asset lifecycle management in industrial environments.
- Emerging trends include the integration of AR/VR/XR for virtual workforce enablement, convergence of 5G and edge computing for low-latency automation, and digital supply networks optimizing global manufacturing responsiveness.
- Competitive activity intensifies as major players innovate simulation software, AI-driven analytics, and XR hardware, while high deployment costs, interoperability constraints, and cybersecurity concerns act as market restraints.
- Regionally, North America holds 34-36% market share, followed by Asia-Pacific with 30-32% and Europe with 27-29%, while the software segment leads component share due to rising demand for virtual lifecycle management platforms.
Access crucial information at unmatched prices!
Request your sample report today & start making informed decisions powered by Credence Research Inc.!
Download Sample
Market Segmentation Analysis:
By Component:
The software segment holds the largest share of the industrial metaverse market as organizations prioritize platforms for simulation, digital twins, process automation, and AI-enabled decision models. Software adoption accelerates due to the need for interoperable environments that connect design, production, supply chains, and service operations in real time. Hardware experiences steady growth with demand for AR/VR headsets, sensors, scanners, and spatial computing devices that capture and render physical assets virtually, while services expand alongside enterprise digital transformation initiatives, consulting, system integration, and lifecycle support for scalable, cloud-based industrial metaverse deployments.
- For instance, Siemens’ Accelerator digital business platform enables synchronized engineering and manufacturing through its curated portfolio of interoperable industrial software suites, supporting real-time data integration and physics-based simulation for comprehensive, factory-scale digital replicas.
By Technology:
Digital twin technology dominates the segment, driven by its ability to replicate physical assets and systems, enabling predictive maintenance, risk-free testing, and accelerated prototyping. AR/VR/XR gains momentum for immersive training, remote collaboration, and safety simulations, particularly in hazardous industrial environments. Artificial intelligence underpins metaverse platforms through autonomous control, anomaly detection, and real-time optimization. Meanwhile, data storage and analytics ensure secure and scalable handling of industrial datasets, whereas modeling and simulation enhance virtual commissioning. Edge computing and related technologies support low-latency industrial workloads and distributed factory ecosystems.
- For instance, IBM’s AI anomaly detection for industrial equipment processes up to 250 billion events per day using AI inference pipelines to prevent downtime across global manufacturing networks.
By Industry:
The automotive and manufacturing segment leads the market, supported by investments in smart factories, autonomous assembly lines, and end-to-end digital twin integration for product lifecycle management. Engineering and simulation benefit from virtual prototyping and performance validation without physical builds. Healthcare and research increasingly leverage metaverse platforms for precision training and virtual laboratories. Retail and logistics deploy immersive planning tools, warehouse automation, and digital storefronts to improve operational efficiency and customer engagement. These industry-specific implementations reflect the growing alignment of industrial metaverse solutions with sectoral digital transformation priorities.
Key Growth Drivers
Rising Adoption of Digital Twins for Real-Time Optimization
The deployment of digital twins is a central driver accelerating industrial metaverse adoption, enabling enterprises to visualize, simulate, and control complex operations. Manufacturers leverage digital replicas for predictive maintenance, performance benchmarking, and asset lifecycle optimization, reducing downtime and operational risk. Real-time integration of IoT sensors, AI analytics, and virtual modeling supports scenario planning without physical interruption and enhances responsiveness to supply variability, quality deviations, or capacity shifts. Additionally, industries implementing digital twins have reported improvements in resource efficiency, reduced prototype costs, and faster decision cycles. As organizations push toward autonomous operations, digital twins serve as foundational blueprints for closed-loop industrial metaverse ecosystems, boosting digital continuity from design to decommissioning.
- For instance, ABB’s digital twin-enabled robotics ecosystem simulates robot movements with positional accuracy within ±0.6 millimeters, enabling autonomous calibration without manual intervention across distributed production cells.
Growing Demand for Remote Operations, Virtual Workforce, and Safety Training
Organizations continue to adopt industrial metaverse platforms to address remote workforce enablement, bridging geographic constraints through immersive collaboration environments. AR/VR and extended reality solutions provide interactive training, reducing the need for physical testing and exposure to hazardous conditions. Industrial sectors including energy, mining, and heavy engineering employ immersive simulations to replicate high-risk operational settings, improving learning retention and safety compliance. Remote monitoring, troubleshooting, and equipment commissioning minimize travel and accelerate problem resolution. As enterprises expand their global footprints, virtual workforce models support cross-border engineering, maintenance, and product development, increasing agility and lowering operational overheads.
- For instance, BP utilizes remote collaboration platforms to support offshore operations across assets located more than 120 kilometers from the nearest coastline, enabling engineering specialists to participate virtually without being physically dispatched to rigs.
Integration of Artificial Intelligence for Predictive Control and Autonomous Operations
AI significantly advances industrial metaverse value propositions by enhancing virtual environments with learning, reasoning, and adaptive automation. Predictive algorithms analyze machine behavior, identify anomalies, and automate preventive interventions before failures occur. AI-driven simulations optimize material flows, energy utilization, and human–machine interactions, improving sustainability and cost efficiency. Natural language and multimodal interfaces allow operators to navigate metaverse workflows intuitively, reducing training time. As industries transition to autonomous factories and digitally governed supply chains, AI-infused metaverse systems accelerate decision-making, automate repetitive tasks, and augment human expertise through context-aware recommendations.
Key Trends & Opportunities
Convergence of Robotics, Edge Computing, and 5G for Low-Latency Industrial Networks
A defining trend shaping the industrial metaverse is the convergence of robotics, edge platforms, and high-speed connectivity to support real-time data processing and machine autonomy. Edge computing reduces latency by enabling decisions closer to equipment, while 5G enhances transmission reliability for mobile robots, inspection drones, and tele-operated machinery. This creates opportunities for continuous production monitoring, decentralized manufacturing, and resilient multi-site operations. Industries are exploring metaverse-powered robotic twins, remote robot training, and synchronized fleet coordination in logistics and warehouse automation, unlocking new operational models and service revenue streams.
- For instance, FANUC’s FIELD edge platform connects multiple machines per cell and processes AI-driven cycle optimization locally, reducing reliance on centralized cloud processing for robotic machining and injection molding lines.
Expansion of Immersive Commerce, Virtual Prototyping, and Digital Supply Networks
The industrial metaverse is opening new commercial pathways, enabling virtual product demos, metaverse-enabled B2B interactions, and digital procurement portals. Virtual prototyping reduces physical iterations while accelerating product validation with partners and clients. Companies are integrating digital supply networks that map supplier dependencies, carbon footprints, and logistics volatility. Opportunities emerge for simulation-based contract bidding, virtual showrooms, and collaborative design sessions, enabling cost transparency and faster market entry. This trend supports circular manufacturing initiatives, offering insights into recyclability, material traceability, and product end-of-life strategies.
- For instance, SAP’s Digital Supply Chain platform processes vast volumes of data in real-time to support predictive supply planning and material traceability across global supplier ecosystems.
Key Challenges
Interoperability Constraints and Lack of Standardized Metaverse Frameworks
The industrial metaverse faces adoption challenges due to fragmented platforms, proprietary simulation environments, and limited interoperability between hardware and software systems. Enterprises struggle to integrate legacy infrastructure and connect diverse IT–OT systems without significant customization. The absence of unified standards complicates cross-vendor collaboration, virtual asset portability, and data governance models. This constraint increases deployment cost and complexity, discouraging small and medium enterprises. As industrial ecosystems expand, the need for compatibility between digital twins, XR devices, AI engines, and cloud or edge networks becomes critical to scale multi-plant metaverse implementations.
Cybersecurity, Data Ownership, and Privacy Risks in Virtual Industrial Networks
The expansion of immersive, data-rich industrial environments introduces heightened cybersecurity risks. Continuous data exchange between digital twins, connected assets, and metaverse platforms creates multiple attack surfaces involving intellectual property, operational intelligence, and real-time control systems. Unclear data ownership between vendors and customers further complicates compliance, especially across borders with evolving privacy regulations. Breaches could disrupt production lines, compromise safety protocols, or manipulate simulations leading to misinformed decisions. Strengthening cyber resilience, identity authentication, encryption, and zero-trust models remains crucial to safeguarding metaverse-driven industrial transformation.
Regional Analysis
North America
North America holds the largest market share of approximately 34-36% in the industrial metaverse sector, driven by rapid adoption of digital twins, AI-powered automation, and immersive work solutions across manufacturing and aerospace. Strong investment from technology companies and advanced industrial digitalization programs support metaverse integration in smart factories, remote asset management, and worker training. The U.S. leads the region, benefiting from robust connectivity infrastructure, enterprise 5G deployments, and high expenditure on defense and automotive simulation environments. Collaboration between hyperscale cloud providers, industrial OEMs, and robotics companies further accelerates commercialization and scalability of metaverse platforms.
Europe
Europe accounts for around 27-29% of the global market share, supported by Industry 5.0 initiatives, advanced engineering capabilities, and regulatory-backed digital sustainability frameworks. Germany and the U.K. drive adoption with strong automotive, industrial machinery, and energy transition projects integrating simulation and digital twin capabilities. The region’s emphasis on circular manufacturing and carbon-tracking digital models fuels demand for virtual testing and lifecycle management platforms. EU-led funding for cross-border digital infrastructure and research partnerships enables broader implementation of AR/VR training and simulation in logistics, renewable energy, and public-sector industrial operations.
Asia-Pacific
Asia-Pacific represents nearly 30-32% of the industrial metaverse market share, emerging as the fastest-growing region due to large-scale smart manufacturing investments, rapid expansion of robotics, and strong digital-first government policies. China leads adoption through intelligent factory initiatives, while Japan and South Korea deploy metaverse platforms for automotive design, semiconductor fabrication, and precision robotics. The region experiences growing demand for immersive training, virtual R&D, and supply-chain visualization to support high-volume production. Increasing 5G penetration and cloud infrastructure maturity facilitate low-latency industrial automation, positioning Asia-Pacific as a central hub for industrial metaverse innovation.
Middle East & Africa
The Middle East & Africa region captures approximately 4-5% market share, with growth driven by national digital transformation programs and mega industrial infrastructure projects. Countries in the Gulf Cooperation Council accelerate adoption for energy asset management, remote workforce training, and predictive maintenance across oil, gas, and utilities. The focus on diversifying economies into manufacturing and logistics hubs supports metaverse-enabled simulation and planning environments. Limited skilled resources and slower cloud adoption present constraints in Africa, yet increasing investment in industrial zones and telecommunications infrastructure indicates emerging future demand.
Latin America
Latin America holds around 3-4% market share, reflecting gradual but rising adoption of industrial metaverse solutions in automotive assembly, mining, and agritech. Brazil and Mexico lead deployment of digital twins and immersive maintenance systems to reduce downtime and operational risk in asset-intensive sectors. Economic modernization initiatives and industrial policy reforms encourage adoption of automation technologies and digital training platforms. However, challenges including uneven connectivity and budget constraints may limit rapid expansion. Ongoing private–public investments in smart logistics and export-driven manufacturing signal incremental growth opportunities for metaverse-supported industrial operations.
Market Segmentations:
By Component
- Hardware
- Software
- Services
By Technology
- Digital Twin
- AR / VR / XR
- Artificial Intelligence
- Data Storage & Analytics
- Modeling & Simulation
By Industry
- Healthcare & Research
- Engineering & Simulation
- Automotive & Manufacturing
- Retail & Logistics
By Geography
- North America
- Europe
- Germany
- France
- U.K.
- Italy
- Spain
- Rest of Europe
- Asia Pacific
- China
- Japan
- India
- South Korea
- South-east Asia
- Rest of Asia Pacific
- Latin America
- Brazil
- Argentina
- Rest of Latin America
- Middle East & Africa
- GCC Countries
- South Africa
- Rest of the Middle East and Africa
Competitive Landscape
The competitive landscape of the industrial metaverse market is characterized by a mix of global technology leaders, industrial automation providers, cloud hyperscalers, and specialized simulation and XR platform developers competing to build interoperable, scalable, and AI-driven virtual ecosystems. Major players focus on partnerships, digital twin frameworks, and industry-specific metaverse applications that integrate robotics, edge computing, and predictive analytics. Companies are strengthening their portfolios by aligning with manufacturing, energy, and automotive enterprises to enable virtual prototyping, immersive workforce training, and remote operations. Investment continues in R&D to enhance real-time rendering, asset interoperability, and security across virtual industrial environments. Competitive differentiation increasingly centers on offering end-to-end lifecycle digitalization from design engineering and factory planning to maintenance and sustainability optimization supported by flexible cloud deployment models, device compatibility, and low-latency infrastructure. As adoption expands, competition intensifies around proprietary platforms, cross-vendor integration, and domain-specific industrial use cases, driving consolidation and strategic alliances across the value chain.
Shape Your Report to Specific Countries or Regions & Enjoy 30% Off!
Key Player Analysis
Recent Developments
- In February 2025, Siemens revealed plans to build a showcase “industrial-metaverse factory” in Erlangen, combining XR, digital twins, IoT and AI to drive smarter manufacturing, quality assurance, and process optimization at scale.
- In August 2024,Google, a leading technology group, rebranded its VR modeling tool to an open-source version of Google Blocks. The open block will be available on Steam in the upcoming month, and the OpenXR framework will allow the Icosa Foundation to target a greater range of XR devices.
- In June 2024, visTable, a prominent VR software solution provider, announced possible configurations for a VR App with direct compilation to planning software. The upgraded graphics hardware allows for 3D simulations of the complex and simple factory layouts with VR Glasses, ideally achieving a refresh rate of 90Hz.
Report Coverage
The research report offers an in-depth analysis based on Component, Technology, Industry and Geography. It details leading market players, providing an overview of their business, product offerings, investments, revenue streams, and key applications. Additionally, the report includes insights into the competitive environment, SWOT analysis, current market trends, as well as the primary drivers and constraints. Furthermore, it discusses various factors that have driven market expansion in recent years. The report also explores market dynamics, regulatory scenarios, and technological advancements that are shaping the industry. It assesses the impact of external factors and global economic changes on market growth. Lastly, it provides strategic recommendations for new entrants and established companies to navigate the complexities of the market.
Future Outlook
- The industrial metaverse will become central to digital factory planning, enabling real-time visualization and simulation before physical deployment.
- AI-driven virtual assistants will guide operators, automate decisions, and reduce reliance on manual oversight.
- Digital twins will expand from individual assets to full production ecosystems covering suppliers, logistics, and aftermarket services.
- Immersive training environments will replace traditional methods, enhancing workforce safety and competency.
- Robotics and autonomous systems will integrate with metaverse platforms for remote programming and fleet coordination.
- Cross-border engineering and collaboration will occur in shared virtual spaces, reducing travel and project timelines.
- Edge computing and advanced connectivity will support low-latency industrial automation and decentralized production models.
- Sustainability reporting will rely on virtual tracking of carbon emissions, material flows, and circular manufacturing metrics.
- Cybersecurity frameworks will evolve to protect immersive industrial operations and sensitive simulation data.
- Business models will shift toward subscription-based virtual services and digital asset marketplaces.


