| REPORT ATTRIBUTE |
DETAILS |
| Historical Period |
2020-2023 |
| Base Year |
2024 |
| Forecast Period |
2025-2032 |
| Licensed Sports Merchandise Market Size 2024 |
USD 35132 Million |
| Licensed Sports Merchandise Market, CAGR |
5.4% |
| Licensed Sports Merchandise Market Size 2032 |
USD 53509.11 Million |
Market Overview:
The Licensed Sports Merchandise Market is projected to grow from USD 35132 million in 2024 to an estimated USD 53509.11 million by 2032, with a compound annual growth rate (CAGR) of 5.4% from 2024 to 2032.
Several key factors are fueling the expansion of the licensed sports merchandise market. The globalization of sports leagues has broadened their reach, attracting fans from diverse regions and cultures. Major sporting events like the FIFA World Cup and the Olympics captivate billions of viewers, intensifying demand for official merchandise. Technological advancements, such as the integration of augmented reality (AR) in e-commerce platforms, have enhanced consumer engagement by offering interactive features like virtual try-ons, thereby boosting online sales. Additionally, the rising prominence of women’s sports, exemplified by events like the Women’s FIFA World Cup 2023, has opened new market segments, prompting brands to introduce products catering to this growing audience. Furthermore, the rise of social media and influencer marketing has significantly contributed to the visibility and appeal of licensed sports merchandise, particularly among younger consumers. With more fans sharing their support for teams online, this trend has further encouraged the purchase of official merchandise.
Regionally, North America dominates the licensed sports merchandise market, attributed to its well-established sports ecosystem and a strong fan base. The United States, in particular, is home to major leagues such as the NFL, NBA, MLB, and NHL, all of which contribute significantly to merchandise sales. In Europe, football clubs like Manchester United and Real Madrid generate substantial revenue from merchandise, reflecting the region’s deep-rooted sports culture. The Asia-Pacific region is emerging as a key growth area, driven by increasing interest in sports like cricket and basketball, especially in countries like India and China. Enhanced internet penetration and the popularity of e-commerce have further fueled the demand for licensed merchandise in this region.
Access crucial information at unmatched prices!
Request your sample report today & start making informed decisions powered by Credence Research Inc.!
Download Sample
Market Insights:
- The Licensed Sports Merchandise Market is projected to grow significantly, with a forecasted increase in value from USD 35,132 million in 2024 to USD 53,509.11 million by 2032, driven by a CAGR of 5.4%.
- Globalization of sports leagues and major events like the FIFA World Cup and Olympics are fueling merchandise demand, as fans from diverse regions are increasingly engaging with their favorite teams and athletes.
- Technological advancements, such as the integration of augmented reality (AR) in e-commerce, are enhancing consumer experiences by offering interactive features like virtual try-ons, significantly boosting online sales.
- The growing prominence of women’s sports, highlighted by events such as the Women’s FIFA World Cup, is opening new market segments, prompting brands to cater to female fans with tailored merchandise offerings.
- Counterfeit products remain a significant challenge, undermining brand value and the market’s profitability, making intellectual property protection and consumer awareness critical to the industry’s future growth.
- The seasonal nature of the market, heavily reliant on major sporting events, creates volatility in demand, as merchandise sales peak during events and dip in off-seasons, posing challenges for year-round sales consistency.
- North America leads the market due to its established sports ecosystem, but emerging regions like Asia-Pacific, particularly in countries like India and China, are becoming key growth areas driven by increasing sports interest and e-commerce penetration.
Market Drivers:
Increasing Popularity of Sports Globally
The increasing globalization of sports has been one of the most significant drivers of the licensed sports merchandise market. As sports leagues and tournaments gain an international following, the demand for official merchandise continues to grow. The exposure of major sports events like the FIFA World Cup, the Olympics, and the UEFA Champions League on a global stage has led to a wider fan base, including regions with previously limited engagement with specific sports. This global appeal generates heightened interest in purchasing merchandise as a way for fans to show their support for teams and athletes. As more people from diverse cultures and regions engage with various sports, the market for licensed sports products is expanding accordingly.
Technological Advancements and E-Commerce Growth
Technological innovations, especially in the e-commerce space, have substantially boosted the growth of the licensed sports merchandise market. Online retail platforms, enhanced by innovations like augmented reality (AR), provide consumers with engaging experiences when purchasing merchandise. Virtual try-ons, for example, allow fans to visualize how team jerseys, caps, or other accessories will look on them before making a purchase, increasing consumer confidence in online buying. Additionally, the rise of mobile shopping apps has made it easier for consumers to browse and purchase sports merchandise anytime and anywhere, further driving sales. The integration of these technologies enhances customer interaction, which, in turn, positively impacts market growth.
Major Sporting Events and Fan Engagement
Major sporting events, such as the Super Bowl, World Cup, and the Olympics, continue to be powerful catalysts for the demand for licensed sports merchandise. These events attract millions of viewers globally, and fans often purchase merchandise to commemorate their favorite teams or athletes. For example, the Super Bowl 2025 attracted over 65,000 attendees and generated $18.6 billion in consumer spending. Fans purchased merchandise not only during the event but also afterward to commemorate their favorite teams and athletes. The excitement surrounding these events not only generates increased sales during the tournament period but also leads to prolonged demand post-event, as fans seek to relive the experience. This fan engagement is a key factor in boosting merchandise sales, as it ties fans emotionally to their teams and athletes, creating a strong incentive to buy official licensed products that symbolize this connection.
Expanding Market for Women’s Sports Merchandise
The growing prominence of women’s sports is opening new avenues for the licensed sports merchandise market. For instance, the Women’s National Soccer League (NWSL) secured a historic $240 million media deal through 2027, boosting visibility and demand for related merchandise. there is a corresponding increase in demand for merchandise related to these athletes and teams. The success of women’s sports events, such as the Women’s FIFA World Cup, has shifted consumer preferences, leading brands to focus on products catering to female fans. The introduction of licensed merchandise for women has diversified the market, expanding its reach and contributing to overall market growth.
Market Trends:
Rise of Customization in Merchandise
One of the prominent trends in the licensed sports merchandise market is the increasing demand for personalized products. Consumers are increasingly seeking customized items that reflect their individual preferences and fandom. Personalized jerseys, custom player names, and unique team merchandise have gained popularity, as fans look to own products that are distinct and tailored to their tastes. This trend is particularly strong in the apparel segment, where fans can select their favorite player’s number or team colors. For example, 3D customization tools now allow fans to design jerseys with real-time previews, incorporating features like personalized names and numbers through permanent sublimation techniques for durability. As brands and retailers recognize this shift, they are increasingly offering more customization options online, which not only enhances customer satisfaction but also provides a unique selling proposition in a competitive market.
Sustainable and Eco-Friendly Merchandise
With growing environmental concerns, there has been a noticeable shift towards sustainable and eco-friendly products in the licensed sports merchandise market. As consumers become more conscious of the environmental impact of their purchases, there is a rising preference for merchandise made from recycled materials, organic fabrics, and other sustainable sources. Sports brands are responding to this trend by launching merchandise lines that emphasize ethical production practices, such as using eco-friendly dyes, reducing plastic packaging, and promoting carbon neutrality. For instance, brands like Girlfriend and Ref Active utilize recycled polyester from plastic bottles and fishing nets, ensuring their products meet rigorous environmental certifications like Oeko-Tex Standard 100. This shift towards sustainability aligns with broader global efforts to reduce waste and support environmental initiatives, and it is gaining traction among environmentally conscious sports fans.
Digital Integration and Virtual Merchandise
The licensed sports merchandise market is increasingly integrating digital elements into the product offering, such as the sale of virtual merchandise. Virtual items, including digital jerseys, fan avatars, and other collectibles, are becoming a key part of fan engagement, particularly in the online and esports segments. The rise of platforms like NFTs (non-fungible tokens) in sports has further driven this trend, allowing fans to purchase digital memorabilia linked to their favorite teams or athletes. This digital merchandise caters to tech-savvy consumers who seek innovative and collectible items that transcend physical boundaries. The growth of virtual sports events, esports, and gaming has added a new layer to the market, opening up opportunities for merchandise sales in the digital realm.
Collaborations and Limited-Edition Collections
Limited-edition collections and collaborations between sports teams and popular brands are becoming a dominant trend in the licensed sports merchandise market. High-profile collaborations with fashion brands, influencers, or other industries have created exclusive product lines that attract both sports fans and fashion-conscious consumers. These partnerships often generate a sense of urgency and exclusivity, which in turn drives higher demand. Limited-edition releases, whether in the form of special jerseys, shoes, or accessories, create excitement and anticipation among fans. This trend reflects a growing convergence between sports, fashion, and pop culture, and it has become a powerful marketing tool to appeal to broader audiences and maximize revenue.
Market Challenges Analysis:
Counterfeit Products and Intellectual Property Issues
One of the key challenges facing the licensed sports merchandise market is the prevalence of counterfeit products. Unauthorized manufacturers continue to produce fake merchandise, which not only undermines the revenue potential of officially licensed products but also poses significant intellectual property risks for brands. For instance, in 2022, U.S. Customs and Border Protection (CBP) and Immigration and Customs Enforcement-Homeland Security Investigations (ICE-HSI) seized over 267,511 counterfeit sports-related items valued at approximately $97.8 million MSRP. Counterfeit merchandise can harm the reputation of legitimate retailers and teams, as these products are often of lower quality and do not meet the standards expected by consumers. Efforts to curb the production and distribution of counterfeit goods remain an ongoing challenge, requiring enhanced security measures, better enforcement of intellectual property laws, and consumer education to ensure the authenticity of products.
High Costs and Profit Margins
Another significant restraint in the licensed sports merchandise market is the high cost of production and distribution. Licensing fees, production costs, and the need to maintain product quality can significantly impact profit margins for manufacturers and retailers. These high costs can be particularly challenging for smaller brands or niche sports teams trying to compete in a crowded market. Additionally, the fluctuation of raw material prices and labor costs can further complicate the pricing structure of licensed merchandise. The pressure to maintain affordable prices while ensuring profitability often forces companies to carefully balance between product quality and cost-efficiency.
Dependency on Popular Sports Events and Seasons
The licensed sports merchandise market is heavily reliant on major sporting events such as the FIFA World Cup, the Olympics, and league finals to drive sales. This seasonality creates a level of volatility in demand, as merchandise sales often peak around these events and dip during off-seasons. While this demand surge can be highly profitable, it also means that retailers face challenges in maintaining consistent sales year-round. This dependency on high-profile sports events makes the market vulnerable to external factors, such as global disruptions (e.g., pandemics or political unrest) that can either postpone or cancel events, thus affecting merchandise sales.
Consumer Saturation and Market Competition
As the market for licensed sports merchandise grows, so does the level of competition. Numerous brands, both large and small, are vying for consumer attention, which leads to market saturation in certain categories. With an increasing number of options available, consumers may feel overwhelmed or less likely to purchase items frequently. Brands must continuously innovate and differentiate themselves through unique offerings, marketing strategies, and collaborations to stand out. This saturation of the market makes it more challenging for individual products to maintain high sales volumes in the face of a crowded retail space.
Market Opportunities:
A significant market opportunity for the licensed sports merchandise industry lies in the expansion into emerging markets, particularly in Asia-Pacific, Latin America, and the Middle East. These regions are witnessing rapid urbanization, growing disposable incomes, and an increasing interest in global sports, creating a fertile ground for licensed sports merchandise. The rising popularity of sports like football, basketball, and cricket in countries such as China, India, and Brazil is leading to greater demand for official team merchandise. Sports leagues and clubs are increasingly targeting these regions for expansion, recognizing the untapped potential in these fast-growing markets. As sports culture continues to grow in these regions, the demand for licensed merchandise will likely experience a notable increase.
Another lucrative opportunity in the licensed sports merchandise market is the growing integration of digital and virtual products. With the increasing prominence of esports, digital fan engagement, and the rise of non-fungible tokens (NFTs), brands have a new avenue to explore. Virtual merchandise, including digital collectibles, avatars, and fan tokens, is gaining traction, particularly among younger, tech-savvy consumers. This trend opens the door for companies to capitalize on the expanding virtual economy, offering fans the chance to engage with their favorite teams and athletes in new and innovative ways. The convergence of sports and digital technology provides a unique opportunity for brands to expand their offerings and reach a broader audience.
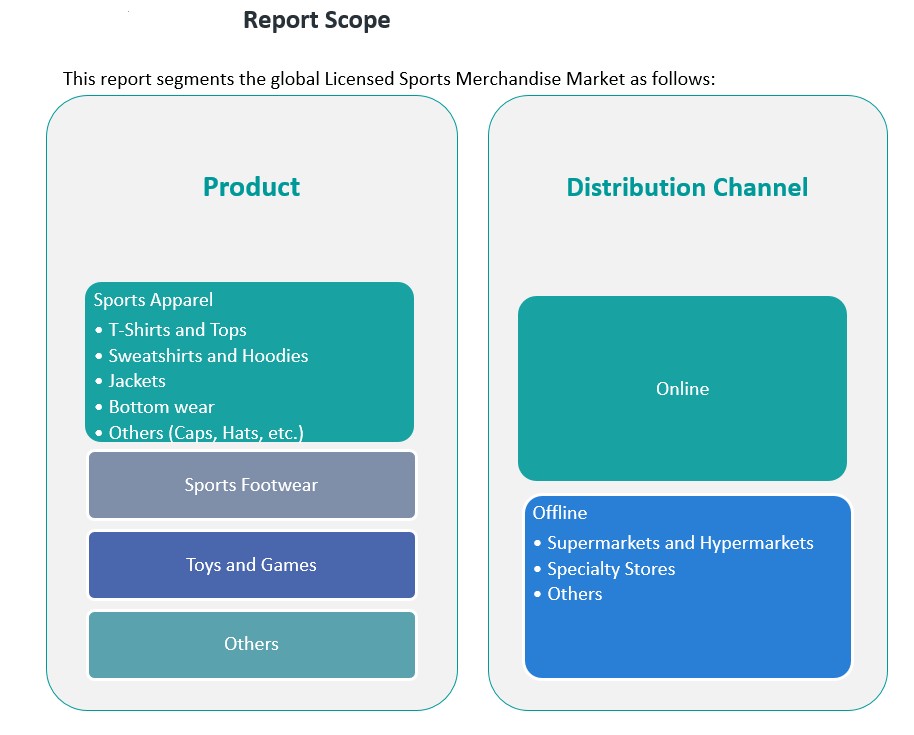
Market Segmentation Analysis:
The Licensed Sports Merchandise Market is diverse, encompassing several product and distribution channel segments, each contributing significantly to the market’s growth.
By Product Segment, sports apparel holds a dominant share, driven by products like T-shirts, sweatshirts, hoodies, jackets, and bottom wear, which are essential fan apparel. T-shirts and tops, along with sweatshirts and hoodies, are particularly popular due to their comfort and versatility. Accessories such as caps and hats, categorized under “Others,” also represent a substantial market portion, offering fans affordable ways to support their teams. Sports footwear, another significant segment, is driven by both performance-oriented and casual sports-inspired footwear. Toys and games, including collectibles and interactive products, cater to younger fans and contribute to the market’s growth by appealing to a broad demographic.
By Distribution Channel Segment, the online channel is rapidly growing, as consumers increasingly turn to e-commerce for convenience and a wider range of licensed sports merchandise. Online platforms also provide opportunities for customization and personalization, further driving sales. Offline sales continue to thrive, particularly through supermarkets and hypermarkets, which offer high-volume sales and accessibility. Specialty stores, dedicated to sports merchandise, provide a niche shopping experience, offering exclusive and high-quality products. Other offline channels also contribute to the market, with retail events and pop-up stores becoming more common as sports seasons progress.
Segmentation:
By Product Segment:
-
- T-Shirts and Tops
- Sweatshirts and Hoodies
- Jackets
- Bottom Wear
- Others (Caps, Hats, etc.)
- Sports Footwear
- Toys and Games
- Others
By Distribution Channel Segment:
- Online
- Offline
- Supermarkets and Hypermarkets
- Specialty Stores
- Others
Regional Analysis:
North America
North America holds the largest market share in the licensed sports merchandise industry, accounting for approximately 35% of the global market. The region benefits from a robust sports culture, with major leagues such as the NFL, NBA, MLB, and NHL generating significant revenue from merchandise sales. The United States, in particular, is home to a large, diverse fan base that avidly purchases licensed products to support their favorite teams and athletes. The presence of major sports events like the Super Bowl, the World Series, and the NBA Finals further drives merchandise sales. Additionally, the rise of e-commerce and digital engagement has enhanced accessibility to licensed merchandise, making it easier for fans to purchase products online. The established retail infrastructure and high consumer spending power in North America also contribute to the region’s dominance in the market.
Europe
Europe holds the second-largest share of the global licensed sports merchandise market, accounting for around 28%. Football (soccer) is the dominant sport in the region, with clubs like Real Madrid, Manchester United, and FC Barcelona contributing to substantial revenue from merchandise sales. In addition to football, other sports like rugby, cricket, and basketball are growing in popularity, further diversifying the market. The high concentration of football clubs with massive global followings ensures a steady demand for official merchandise. The region’s fan base is highly loyal, and merchandise often plays a key role in fan identity. Europe also benefits from the increasing presence of online retail platforms and the growing trend of personalization in sports merchandise, contributing to the region’s continued growth in this sector.
Asia-Pacific
The Asia-Pacific region is emerging as a major growth area for the licensed sports merchandise market, accounting for approximately 20% of the global market share. This growth is driven by the rising interest in sports like football, basketball, and cricket, particularly in countries like China, India, Japan, and South Korea. The region’s growing middle class and increasing disposable incomes are fueling demand for high-quality, officially licensed sports products. The popularity of international sports leagues such as the English Premier League and the NBA, as well as domestic leagues, is further bolstering merchandise sales. Additionally, the rapid adoption of digital technologies and the expansion of e-commerce platforms in this region provide ample opportunities for online merchandise sales.
Latin America
Latin America represents a smaller but steadily growing portion of the licensed sports merchandise market, holding around 10% of the global market share. Football holds immense cultural significance in this region, with countries like Brazil, Argentina, and Mexico producing top-tier players and teams that have strong fan followings. The demand for licensed merchandise, particularly related to football clubs, is robust, with consumers eager to purchase jerseys, accessories, and other fan gear. However, economic factors such as lower disposable income and the prevalence of counterfeit products pose challenges to market growth. Despite these hurdles, the region’s passionate sports culture and growing interest in other sports such as basketball and volleyball create potential for continued market expansion.
Middle East & Africa
The Middle East and Africa account for a smaller share of the licensed sports merchandise market, contributing approximately 7% to the global market. While the market is still developing, it is expected to grow significantly in the coming years due to increasing investments in sports infrastructure and the rising popularity of sports like football and motorsports. The region’s growing population, along with the expanding middle class and increasing participation in global sports events, is helping to drive demand for licensed merchandise. The Middle East, in particular, has seen an uptick in the demand for merchandise related to football, with local and international clubs expanding their fan base. As sports continue to play a larger role in the region’s cultural landscape, the market for licensed merchandise is poised for growth.
Key Player Analysis:
- Nike, Inc.
- Adidas AG
- Puma SE
- Under Armour, Inc.
- Hanesbrands Inc.
Competitive Analysis:
The licensed sports merchandise market is highly competitive, with key players including major sportswear brands, retail giants, and team-specific merchandise companies. Leading brands such as Nike, Adidas, Puma, and Under Armour dominate the market, leveraging their established partnerships with sports teams, leagues, and athletes to produce a wide range of products. These companies invest heavily in marketing and brand collaborations to enhance their visibility and appeal. In addition, large retailers like Fanatics and Amazon play a significant role by providing extensive online platforms for purchasing licensed merchandise. Another key segment of the market is the team-based merchandise manufacturers, such as New Era and Mitchell & Ness, which focus on producing fan apparel and accessories specific to individual teams. These players often rely on exclusive agreements with sports organizations and athletes to maintain brand loyalty and offer unique, limited-edition items. The competition remains fierce, driven by evolving consumer preferences, technological advancements, and seasonal demand fluctuations.
Recent Developments:
- In November 2023, Fanatics partnered with CLC to expand its reach by selling officially licensed merchandise from 15 U.S. colleges to international sports fans. This collaboration aims to provide easier access to authentic collegiate merchandise, catering to a growing global fan base.
- On August 8, 2024, New Era Cap announced its acquisition of ’47, a Massachusetts-based competitor in the licensed sports league headwear and apparel market. The merger is expected to generate $2 billion in annual revenue while retaining both brands.
- In May 2023, Puma solidified a significant partnership with Formula 1 as the official licensing partner and exclusive trackside retailer. This agreement granted Puma the rights to manufacture and sell Formula 1 branded apparel, footwear, and accessories for all ten teams throughout the race circuit.
Market Concentration & Characteristics:
The licensed sports merchandise market exhibits a moderate to high level of concentration, with a few dominant players controlling a significant share of the market. Major brands such as Nike, Adidas, and Under Armour, alongside retail giants like Fanatics, account for a large portion of the market due to their extensive global reach, strong brand presence, and strategic partnerships with prominent sports teams and leagues. These companies leverage their resources to maintain competitive advantages through innovative product offerings and wide distribution networks. The market is characterized by high brand loyalty, as consumers often exhibit strong affiliations with specific teams or sports. Additionally, there is a growing emphasis on personalization and customization of products, which appeals to fans seeking unique items. The increasing integration of digital technologies, such as e-commerce platforms and virtual merchandise, is also reshaping the market’s dynamics. As the market continues to grow, competition is expected to intensify, with both global and regional players vying for market share.
Shape Your Report to Specific Countries or Regions & Enjoy 30% Off!
Report Coverage:
The research report offers an in-depth analysis based on Product Segment and Distribution Channel Segment. It details leading market players, providing an overview of their business, product offerings, investments, revenue streams, and key applications. Additionally, the report includes insights into the competitive environment, SWOT analysis, current market trends, as well as the primary drivers and constraints. Furthermore, it discusses various factors that have driven market expansion in recent years. The report also explores market dynamics, regulatory scenarios, and technological advancements that are shaping the industry. It assesses the impact of external factors and global economic changes on market growth. Lastly, it provides strategic recommendations for new entrants and established companies to navigate the complexities of the market.
Future Outlook:
- The licensed sports merchandise market is poised for steady growth over the coming years.
- E-commerce platforms will continue to be a primary sales channel, as more consumers shop online for official merchandise.
- The rising popularity of esports and virtual sports events will expand the market to include digital merchandise.
- Sustainability trends will push brands to focus on eco-friendly materials and ethical production practices.
- Personalization and customization will become key offerings, catering to fans seeking unique and tailored products.
- Emerging markets, particularly in regions like Asia-Pacific and Latin America, will drive significant market expansion as sports gain more traction.
- The increasing popularity of women’s sports will create new opportunities for merchandise targeting female fans.
- Collaborations between sports teams and fashion brands will generate exclusive, limited-edition merchandise for diverse consumer bases.
- Enhanced fan engagement through social media and influencer marketing will fuel the demand for licensed sports products.
- As competition intensifies, brands will need to innovate and differentiate their products to maintain a competitive edge.


