Home » Information and Communications Technology » Technology & Media » Data Collection and Labeling Market

Data Collection and Labeling Market By Data Type (Text, Image/Video, Audio); By Service (Data Collection Service, Data Annotation & Labelling Services); By End User (IT, Automotive, Government, Healthcare, BFSI, Retail & E-commerce, Others) – Growth, Share, Opportunities & Competitive Analysis, 2024 – 2032

Report ID: 81475 | Report Format : Excel, PDF

Market Overview:

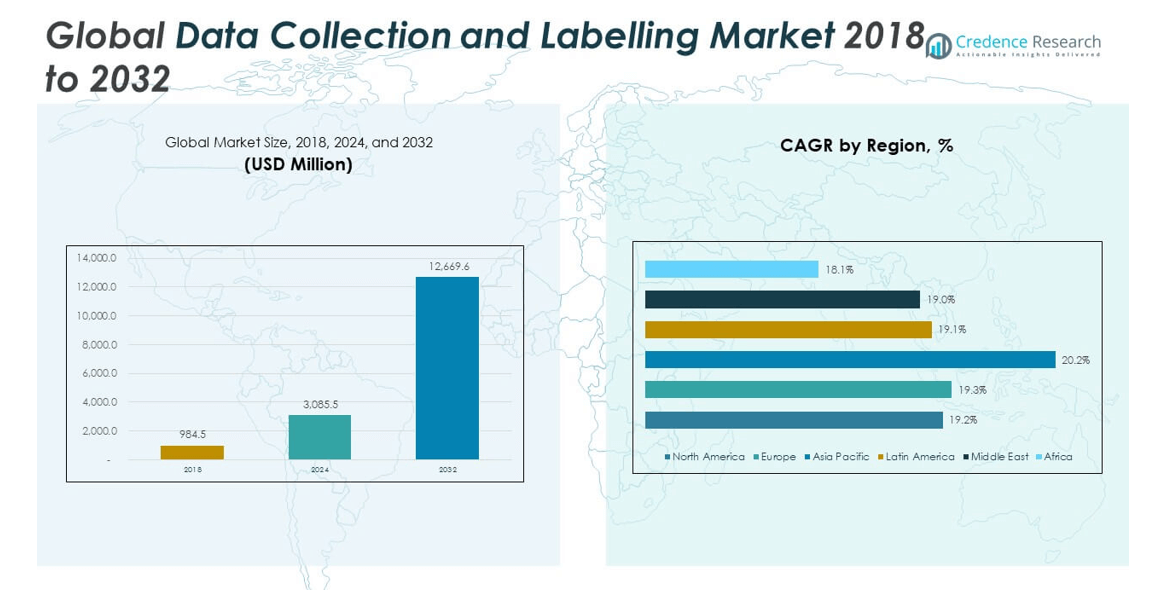
The Global Data Collection and Labeling Market size was valued at USD 984.5 million in 2018 to USD 3,085.5 million in 2024 and is anticipated to reach USD 12,669.6 million by 2032, at a CAGR of 19.41% during the forecast period.

REPORT ATTRIBUTE DETAILS
Historical Period 2020-2023
Base Year 2024
Forecast Period 2025-2032
Data Collection and Labeling Market Size 2024 USD 3,085.5 million
Data Collection and Labeling Market, CAGR 19.41%
Data Collection and Labeling Market Size 2032 USD 12,669.6 million


The market is experiencing significant growth due to the rising adoption of artificial intelligence, machine learning, and big data analytics across industries. Organizations increasingly require high-quality, accurately labelled datasets to train algorithms, improve model performance, and enhance decision-making processes. Expansion in autonomous vehicles, healthcare diagnostics, retail analytics, and smart devices further fuels demand for reliable Data Collection and Labeling services. The surge in digital transformation initiatives across both developed and emerging economies is accelerating this momentum.

North America holds a leading position in the market due to its advanced AI ecosystem, robust technological infrastructure, and strong presence of key market players. Europe follows closely, driven by stringent data quality standards and growing AI integration in automotive and healthcare sectors. The Asia Pacific region is emerging rapidly, supported by rising investments in AI start-ups, government-backed digital initiatives, and expanding e-commerce operations. Countries like China and India are witnessing accelerated adoption, while the Middle East and Africa are showing gradual but steady market penetration.

Data Collection and Labelling Market size

Market Insights:

  • The Global Data Collection and Labeling Market was valued at USD 3,085.5 million in 2024 and is projected to reach USD 12,669.6 million by 2032, growing at a CAGR of 19.41%.
  • Increasing adoption of AI and ML across industries is driving demand for high-quality labelled datasets.
  • Autonomous vehicle development is boosting requirements for image, video, and sensor data annotation.
  • Data privacy regulations and compliance complexities are restraining market growth in certain regions.
  • North America leads the market with strong AI infrastructure and high adoption across sectors.
  • Europe benefits from robust regulatory frameworks and advanced integration in healthcare and automotive industries.
  • Asia Pacific is the fastest-growing region, supported by government-backed AI initiatives and expanding e-commerce.

Access crucial information at unmatched prices!

Request your sample report today & start making informed decisions powered by Credence Research Inc.!

Download Sample

Market Drivers

Expanding Integration of Artificial Intelligence and Machine Learning Across Industries

The Global Data Collection and Labeling Market is witnessing strong growth due to the widespread adoption of artificial intelligence (AI) and machine learning (ML) across multiple industries. It is essential for AI and ML models to process large volumes of high-quality labelled data to deliver accurate predictions and outcomes. Businesses in healthcare, automotive, finance, and retail are investing heavily in structured datasets to train algorithms effectively. Autonomous vehicles rely on image, video, and sensor data labelling to improve navigation and safety features. In healthcare, annotated medical images and patient data enable precision diagnostics and treatment planning. The surge in big data analytics requires reliable datasets to generate actionable insights. Companies are prioritizing data accuracy and standardization to maintain model efficiency and compliance with regulations.

  • For example, Scale AI has provided data annotation support for autonomous vehicle projects, including work on Waymo’s datasets to improve navigation algorithms and safety features. iMerit delivers medical image annotation services for hospital networks, supporting AI-powered precision diagnostics in radiology.

Rising Demand for High-Quality Training Data in Autonomous Systems

Autonomous technologies, including self-driving cars, drones, and robotics, are driving demand in the Global Data Collection and Labeling Market. It is vital for these systems to process vast datasets that include images, videos, lidar scans, and real-time sensor inputs. Data labelling plays a key role in enabling object detection, path prediction, and decision-making capabilities. Automotive leaders are partnering with data service providers to ensure AI models operate in diverse weather and traffic conditions. Robotics in manufacturing requires annotated data to enhance precision and safety in complex environments. Smart transportation systems depend on labelled data for improved traffic management and predictive maintenance. The expanding use of intelligent automation in both industrial and consumer sectors continues to boost market growth.

  • For instance, Tesla leverages data from its global fleet, which has logged over 482 million kilometers using the Full Self-Driving (FSD) system, to train and refine its autonomous driving capabilities. Onboard cameras capture high-resolution video and image inputs at rates of up to 50 Hz, generating vast volumes of real-world data. This information is uploaded to Tesla’s servers, where it is processed to improve neural network accuracy, optimize perception models, and enhance decision-making for complex driving scenarios.

Accelerating Adoption of Data-Driven Decision-Making in Enterprises

Enterprises are increasingly relying on structured datasets for strategic decision-making, fueling the Global Data Collection and Labeling Market. It is necessary for organizations to harness reliable data to forecast trends, optimize operations, and enhance customer engagement. Retailers utilize labelled purchase data to develop personalized marketing campaigns and improve inventory planning. Financial institutions apply labelled transaction records for fraud detection and risk assessment. In manufacturing, annotated production data improves quality control and predictive maintenance. Cloud-based platforms have simplified large-scale data processing and storage, enabling faster deployment of AI-powered analytics. The demand for accurate data annotation services grows as more industries embed AI-driven insights into their operations.

Expanding Role of Digital Transformation and IoT in Data Generation

The rapid growth of digital transformation and Internet of Things (IoT) devices is a key driver for the Global Data Collection and Labeling Market. It is estimated that billions of connected devices generate massive streams of raw data that require structured labelling for effective utilization. Smart cities rely on labelled data from sensors to manage utilities, traffic, and public safety efficiently. In logistics, IoT-enabled asset tracking systems use annotated datasets to optimize routes and reduce delays. Wearable devices produce health and activity data that is labelled for preventive care analytics. E-commerce platforms depend on labelled customer interaction data to refine product recommendations. The expansion of IoT ecosystems across industrial, commercial, and consumer sectors is significantly increasing the volume of data that requires accurate labelling.

Market Trends

Growing Use of Synthetic Data for Enhanced Model Training

The Global Data Collection and Labeling Market is experiencing a shift toward the use of synthetic data to supplement real-world datasets. It is becoming increasingly valuable for training AI models where real data is scarce or privacy-sensitive. Synthetic datasets enable safe experimentation without exposing confidential information. Industries such as healthcare and autonomous driving benefit from this approach by simulating rare scenarios for robust model training. Advanced generative AI tools produce realistic images, text, and sensor data that can be annotated for various applications. This trend reduces dependency on costly manual data collection processes. Businesses are integrating synthetic datasets alongside traditional labelling to achieve higher accuracy and scalability in AI models.

  • For example, Waymo has driven over 20 billion miles in simulation, constructing virtual scenarios to test challenging situations that would be difficult or unsafe to replicate in the real world. These simulations include “fuzzing” techniques to subtly modify environments and generate rare or hazardous events that enrich training data.

Increasing Demand for Multi-Modal Data Annotation Services

The rising complexity of AI applications is creating demand for multi-modal data annotation in the Global Data Collection and Labeling Market. It is essential for models to process and correlate different data formats, including images, audio, video, text, and sensor inputs. Autonomous vehicles require synchronized labelling of camera feeds, radar scans, and GPS data for accurate navigation. Virtual assistants depend on combining voice recognition with contextual visual data for improved responses. E-commerce platforms leverage multi-modal datasets to enhance visual search and recommendation systems. This approach allows AI to understand and interpret cross-referenced information in real time. The integration of multi-modal labelling is enhancing model intelligence and expanding its applicability across industries.

Expansion of Cloud-Based Data Labelling Platforms

Cloud-based platforms are emerging as a transformative trend in the Global Data Collection and Labeling Market. It is enabling enterprises to scale their data annotation processes with greater speed and efficiency. Cloud solutions provide secure collaboration environments where geographically dispersed teams can work on datasets simultaneously. AI-driven automation integrated into cloud systems accelerates the annotation process while reducing errors. This model supports continuous updates, making it ideal for projects requiring frequent retraining of AI models. Industries benefit from lower infrastructure costs and faster project turnaround times. The flexibility of cloud-based platforms is fostering widespread adoption across sectors seeking agile data processing solutions.

  • For example, Labelbox offers a cloud-based data annotation platform that supports large-scale AI data pipeline workflows, enabling distributed teams to collaborate on labelling projects in real time across multiple industries.

Adoption of Advanced Quality Control Mechanisms in Data Annotation

Quality assurance is becoming a strategic focus in the Global Data Collection and Labeling Market as organizations demand precise and consistent datasets. It is prompting service providers to deploy advanced quality control measures such as consensus-based labelling, automated validation tools, and expert review cycles. Industries with high compliance requirements, such as healthcare and finance, are prioritizing error-free data annotation to avoid regulatory risks. AI-assisted quality monitoring tools can detect inconsistencies and flag anomalies in real time. This trend ensures that datasets meet the accuracy thresholds required for mission-critical AI applications. Continuous improvement in quality control is enhancing trust and reliability in labelled datasets across the market.

Data Collection and Labelling Market share

Market Challenges Analysis

Managing Data Privacy and Compliance Across Diverse Jurisdictions

The Global Data Collection and Labeling Market faces significant challenges in ensuring compliance with varying data protection regulations worldwide. It is critical for organizations to navigate complex legal frameworks, such as GDPR in Europe, CCPA in the U.S., and evolving privacy laws in Asia-Pacific. Collecting and labelling personal or sensitive information requires stringent security measures and ethical practices. Any breach or misuse can lead to legal penalties and reputational damage. Cross-border data transfers present additional compliance complexities, demanding strict adherence to encryption and anonymization protocols. Balancing data utility with privacy preservation remains a major operational challenge for market participants.

Addressing Labour-Intensive Processes and Rising Operational Costs

High-quality data labelling often relies on extensive human input, creating cost and scalability challenges for the Global Data Collection and Labeling Market. It is resource-intensive to manually annotate large datasets, especially for complex image, video, or medical data. While automation tools are evolving, they still require human oversight for nuanced tasks that machines struggle to interpret accurately. Fluctuating demand in AI projects can strain staffing and training resources. Maintaining consistent accuracy across large annotation teams is difficult without robust quality control frameworks. These operational pressures can slow project timelines and increase overall service costs for enterprises.

Market Opportunities

Leveraging Emerging Markets for AI-Driven Data Services

Emerging economies are creating new growth avenues for the Global Data Collection and Labeling Market as digital transformation accelerates. It is providing opportunities for service providers to tap into expanding AI adoption in sectors like e-commerce, healthcare, and transportation. Government initiatives in countries such as India, Brazil, and Indonesia are promoting AI research and innovation. Local talent pools and lower operational costs make these regions attractive for setting up data labelling operations. Partnering with regional tech firms can enhance market reach and localization capabilities. The growing number of start-ups in these economies is further expanding the demand for labelled datasets.

Expanding Opportunities in Specialized Industry Applications

Industry-specific AI applications are opening lucrative opportunities for the Global Data Collection and Labeling Market. It is witnessing increased demand from niche sectors such as precision agriculture, environmental monitoring, and industrial automation. In agriculture, annotated drone imagery supports crop health analysis and yield prediction. Environmental agencies require labelled satellite images for tracking deforestation and climate change impacts. Industrial IoT platforms rely on annotated sensor data for predictive maintenance and process optimization. These specialized use cases offer high-value contracts for service providers capable of delivering domain-specific labelling expertise.

Market Segmentation Analysis:

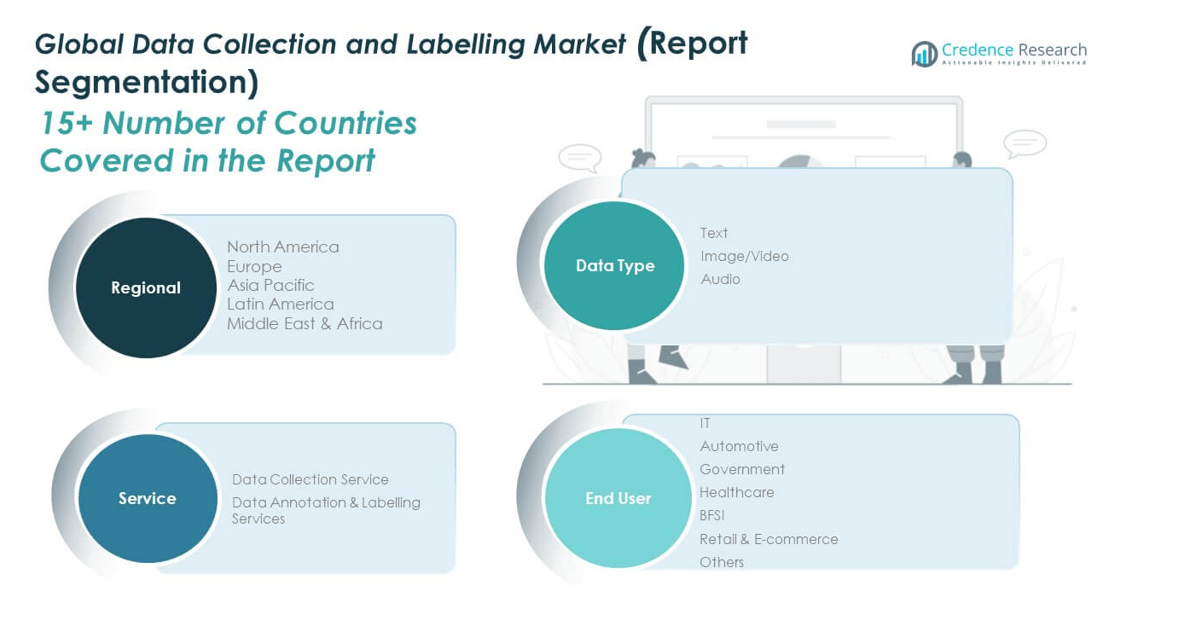
The Global Data Collection and Labeling Market is segmented

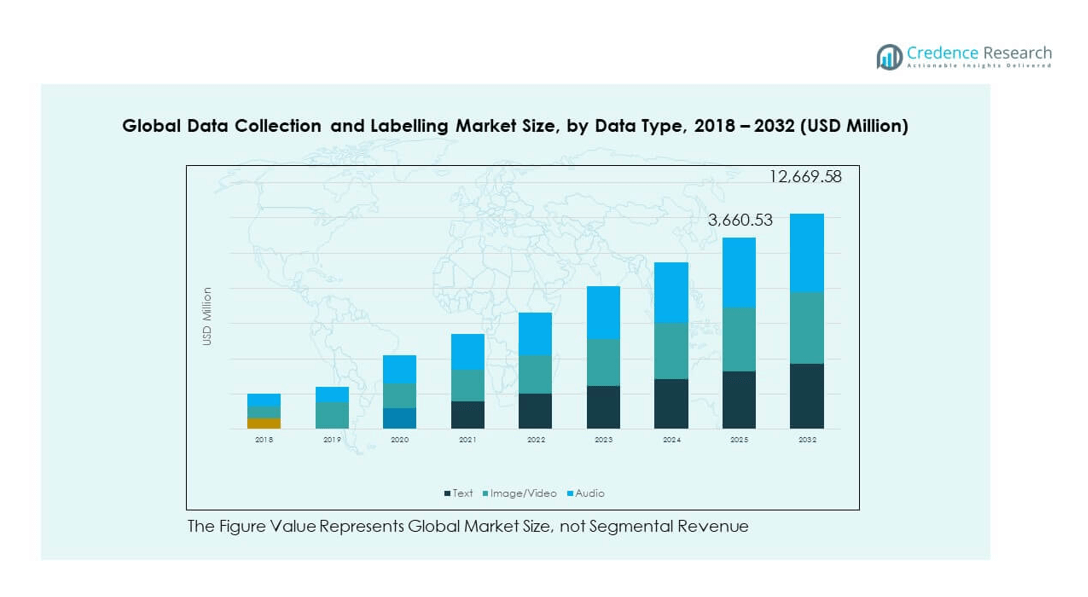
By data type into text, image/video, and audio. Text data remains a core category due to its extensive use in natural language processing, sentiment analysis, and document classification. Image and video data is experiencing strong growth with the rising demand for computer vision applications in autonomous vehicles, surveillance, and retail analytics. Audio data is gaining traction in voice recognition, virtual assistants, and transcription services, supported by advancements in speech-to-text technologies. Each data type plays a vital role in enabling AI systems to interpret and respond accurately across multiple use cases.

By service, the market is divided into data collection services and data annotation & labelling services. Data collection services focus on sourcing structured and unstructured datasets from varied environments, ensuring diversity and relevance for AI model training. Data annotation and labelling services provide the critical step of tagging and categorizing this data to enhance its usability for machine learning algorithms. Both services are integral to delivering reliable datasets that meet industry-specific requirements and accuracy standards.

  • For example, Appen operates a global workforce of over 1 million contributors across more than 170 countries, collecting and annotating text, image, audio, and video data to support AI development for major technology clients, including Microsoft.

By end user, the market includes IT, automotive, government, healthcare, BFSI, retail & e-commerce, and others. The IT sector drives demand for large-scale labelled datasets to support AI and analytics solutions. Automotive applications, particularly in autonomous driving, require high-precision labelled sensor and visual data. Government agencies use labelled datasets for security, surveillance, and administrative automation. Healthcare leverages annotated medical images for diagnostics, while BFSI applies data labelling in fraud detection and risk modelling. Retail & e-commerce uses labelled consumer data for personalization and product recommendation systems.

  • For example, JPMorgan Chase employs AI-driven systems that analyze transaction data in real time to detect and prevent fraud. These systems examine millions of daily transactions, applying behavioral analytics and anomaly detection to flag suspicious activity swiftly.

Data Collection and Labelling Market segmentation

Segmentation:

By Data Type

  • Text
  • Image/Video
  • Audio

By Service

  • Data Collection Service
  • Data Annotation & Labelling Services

By End User

  • IT
  • Automotive
  • Government
  • Healthcare
  • BFSI
  • Retail & E-commerce
  • Others

By Region

  • North America
  • Europe
  • Asia Pacific
  • Latin America
  • Middle East & Africa

Regional Analysis:

North America

The North America Global Data Collection and Labeling Market size was valued at USD 252.72 million in 2018 to USD 783.19 million in 2024 and is anticipated to reach USD 3,167.39 million by 2032, at a CAGR of 19.2% during the forecast period. It accounts for 25.38% of the 2024 global market share. The region maintains a leading position due to its advanced AI infrastructure, strong investment in machine learning projects, and high adoption rates across industries. The presence of major technology companies accelerates innovation in data collection and annotation solutions. The automotive sector, driven by autonomous vehicle development, remains a significant contributor to demand. Healthcare organizations utilize annotated datasets for medical imaging, diagnostics, and predictive analytics. BFSI institutions rely on labelled data for fraud detection and regulatory compliance. The robust start-up ecosystem and government funding programs further enhance the market’s competitive strength.

Europe

The Europe Global Data Collection and Labeling Market size was valued at USD 330.39 million in 2018 to USD 1,028.09 million in 2024 and is anticipated to reach USD 4,180.96 million by 2032, at a CAGR of 19.3% during the forecast period. It holds 33.33% of the 2024 global market share. Strong regulatory frameworks, including GDPR, drive demand for compliant and high-quality data labelling services. The automotive industry in Germany, France, and the UK invests heavily in AI-powered vision systems. Healthcare applications benefit from Europe’s emphasis on precision medicine and medical research. Retail and e-commerce sectors deploy labelled datasets for personalization and inventory optimization. Financial services companies utilize structured datasets for advanced analytics and risk modelling. Strategic collaborations between research institutions and private enterprises strengthen the innovation pipeline. Government-backed AI initiatives also contribute to market expansion.

Asia Pacific

The Asia Pacific Global Data Collection and Labeling Market size was valued at USD 221.02 million in 2018 to USD 722.05 million in 2024 and is anticipated to reach USD 3,125.58 million by 2032, at a CAGR of 20.2% during the forecast period. It captures 23.40% of the 2024 global market share. Rapid digitalization, expanding e-commerce operations, and significant AI investments fuel regional growth. China, Japan, and India lead adoption across automotive, healthcare, and IT industries. Governments are funding AI innovation, fostering local data labelling enterprises. The gaming and entertainment sectors generate rising demand for annotated visual and audio datasets. Outsourcing capabilities in countries such as India and the Philippines make the region a cost-effective hub for data services. Increasing smartphone penetration and IoT adoption generate vast volumes of data requiring annotation. The competitive landscape is diverse, ranging from global providers to emerging regional specialists.

Latin America

The Latin America Global Data Collection and Labeling Market size was valued at USD 100.52 million in 2018 to USD 310.00 million in 2024 and is anticipated to reach USD 1,245.42 million by 2032, at a CAGR of 19.1% during the forecast period. It accounts for 10.05% of the 2024 global market share. The market is gaining momentum with the rise of AI applications in retail, financial services, and logistics. Brazil and Mexico are leading adoption, supported by growing tech start-ups and innovation hubs. Retail and e-commerce companies leverage labelled consumer data for targeted marketing. The automotive sector invests in AI-driven quality control and predictive maintenance systems. Healthcare systems use annotated medical data for diagnostics and telemedicine platforms. The region benefits from a skilled workforce and competitive outsourcing costs. Increasing collaboration with North American technology companies is accelerating capability development.

Middle East

The Middle East Global Data Collection and Labeling Market size was valued at USD 56.90 million in 2018 to USD 174.64 million in 2024 and is anticipated to reach USD 696.83 million by 2032, at a CAGR of 19.0% during the forecast period. It represents 5.66% of the 2024 global market share. The region is witnessing increased adoption of AI in sectors such as oil and gas, smart cities, and public administration. The UAE and Saudi Arabia are at the forefront, implementing national AI strategies. Retail and financial services sectors utilize labelled datasets for customer engagement and fraud prevention. Healthcare providers adopt annotated imaging data to improve diagnostics. Smart city projects generate demand for real-time labelled sensor and video data. Partnerships with global technology firms are enhancing local expertise. Investments in AI-focused education and training programs are building a skilled workforce for data services.

Africa

The Africa Global Data Collection and Labeling Market size was valued at USD 22.94 million in 2018 to USD 67.53 million in 2024 and is anticipated to reach USD 253.39 million by 2032, at a CAGR of 18.1% during the forecast period. It holds 2.19% of the 2024 global market share. The market is at an early growth stage but shows potential with rising digital adoption and AI-focused initiatives. South Africa leads the region, followed by Nigeria and Kenya, in implementing AI for finance, healthcare, and agriculture. E-commerce platforms are leveraging labelled datasets for customer personalization. Agricultural applications use annotated drone and satellite imagery for crop monitoring. Healthcare organizations integrate labelled medical data for telemedicine services. Limited infrastructure and high operational costs present challenges. International partnerships and donor-backed technology projects are playing a key role in market development.

Shape Your Report to Specific Countries or Regions & Enjoy 30% Off!

Key Player Analysis:

  • Scale AI
  • Reality AI
  • Labelbox, Inc.
  • Dobility Inc.
  • Telcus International
  • Globalme Localization Inc.
  • Trilldata Technologies PVT LTD.
  • Appen Limited
  • iMerit
  • SuperAnnotate
  • Other Key Players

Competitive Analysis:

The Global Data Collection and Labeling Market is highly competitive, with a mix of established technology firms, specialized service providers, and emerging start-ups. It is driven by continuous innovation in AI-powered annotation tools, automation capabilities, and quality control processes. Key players such as Scale AI, Appen Limited, Labelbox, iMerit, and SuperAnnotate are expanding service portfolios to cater to diverse industry needs, including automotive, healthcare, and retail. Strategic alliances, mergers, and acquisitions are common to strengthen geographic presence and technological expertise. Companies focus on domain-specific labelling solutions to enhance value propositions and secure long-term contracts with enterprise clients. Investment in scalable cloud-based platforms and AI-assisted workflows remains a critical growth strategy.

Recent Developments:

  • In June 2025, TELUS Corporation announced a proposal to acquire all outstanding shares of TELUS Digital at a 15% premium over the previous day’s closing price. This acquisition, if finalized, will drive further operational integration between TELUS and its digital unit, enabling greater transformation and efficiency across sectors such as telecommunications, health, agriculture, and consumer goods.
  • In June 2025, Scale AI attracted a $14.3 billion investment from Meta, with Meta acquiring a 49% stake in Scale AI. As part of this agreement, Scale AI’s CEO Alexandr Wang is joining Meta to lead its new Superintelligence lab, while Scale’s chief strategy officer, Jason Droege, steps in as interim CEO. The partnership is aimed at enhancing Meta’s AI capabilities and advancing joint data-generation projects for artificial intelligence models.
  • In June 2024, iMerit also released a 3D Multi-Sensor Fusion Tool that enables the precise annotation of Lidar, radar, and camera data for multi-modal AI applications such as autonomous vehicles. iMerit continues to expand its ecosystem, partnering with industry leaders like Labelbox and AWS to offer scalable annotation services, and recently inaugurated an Automotive AI Center of Excellence in Coimbatore in June 2025.
  • In April 2025, Telus International (TELUS Digital Experience) announced a strategic collaboration with Zendesk to integrate TELUS’ global customer experience (CX) talent and generative AI platform Fuel iX™ into Zendesk’s CRM and call-center-as-a-service solutions.

Market Concentration & Characteristics:

The Global Data Collection and Labeling Market exhibits moderate to high concentration, with a few dominant players holding significant market share alongside numerous regional specialists. It is characterized by high entry barriers due to the technical expertise, infrastructure, and quality standards required for competitive service delivery. Demand is fueled by the integration of AI across industries, creating opportunities for both large-scale providers and niche firms offering specialized data annotation. Continuous innovation, compliance with data privacy regulations, and adaptability to evolving AI models define market success. Strategic differentiation often stems from domain expertise, automation efficiency, and the ability to handle large, complex datasets with accuracy.

Report Coverage:

The research report offers an in-depth analysis based on Data Type, Service and End User. It details leading market players, providing an overview of their business, product offerings, investments, revenue streams, and key applications. Additionally, the report includes insights into the competitive environment, SWOT analysis, current market trends, as well as the primary drivers and constraints. Furthermore, it discusses various factors that have driven market expansion in recent years. The report also explores market dynamics, regulatory scenarios, and technological advancements that are shaping the industry. It assesses the impact of external factors and global economic changes on market growth. Lastly, it provides strategic recommendations for new entrants and established companies to navigate the complexities of the market.

Future Outlook:

  • Expansion of AI and machine learning adoption will increase demand for high-quality labelled datasets across industries.
  • Growth in autonomous vehicle development will boost requirements for image, video, and sensor data annotation.
  • Rising healthcare digitization will drive usage of annotated medical data for diagnostics and treatment planning.
  • Advancements in cloud-based platforms will enable scalable, faster, and cost-efficient labelling processes.
  • Increased integration of multi-modal data annotation will enhance AI model accuracy and versatility.
  • Strategic collaborations between global and regional players will accelerate service innovation and market reach.
  • Adoption of synthetic data generation will complement real-world datasets for model training.
  • Expansion of AI applications in retail and e-commerce will heighten demand for personalized data labelling.
  • Growing compliance needs will push service providers to strengthen privacy and data governance frameworks.
  • Emerging economies will present new outsourcing and growth opportunities for service providers.

CHAPTER NO. 1 :   GENESIS OF THE MARKET       

1.1 Market Prelude – Introduction & Scope

1.2 The Big Picture – Objectives & Vision

1.3 Strategic Edge – Unique Value Proposition

1.4 Stakeholder Compass – Key Beneficiaries

CHAPTER NO. 2 :   EXECUTIVE LENS

2.1 Pulse of the Industry – Market Snapshot

2.2 Growth Arc – Revenue Projections (USD Million)

2.3. Premium Insights – Based on Primary Interviews      

CHAPTER NO. 3 :   DATA COLLECTION AND LABELING MARKET FORCES & INDUSTRY PULSE

3.1 Foundations of Change – Market Overview
3.2 Catalysts of Expansion – Key Market Drivers
3.2.1 Momentum Boosters – Growth Triggers
3.2.2 Innovation Fuel – Disruptive Technologies
3.3 Headwinds & Crosswinds – Market Restraints
3.3.1 Regulatory Tides – Compliance Challenges
3.3.2 Economic Frictions – Inflationary Pressures
3.4 Untapped Horizons – Growth Potential & Opportunities
3.5 Strategic Navigation – Industry Frameworks
3.5.1 Market Equilibrium – Porter’s Five Forces
3.5.2 Ecosystem Dynamics – Value Chain Analysis
3.5.3 Macro Forces – PESTEL Breakdown

3.6 Price Trend Analysis

3.6.1 Regional Price Trend
3.6.2 Price Trend by Data Type

CHAPTER NO. 4 :   KEY INVESTMENT EPICENTER

4.1 Regional Goldmines – High-Growth Geographies

4.2 Product Frontiers – Lucrative Data Type Categories

4.3 Service Sweet Spots – Emerging Demand Segments

CHAPTER NO. 5: REVENUE TRAJECTORY & WEALTH MAPPING

5.1 Momentum Metrics – Forecast & Growth Curves

5.2 Regional Revenue Footprint – Market Share Insights

5.3 Segmental Wealth Flow – Data Type, Service, & End User Revenue

CHAPTER NO. 6 :   TRADE & COMMERCE ANALYSIS       

6.1.      Import Analysis by Region

6.1.1.   Global Data Collection and Labeling Market Import Volume By Region

6.2.      Export Analysis by Region

6.2.1.   Global Data Collection and Labeling Market Export Volume By Region

CHAPTER NO. 7 :   COMPETITION ANALYSIS         

7.1.      Company Market Share Analysis

7.1.1.   Global Data Collection and Labeling Market: Company Market Share

7.1.      Global Data Collection and Labeling Market Company Volume Market Share

7.2.      Global Data Collection and Labeling Market Company Revenue Market Share

7.3.      Strategic Developments

7.3.1.   Acquisitions & Mergers

7.3.2.   New Product Launch

7.3.3.   Regional Expansion

7.4.      Competitive Dashboard

7.5.    Company Assessment Metrics, 2024

CHAPTER NO. 8 :   DATA COLLECTION AND LABELING MARKET – BY DATA TYPE SEGMENT ANALYSIS

8.1.      Data Collection and Labeling Market Overview By Data Type Segment

8.1.1.   Data Collection and Labeling Market Volume Share By Data Type

8.1.2.   Data Collection and Labeling Market Revenue Share By Data Type

8.2.      Text

8.3.      Image/Video

8.4.      Audio

CHAPTER NO. 9 :   DATA COLLECTION AND LABELING MARKET – BY SERVICE SEGMENT ANALYSIS

9.1.      Data Collection and Labeling Market Overview By Service Segment

9.1.1.   Data Collection and Labeling Market Volume Share By Service

9.1.2.   Data Collection and Labeling Market Revenue Share By Service

9.2.      Data Collection Service

8.3.      Data Annotation & Labelling Services

CHAPTER NO. 10 : DATA COLLECTION AND LABELING MARKET – BY END USER SEGMENT ANALYSIS

10.1.    Data Collection and Labeling Market Overview By End User Segment

10.1.1. Data Collection and Labeling Market Volume Share By End User

10.1.2. Data Collection and Labeling Market Revenue Share By End User

10.2.    IT

10.3.    Automotive

10.4.    Government

10.5.    Healthcare

10.6.   BFSI

10.7.   Retail & E-commerce

10.8.   Others

CHAPTER NO. 11 : DATA COLLECTION AND LABELING MARKET – REGIONAL ANALYSIS

11.1.    Data Collection and Labeling Market Overview By Region Segment

11.1.1. Global Data Collection and Labeling Market Volume Share By Region

11.1.2. Global Data Collection and Labeling Market Revenue Share By Region

11.1.3. Regions

11.1.4. Global Data Collection and Labeling Market Volume By Region

11.1.5.Global Data Collection and Labeling Market Revenue By Region

11.1.6. Data Type

11.1.7. Global Data Collection and Labeling Market Volume By Data Type

11.1.8. Global Data Collection and Labeling Market Revenue By Data Type

11.1.9. Service

11.1.10.           Global Data Collection and Labeling Market Volume By Service

11.1.11.           Global Data Collection and Labeling Market Revenue By Service

11.1.12.           End User

11.1.13.           Global Data Collection and Labeling Market Volume By End User

11.1.14.           Global Data Collection and Labeling Market Revenue By End User

CHAPTER NO. 12 : NORTH AMERICA DATA COLLECTION AND LABELING MARKET – COUNTRY ANALYSIS         

12.1.    North America Data Collection and Labeling Market Overview By Country Segment

12.1.1. North America Data Collection and Labeling Market Volume Share By Region

12.1.2. North America Data Collection and Labeling Market Revenue Share By Region

12.2.    North America

12.2.1. North America Data Collection and Labeling Market Volume By Country

12.2.2. North America Data Collection and Labeling Market Revenue By Country

12.2.3. Data Type

12.2.4. North America Data Collection and Labeling Market Volume By Data Type

12.2.5. North America Data Collection and Labeling Market Revenue By Data Type

12.2.6. Service

12.2.7.North America Data Collection and Labeling Market Volume By Service

12.2.8. North America Data Collection and Labeling Market Revenue By Service

12.2.9. End User

12.2.10.           North America Data Collection and Labeling Market Volume By End User

12.2.11.           North America Data Collection and Labeling Market Revenue By End User

12.3.    U.S.

12.4.    Canada

12.5.    Mexico

CHAPTER NO. 13 : EUROPE DATA COLLECTION AND LABELING MARKET – COUNTRY ANALYSIS

13.1.    Europe Data Collection and Labeling Market Overview By Country Segment

13.1.1. Europe Data Collection and Labeling Market Volume Share By Region

13.1.2. Europe Data Collection and Labeling Market Revenue Share By Region

13.2.    Europe

13.2.1. Europe Data Collection and Labeling Market Volume By Country

13.2.2. Europe Data Collection and Labeling Market Revenue By Country

13.2.3. Data Type

13.2.4. Europe Data Collection and Labeling Market Volume By Data Type

13.2.5. Europe Data Collection and Labeling Market Revenue By Data Type

13.2.6. Service

13.2.7. Europe Data Collection and Labeling Market Volume By Service

13.2.8. Europe Data Collection and Labeling Market Revenue By Service

13.2.9. End User

13.2.10.           Europe Data Collection and Labeling Market Volume By End User

13.2.11.           Europe Data Collection and Labeling Market Revenue By End User

13.3.    UK

13.4.    France

13.5.    Germany

13.6.    Italy

13.7.    Spain

13.8.    Russia

13.9.   Rest of Europe

CHAPTER NO. 14 : ASIA PACIFIC DATA COLLECTION AND LABELING MARKET – COUNTRY ANALYSIS

14.1.    Asia Pacific Data Collection and Labeling Market Overview By Country Segment

14.1.1. Asia Pacific Data Collection and Labeling Market Volume Share By Region

14.1.2. Asia Pacific Data Collection and Labeling Market Revenue Share By Region

14.2.    Asia Pacific

14.2.1. Asia Pacific Data Collection and Labeling Market Volume By Country

14.2.2. Asia Pacific Data Collection and Labeling Market Revenue By Country

14.2.3. Data Type

14.2.4.Asia Pacific Data Collection and Labeling Market Volume By Data Type

14.2.5. Asia Pacific Data Collection and Labeling Market Revenue By Data Type

14.2.6. Service

14.2.7. Asia Pacific Data Collection and Labeling Market Volume By Service

14.2.8. Asia Pacific Data Collection and Labeling Market Revenue By Service

14.2.9. End User

14.2.10.           Asia Pacific Data Collection and Labeling Market Volume By End User

14.2.11.           Asia Pacific Data Collection and Labeling Market Revenue By End User

14.3.    China

14.4.    Japan

14.5.    South Korea

14.6.    India

14.7.    Australia

14.8.    Southeast Asia

14.9.    Rest of Asia Pacific

CHAPTER NO. 15 : LATIN AMERICA DATA COLLECTION AND LABELING MARKET – COUNTRY ANALYSIS

15.1.    Latin America Data Collection and Labeling Market Overview By Country Segment

15.1.1. Latin America Data Collection and Labeling Market Volume Share By Region

15.1.2. Latin America Data Collection and Labeling Market Revenue Share By Region

15.2.    Latin America

15.2.1. Latin America Data Collection and Labeling Market Volume By Country

15.2.2. Latin America Data Collection and Labeling Market Revenue By Country

15.2.3. Data Type

15.2.4. Latin America Data Collection and Labeling Market Volume By Data Type

15.2.5. Latin America Data Collection and Labeling Market Revenue By Data Type

15.2.6. Service

15.2.7.Latin America Data Collection and Labeling Market Volume By Service

15.2.8. Latin America Data Collection and Labeling Market Revenue By Service

15.2.9. End User

15.2.10.           Latin America Data Collection and Labeling Market Volume By End User

15.2.11.           Latin America Data Collection and Labeling Market Revenue By End User

15.3.    Brazil

15.4.    Argentina

15.5.    Rest of Latin America

CHAPTER NO. 16 : MIDDLE EAST DATA COLLECTION AND LABELING MARKET – COUNTRY ANALYSIS

16.1.    Middle East Data Collection and Labeling Market Overview By Country Segment

16.1.1. Middle East Data Collection and Labeling Market Volume Share By Region

16.1.2. Middle East Data Collection and Labeling Market Revenue Share By Region

16.2.    Middle East

16.2.1. Middle East Data Collection and Labeling Market Volume By Country

16.2.2. Middle East Data Collection and Labeling Market Revenue By Country

16.2.3. Data Type

16.2.4. Middle East Data Collection and Labeling Market Volume By Data Type

16.2.5. Middle East Data Collection and Labeling Market Revenue By Data Type

16.2.6. Service

16.2.7. Middle East Data Collection and Labeling Market Volume By Service

16.2.8. Middle East Data Collection and Labeling Market Revenue By Service

16.2.9. End User

16.2.10.           Middle East Data Collection and Labeling Market Volume By End User

16.2.11.           Middle East Data Collection and Labeling Market Revenue By End User

16.3.    GCC Countries

16.4.    Israel

16.5.    Turkey

16.6.    Rest of Middle East

CHAPTER NO. 17 : AFRICA DATA COLLECTION AND LABELING MARKET – COUNTRY ANALYSIS

17.1.    Africa Data Collection and Labeling Market Overview By Country Segment

17.1.1. Africa Data Collection and Labeling Market Volume Share By Region

17.1.2. Africa Data Collection and Labeling Market Revenue Share By Region

17.2.    Africa

17.2.1.Africa Data Collection and Labeling Market Volume By Country

17.2.2.Africa Data Collection and Labeling Market Revenue By Country

17.2.3.  Data Type

17.2.4. Africa Data Collection and Labeling Market Volume By Data Type

17.2.5. Africa Data Collection and Labeling Market Revenue By Data Type

17.2.6. Service

17.2.7. Africa Data Collection and Labeling Market Volume By Service

17.2.8. Africa Data Collection and Labeling Market Revenue By Service

17.2.9. End User

17.2.10.           Africa Data Collection and Labeling Market Volume By End User

17.2.11.           Africa Data Collection and Labeling Market Revenue By End User

17.3.    South Africa

17.4.    Egypt

17.5.    Rest of Africa

CHAPTER NO. 18 : COMPANY PROFILES      

18.1.    Scale AI

18.1.1. Company Overview

18.1.2. Service Portfolio

18.1.3. Financial Overview

18.1.4.Recent Developments

18.1.5. Growth Strategy

18.1.6. SWOT Analysis

18.2.    Reality AI

18.3.    Labelbox, Inc

18.4.    Dobility Inc

18.5.     Telcus International

18.6.    Globalme Localization Inc

18.7.    Trilldata Technologies PVT LTD.

18.8.    Appen Limited

18.9.    iMerit

18.10.  SuperAnnotate

18.11.  Other Key Players

Request Free Sample

Ready to Transform Data into Decisions?

Request Your Sample Report and Start Your Journey of Informed Choices


Providing the strategic compass for industry titans.

cr-clients-logos

Frequently Asked Questions:

What is the current market size for Global Data Collection and Labelling Market, and what is its projected size in 2032?

The Global Data Collection and Labelling Market was valued at USD 3,085.5 million in 2024 and is projected to reach USD 12,669.6 million by 2032.

At what Compound Annual Growth Rate is the Global Data Collection and Labelling Market projected to grow between 2024 and 2032?

The Global Data Collection and Labelling Market is expected to grow at a CAGR of 19.41% during the forecast period from 2024 to 2032.

What are the primary factors fueling the growth of the Global Data Collection and Labelling Market?

The Global Data Collection and Labelling Market is fueled by rising AI and ML adoption, autonomous system development, digital transformation, and expanding IoT ecosystems.

Who are the leading companies in the Global Data Collection and Labelling Market?

Key players in the Global Data Collection and Labelling Market include Scale AI, Appen Limited, Labelbox, iMerit, and SuperAnnotate.

About Author

Sushant Phapale

Sushant Phapale

ICT & Automation Expert

Sushant is an expert in ICT, automation, and electronics with a passion for innovation and market trends.

View Profile

Colocation Edge Data Center Market

Colocation Edge Data Center Market size was valued at USD 8292.5 million in 2024 and is anticipated to reach USD 34949 million by 2032, at a CAGR of 19.7% during the forecast period.

Data Center Immersion Cooling Market

The Data Center Immersion Cooling market size was valued at USD 691.01 million in 2018, increased to USD 1,487.18 million in 2024, and is anticipated to reach USD 6,447.73 million by 2032, at a CAGR of 18.77% during the forecast period.

Next-Gen Data Center ASIC Market

The Next-Gen Data Center ASIC market size was valued at USD 2,855.17 million in 2018, grew to USD 5,501.97 million in 2024, and is anticipated to reach USD 14,841.77 million by 2032, at a CAGR of 12.31% during the forecast period.

Data Centre Security Market

The Data Centre Security Market is projected to grow from USD 16,011 million in 2024 to USD 38,773 million by 2032, registering a CAGR of 11.69% during the forecast period.

Cloud Database Market

The Cloud Database Market size was valued at USD 12615 million in 2024 and is anticipated to reach USD 40229.9 million by 2032, at a CAGR of 15.6% during the forecast period (2024-2032).

Data Center ASIC Market

The Global Data Center ASIC Market size was valued at USD 2,471.66 million in 2018 to USD 3,493.70 million in 2024 and is anticipated to reach USD 5,460.53 million by 2032, at a CAGR of 5.34% during the forecast period.

Big Data in Healthcare Market

The Big Data in Healthcare Market size was valued at USD 18,777.25 million in 2018 to USD 38,165.37 million in 2024 and is anticipated to reach USD 1,18,362.87 million by 2032, at a CAGR of 14.17 % during the forecast period.

Marine Big Data Market

The Marine Big Data market is projected to grow from USD 1,202 million in 2024 to USD 2,049.8 million by 2032, registering a CAGR of 6.9% during the forecast period.

Australia and New Zealand Data Centre Construction Market

The Australia & New Zealand Data Centre Construction market size was valued at USD 1,408.21 million in 2018, increased to USD 2,344.55 million in 2024, and is anticipated to reach USD 4,773.86 million by 2032, at a CAGR of 8.66% during the forecast period.

Corporate Performance Management Market

The Corporate Performance Management Market size was valued at USD 9529.7 million in 2024 and is anticipated to reach USD 25514.1 million by 2032, at a CAGR of 13.1% during the forecast period (2024-2032).

End User Experience Monitoring Market

The End User Experience Monitoring (EUEM) Market size was valued at USD 3890.5 million in 2024 and is anticipated to reach USD 12321.4 million by 2032, growing at a CAGR of 15.5% during the forecast period.

Composite AI Market

The Global Composite AI Market size was valued at USD 1,847.20 million in 2018 to USD 11,791.70 million in 2024 and is anticipated to reach USD 1,39,634.72 million by 2032, at a CAGR of 36.20% during the forecast period.

Cloud Social Media Management Market

The Global Cloud Social Media Management Market size was valued at USD 4,335.18 million in 2018 to USD 8,453.98 million in 2024 and is anticipated to reach USD 23,463.33 million by 2032, at a CAGR of 12.68% during the forecast period.

Canada Telecommunication Services Market

The Canada Telecommunication Services Market size was valued at USD 42,325.05 million in 2018 to USD 52,251.2 million in 2024 and is anticipated to reach USD 73,791.98 million by 2032, at a CAGR of 4.41% during the forecast period.

Connected Baby Monitor Market

The Global Connected Baby Monitor Market size was valued at USD 800.28 million in 2018 to USD 1,370.37 million in 2024 and is anticipated to reach USD 2,910.31 million by 2032, at a CAGR of 9.20% during the forecast period.

Enterprise Wireless Local Area Network (WLAN) Market

The Enterprise Wireless Local Area Network (WLAN) market was valued at USD 8,060.4 million in 2024. It is projected to grow to USD 21,428.1 million by 2032, reflecting a compound annual growth rate (CAGR) of 13% over the forecast period.

Travel Technology Solutions Market

The Travel Technology Solutions Market size was valued at USD 9308 million in 2024 and is anticipated to reach USD 19664.1 million by 2032, at a CAGR of 9.8% during the forecast period (2024-2032).

Explosive Detectors Market

The Explosive Detectors Market size was valued at USD 11214.2 million in 2024 and is anticipated to reach USD 27765.9 million by 2032, at a CAGR of 12% during the forecast period (2024-2032).

Live Streaming Market

The live streaming market size was valued at USD 79554.6 million in 2024 and is anticipated to reach USD 214504.7 million by 2032, at a CAGR of 13.2 % during the forecast period (2024-2032).

Distributed Antenna Systems Market

Distributed Antenna Systems (DAS) Market size was valued at USD 2809 million in 2024 and is anticipated to reach USD 5597.1 million by 2032, at a CAGR of 9% during the forecast period.

Image Processing Systems Market

The Image Processing Systems Market size was valued at USD 13646 million in 2024 and is anticipated to reach USD 26208.6 million by 2032, at a CAGR of 8.5% during the forecast period (2024-2032).

Purchase Options

The report comes as a view-only PDF document, optimized for individual clients. This version is recommended for personal digital use and does not allow printing.
$4699

To meet the needs of modern corporate teams, our report comes in two formats: a printable PDF and a data-rich Excel sheet. This package is optimized for internal analysis and multi-location access, making it an excellent choice for organizations with distributed workforce.
$5699

The report will be delivered in printable PDF format along with the report’s data Excel sheet. This license offers 100 Free Analyst hours where the client can utilize Credence Research Inc.’s research team. It is highly recommended for organizations seeking to execute short, customized research projects related to the scope of the purchased report.
$12699

Credence Staff 3

WILLIAM, North America

Support Staff at Credence Research

KEITH PHILLIPS, Europe

Lee - CR Sales Staff

LEE VALLANCE, Asia Pacific

Kieran Jameson

KIERAN JAMESON, Australia

Report delivery within 24 to 48 hours

User Review

Thank you for the data! The numbers are exactly what we asked for and what we need to build our business case.

Materials Scientist
(privacy requested)

User Review

The report was an excellent overview of the Industrial Burners market. This report does a great job of breaking everything down into manageable chunks.

Imre Hof
Management Assistant, Bekaert

cr-clients-logos

Request Sample