Global Compression Sportswear Market size was valued at USD 4240.00 million in 2023 and is anticipated to reach USD 10,671.46 million by 2032, at a CAGR of 10.80% during the forecast period (2023-2032).
The Global Compression Sportswear Market is driven by the growing awareness of fitness and performance enhancement, with increasing participation in sports and fitness activities. Rising health consciousness, coupled with the benefits of compression apparel in improving blood circulation, reducing muscle fatigue, and enhancing recovery, is fueling market expansion. Technological advancements, such as moisture-wicking fabrics, seamless designs, and smart textiles with embedded sensors, are further driving demand. Additionally, the growing popularity of athleisure, where compression wear is embraced for both sports and casual use, is boosting market growth. E-commerce proliferation and influencer marketing are accelerating consumer adoption. Sustainable and eco-friendly materials are gaining traction as manufacturers respond to environmental concerns. The expanding application of compression apparel beyond professional athletes to recreational users and the elderly population seeking muscle support is further widening market opportunities. These factors collectively position the market for strong growth during the forecast period.
The Global Compression Sportswear Market is witnessing significant growth across regions, driven by increasing fitness awareness and advancements in sports apparel. North America leads due to high consumer spending on athletic wear and the presence of established brands. Europe follows closely, with rising demand for sustainable and high-performance sportswear. Asia-Pacific is experiencing rapid expansion, fueled by growing health consciousness, e-commerce penetration, and the rising popularity of sports activities. Latin America and the Middle East & Africa are emerging markets, benefiting from increasing sports participation and urbanization. Key players in the market include Under Armour, Nike, Adidas, Puma, Skins International Trading AG, 2XU Pty Ltd., CW-X, Reebok International Ltd., Bauerfeind AG, Asics Corporation, Zensah, and Fuaark. These companies focus on product innovation, performance enhancement, and sustainable materials to gain a competitive edge. The market continues to evolve with technological advancements, smart textiles, and increasing investments in research and development.
Access crucial information at unmatched prices!
Request your sample report today & start making informed decisions powered by Credence Research Inc.!
The Global Compression Sportswear Market was valued at USD 4,240.00 million in 2023 and is projected to reach USD 10,671.46 million by 2032, growing at a CAGR of 10.80% during the forecast period.
Increasing awareness of fitness and performance enhancement is driving demand for compression sportswear among athletes and fitness enthusiasts.
Advancements in fabric technology, including moisture-wicking, temperature regulation, and muscle support, are influencing consumer preferences.
Major players like Nike, Adidas, Under Armour, and Puma are focusing on product innovation, sustainable materials, and smart textiles to stay competitive.
High production costs and counterfeit products pose challenges to market growth, impacting profitability and brand reputation.
North America and Europe dominate the market, while Asia-Pacific is witnessing rapid growth due to increasing sports participation and e-commerce expansion.
Rising demand for eco-friendly and customized sportswear presents lucrative opportunities for market players.
Report Scope
This report segments the global Compression Sportswear Market as follows:
Market Drivers
Growing Health and Fitness Awareness
The increasing emphasis on health and fitness is a key driver of the Global Compression Sportswear Market. A rising number of individuals are adopting active lifestyles, engaging in fitness routines, and participating in sports to maintain their physical well-being. For instance, the Global Wellness Institute notes that the global wellness economy is experiencing significant growth, reflecting a broader societal shift toward prioritizing health and wellness. Compression sportswear enhances performance, improves muscle support, and reduces the risk of injuries, making it a preferred choice among fitness enthusiasts. Additionally, the increasing prevalence of lifestyle diseases, such as obesity and cardiovascular conditions, has encouraged people to adopt regular exercise, further boosting demand for compression apparel. Governments and organizations promoting health and wellness initiatives are also playing a crucial role in market expansion. The integration of compression technology in sportswear is driving market growth as consumers seek functional apparel that enhances their fitness experience.
Performance Enhancement and Recovery Benefits
The ability of compression sportswear to enhance athletic performance and speed up muscle recovery is a significant growth factor. These garments provide targeted compression, improving blood circulation, reducing muscle oscillation, and minimizing fatigue during physical activities. Athletes and fitness enthusiasts prefer compression wear for its ability to optimize endurance, reduce soreness, and accelerate post-workout recovery. The growing awareness of these benefits has led to increased adoption across various sports disciplines, from running and cycling to weightlifting and team sports. Moreover, advancements in fabric technology, such as moisture-wicking, temperature regulation, and anti-bacterial properties, further contribute to the rising demand for high-performance compression apparel. With ongoing research in sports science supporting the physiological benefits of compression clothing, its market penetration is expected to rise significantly.
Expansion of the Athleisure Trend
The blending of activewear and casual fashion, commonly known as athleisure, is a key driver of the compression sportswear market. Consumers increasingly prioritize comfort and functionality in their everyday clothing, leading to a surge in demand for compression apparel beyond athletic activities. For instance, in the U.S., two-thirds of adults express a desire to wear activewear daily, highlighting its appeal as a lifestyle choice rather than just a fashion trend. Compression leggings, tops, and shorts are now widely accepted as fashionable casual wear, fueling market growth. The trend is further reinforced by social media influencers, celebrities, and fitness enthusiasts who promote compression wear as a stylish yet practical choice. Additionally, e-commerce platforms have made high-quality compression sportswear more accessible, allowing consumers to explore a variety of brands and styles. As fashion preferences continue to shift towards versatile and performance-driven clothing, the athleisure trend will further support market expansion.
Technological Advancements and Sustainable Innovations
Innovations in fabric technology and sustainable manufacturing practices are contributing significantly to market growth. Smart compression garments equipped with sensors to monitor muscle activity, hydration levels, and heart rate are gaining traction among professional athletes and fitness enthusiasts. Additionally, the demand for eco-friendly and sustainable sportswear is increasing as consumers become more environmentally conscious. Leading brands are investing in recycled materials, biodegradable fabrics, and ethical production processes to cater to this evolving demand. The development of compression sportswear with enhanced durability, breathability, and flexibility is further attracting a wider consumer base. As manufacturers continue to integrate cutting-edge technologies and sustainable materials, the compression sportswear market is set to experience accelerated growth in the coming years.
Market Trends
Rising Demand for Smart Compression Wear
The integration of smart technology into compression sportswear is a growing trend, revolutionizing the industry. Manufacturers are incorporating embedded sensors and biometric monitoring systems into compression garments to track key health metrics such as heart rate, muscle activity, hydration levels, and posture. This innovation enhances training efficiency by providing real-time data to athletes and fitness enthusiasts, allowing them to optimize their performance and recovery. The increasing adoption of wearable technology in sports and fitness sectors is further driving the demand for smart compression apparel. As consumers seek apparel that offers both functionality and data-driven insights, smart compression wear is expected to gain significant traction in the coming years.
Sustainable and Eco-Friendly Materials Gaining Traction
With the rising emphasis on sustainability, brands are shifting towards eco-friendly materials and ethical manufacturing practices. Consumers are increasingly prioritizing environmentally responsible products, leading to the adoption of recycled fabrics, biodegradable fibers, and water-efficient dyeing processes in compression sportswear. For example, initiatives like the 2025 Recycled Polyester Challenge encourage companies to source a significant portion of their polyester from recycled materials, reducing environmental impact. Additionally, initiatives such as circular fashion, where old garments are recycled into new ones, are gaining momentum. As sustainability becomes a key purchasing factor, brands incorporating green practices into their compression sportswear lines are poised for long-term growth.
Expansion of the Athleisure Movement
The increasing overlap between fitness apparel and everyday fashion continues to drive demand for compression sportswear. Consumers now prefer compression garments not only for sports and workouts but also for casual and leisurewear, fueling the rise of the athleisure trend. The versatility, comfort, and aesthetic appeal of compression leggings, tops, and shorts make them ideal for both exercise and daily wear. Social media influencers, fitness bloggers, and celebrities actively promote compression sportswear as a fashionable and functional choice, further popularizing its use in non-sporting settings. As athleisure becomes a dominant trend in the apparel industry, the compression sportswear market is benefiting from this shift in consumer preferences.
E-Commerce and Direct-to-Consumer (DTC) Brands Driving Market Growth
The rapid growth of e-commerce and direct-to-consumer (DTC) business models is significantly impacting the compression sportswear market. Online platforms provide consumers with greater accessibility to a wide range of compression apparel, enabling brands to reach global audiences without the need for physical stores. For example, the use of augmented reality (AR) technology in virtual fitting rooms allows customers to visualize how garments will fit without trying them on physically, enhancing the shopping experience. The rise of DTC brands, which sell directly to consumers through their websites and social media channels, allows companies to offer competitive pricing and personalized shopping experiences. Features such as virtual try-ons, AI-powered recommendations, and subscription-based fitness apparel services are enhancing customer engagement. As digital shopping continues to expand, online channels will remain a key driver of market growth in the compression sportswear industry.
Market Challenges Analysis
High Production Costs and Pricing Challenges
The Global Compression Sportswear Market faces significant challenges due to high production costs associated with advanced fabric technologies and innovative designs. Compression garments require specialized materials that provide durability, elasticity, moisture-wicking properties, and muscle support, leading to increased manufacturing expenses. For instance, the use of advanced materials like moisture-wicking fabrics and temperature-regulating technologies in compression sportswear enhances performance but also increases production costs. Additionally, the integration of smart technology, such as biometric sensors and temperature-regulating fabrics, further elevates costs. These factors make high-quality compression sportswear more expensive, limiting its accessibility to price-sensitive consumers. Many brands struggle to balance premium quality with affordability while maintaining profit margins. Moreover, competition from low-cost manufacturers producing counterfeit or substandard products at lower prices adds further pressure on established brands, affecting overall market growth.
Intense Market Competition and Brand Differentiation
The increasing number of brands entering the compression sportswear segment has led to fierce market competition. Established players must continuously innovate to differentiate their products from competitors offering similar performance-enhancing apparel. The rise of direct-to-consumer (DTC) brands, private-label offerings, and counterfeit products further intensifies this challenge. Additionally, customer loyalty remains difficult to maintain as consumers frequently switch brands based on pricing, trends, and new product innovations. Effective brand positioning, strong marketing strategies, and continuous investment in research and development are crucial for companies to stand out. However, smaller brands with limited resources may struggle to sustain their presence in the market. This competitive landscape makes it challenging for both new entrants and established players to achieve long-term market dominance.
Market Opportunities
The Global Compression Sportswear Market presents significant growth opportunities driven by expanding consumer awareness and technological advancements. The rising adoption of fitness and sports activities across various demographics, including professional athletes, gym enthusiasts, and even individuals seeking muscle support for medical or recovery purposes, is fueling market expansion. The growing popularity of personalized compression wear, which caters to specific sports and body types, is another key opportunity for brands to differentiate themselves. Additionally, the increasing focus on women’s sports and fitness apparel presents a lucrative segment for manufacturers. As more women participate in sports and high-intensity workouts, demand for compression leggings, tops, and sports bras with enhanced support and flexibility is on the rise.
Moreover, the integration of smart textiles and sustainable materials is opening new avenues for innovation. The use of biodegradable and recycled fabrics aligns with the growing demand for eco-friendly sportswear, allowing brands to appeal to environmentally conscious consumers. The expansion of e-commerce and direct-to-consumer (DTC) models also provides an opportunity for companies to reach a global audience without the need for physical retail stores. Digital marketing strategies, influencer collaborations, and AI-driven personalization further enhance brand visibility and customer engagement. Additionally, emerging markets in Asia-Pacific, Latin America, and the Middle East are witnessing a surge in disposable income and fitness awareness, creating strong demand for premium and performance-driven compression apparel. As these trends continue to evolve, companies investing in innovation, sustainability, and digital expansion are well-positioned to capitalize on the market’s growth potential.
Market Segmentation Analysis:
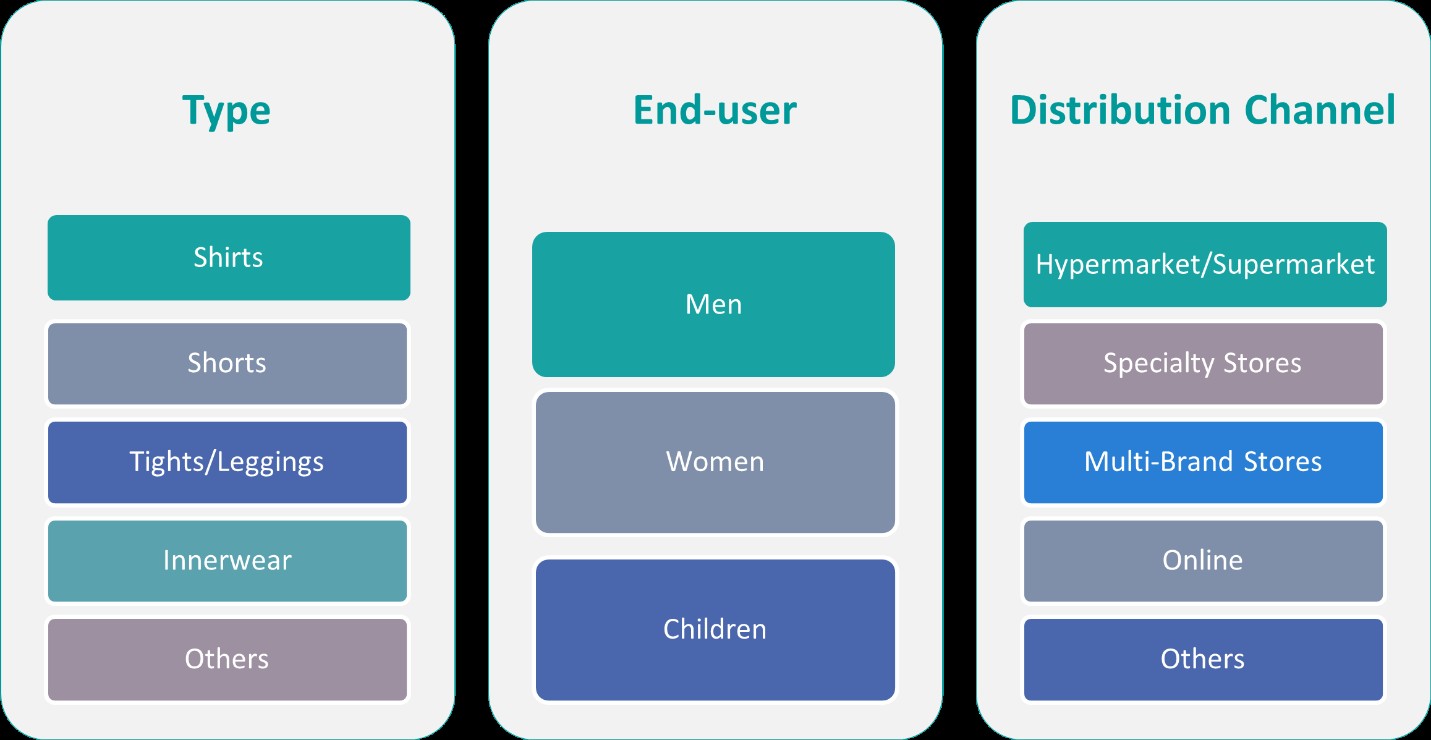
By Product Type:
The Global Compression Sportswear Market is segmented by product type into shirts, shorts, tights/leggings, innerwear, and others. Compression shirts and shorts are widely adopted by athletes and fitness enthusiasts due to their muscle support and moisture-wicking properties. These garments enhance blood circulation and reduce muscle fatigue, making them ideal for high-performance activities. Tights and leggings have gained popularity, especially among runners, cyclists, and gym-goers, due to their flexibility and comfort. The rising trend of athleisure has further boosted demand for compression leggings, which seamlessly transition from workouts to casual wear. Innerwear, including compression socks and base layers, is extensively used for recovery and injury prevention, particularly among endurance athletes. Additionally, the “others” category, which includes compression sleeves, gloves, and full-body suits, is witnessing steady growth due to their targeted support and medical benefits. As consumer awareness of performance-enhancing apparel increases, brands are focusing on product innovation, sustainable materials, and smart textiles to cater to evolving preferences and drive market expansion.
By End- User:
By end-user, the Global Compression Sportswear Market is categorized into men, women, and children. The men’s segment dominates the market, driven by a high adoption rate of compression apparel in professional sports, fitness training, and recreational activities. Male athletes prefer compression wear for enhanced muscle support, sweat control, and injury prevention, contributing to sustained demand. The women’s segment is experiencing significant growth due to increasing participation in sports and fitness programs. The demand for compression leggings, sports bras, and tops tailored to women’s anatomical needs is rising, supported by brand efforts to offer stylish, performance-driven, and sustainable products. Additionally, the children’s segment is gaining momentum as awareness about early sports training, posture correction, and injury prevention grows among parents and schools. The expansion of youth sports programs and increasing fitness consciousness among younger demographics are expected to propel demand for compression wear. As brands continue to develop gender-specific designs and advanced fabric technologies, the market is set for strong, sustained growth across all end-user categories.
Segments:
Based on Product Type:
Shirts
Shorts
Tights/Leggings
Innerwear
Others
Based on End- User:
Men
Women
Children
Based on Distribution Channel:
Hypermarket/Supermarket
Specialty Stores
Multi-Brand Stores
Online
Others
Based on the Geography:
North America
U.S.
Canada
Mexico
Europe
UK
France
Germany
Italy
Spain
Russia
Belgium
Netherlands
Austria
Sweden
Poland
Denmark
Switzerland
Rest of Europe
Asia Pacific
China
Japan
South Korea
India
Australia
Thailand
Indonesia
Vietnam
Malaysia
Philippines
Taiwan
Rest of Asia Pacific
Latin America
Brazil
Argentina
Peru
Chile
Colombia
Rest of Latin America
Middle East
UAE
KSA
Israel
Turkey
Iran
Rest of Middle East
Africa
Egypt
Nigeria
Algeria
Morocco
Rest of Africa
Regional Analysis
North America
North America holds the largest share in the Global Compression Sportswear Market, accounting for approximately 35% of the total revenue. The region’s dominance is driven by a well-established sports industry, high consumer awareness, and strong spending power on performance-enhancing apparel. The growing trend of fitness and outdoor activities, coupled with a rising preference for technologically advanced sportswear, is fueling market expansion. Additionally, the presence of key players such as Nike, Under Armour, and Adidas further strengthens North America’s leadership. The increasing adoption of smart compression wear with biometric tracking capabilities, alongside sustainable product innovations, is expected to sustain market growth. The popularity of athleisure wear also contributes significantly, as consumers seek compression garments that offer both performance benefits and everyday comfort.
Europe
Europe holds a substantial share of the Global Compression Sportswear Market, contributing 28% of total revenue. The region’s market is driven by increasing participation in professional sports, fitness activities, and outdoor recreational pursuits. Countries such as Germany, the UK, and France lead the demand due to a strong emphasis on health and wellness. Additionally, the European market is witnessing a surge in demand for sustainable compression sportswear, with brands investing in eco-friendly materials and ethical manufacturing practices. The growing popularity of women’s sports and the expansion of athleisure fashion trends are further boosting sales. E-commerce platforms play a crucial role in market expansion, allowing brands to reach a broader consumer base through digital channels and direct-to-consumer sales models.
Asia-Pacific
Asia-Pacific is the fastest-growing region in the Global Compression Sportswear Market, holding a 22% market share and expected to witness the highest CAGR during the forecast period. The rapid adoption of fitness trends, increasing disposable income, and urbanization contribute to the region’s expanding market. Countries such as China, Japan, South Korea, and India are key growth drivers, with a growing number of consumers investing in sports apparel and performance-enhancing clothing. The rise of local sportswear brands, government initiatives promoting active lifestyles, and the increasing influence of global fitness trends are accelerating market growth. Moreover, the booming e-commerce sector in Asia-Pacific enables greater accessibility to compression wear, especially in emerging economies where online retail is witnessing exponential growth.
Latin America
Latin America accounts for 10% of the Global Compression Sportswear Market, with steady growth driven by increasing interest in sports, fitness, and gym activities. Countries like Brazil, Mexico, and Argentina are at the forefront of market expansion, with a growing middle-class population investing in high-quality athletic wear. The region’s market is influenced by international brands expanding their presence and local manufacturers producing affordable compression sportswear. Social media marketing and influencer collaborations significantly impact consumer buying behavior, promoting the adoption of compression apparel among younger demographics. Although the market is still developing, increasing awareness of the performance and recovery benefits of compression wear is expected to drive future demand.
Key Player Analysis
Under Armour, Inc.
Nike, Inc.
Adidas AG
Puma SE
Skins International Trading AG
2XU Pty Ltd.
CW-X
Reebok International Ltd.
Bauerfeind AG
Asics Corporation
Zensah
Fuaark
Competitive Analysis
The Global Compression Sportswear Market is highly competitive, with leading players focusing on innovation, performance enhancement, and sustainability. Key players such as Nike, Adidas, Under Armour, Puma, Skins International Trading AG, 2XU Pty Ltd., CW-X, Reebok International Ltd., Bauerfeind AG, Asics Corporation, Zensah, and Fuaark dominate the market through extensive product portfolios and strong brand recognition. These companies invest heavily in research and development to introduce advanced fabric technologies, including moisture-wicking materials, muscle-supporting designs, and temperature-regulating textiles.
Strategic partnerships, endorsements by professional athletes, and aggressive marketing campaigns further strengthen their market presence. The growing demand for eco-friendly and customized sportswear has pushed companies to adopt sustainable materials and digital customization tools. While established brands maintain a stronghold through retail and e-commerce channels, emerging players focus on affordability and niche segments. However, high manufacturing costs and counterfeit products pose challenges, making innovation and brand differentiation key strategies for sustaining market leadership.
Recent Developments
In February 2025, Adidas AG launched several new products, including the Lightblaze shoe and the Mystic Victory pack for football boots. Adidas continues to focus on innovative designs and collaborations.
In January 2025, Nike showcased innovative recovery footwear at CES 2025, featuring compression and heat technology, and is also developing a compression and heat vest as part of its wearable line, collaborating with Hyperice to boost athlete warm-up and recovery.
Market Concentration & Characteristics
The Global Compression Sportswear Market exhibits a moderate to high market concentration, with a few dominant players holding a significant share due to strong brand presence, innovation, and extensive distribution networks. Leading companies such as Nike, Adidas, Under Armour, and Puma leverage advanced fabric technologies, sustainable materials, and athlete endorsements to maintain a competitive edge. The market is characterized by rapid technological advancements, including moisture-wicking fabrics, temperature regulation, and muscle compression benefits, catering to both professional athletes and fitness enthusiasts. The growing consumer preference for performance-enhancing and eco-friendly sportswear has intensified competition, pushing brands to invest in research and development. Additionally, the rise of e-commerce and direct-to-consumer (DTC) channels has enabled both established and emerging players to expand their market reach. While innovation and brand loyalty drive growth, challenges such as high production costs and counterfeit products necessitate continuous product differentiation and strategic marketing efforts.
Shape Your Report to Specific Countries or Regions & Enjoy 30% Off!
The research report offers an in-depth analysis based on Product Type,End-User,Distribution Channeland Geography. It details leading market players, providing an overview of their business, product offerings, investments, revenue streams, and key applications. Additionally, the report includes insights into the competitive environment, SWOT analysis, current market trends, as well as the primary drivers and constraints. Furthermore, it discusses various factors that have driven market expansion in recent years. The report also explores market dynamics, regulatory scenarios, and technological advancements that are shaping the industry. It assesses the impact of external factors and global economic changes on market growth. Lastly, it provides strategic recommendations for new entrants and established companies to navigate the complexities of the market.
Future Outlook
The Global Compression Sportswear Market is expected to experience steady growth driven by increasing health consciousness and sports participation.
Advancements in smart textiles and fabric technologies will enhance product functionality and consumer appeal.
The rising trend of sustainable and eco-friendly materials will shape future product innovations and brand strategies.
Growing demand for personalized and custom-fit compression wear will boost digital customization and direct-to-consumer sales.
E-commerce and online retail channels will continue to expand, offering greater accessibility and competitive pricing.
Leading brands will focus on athlete endorsements, sponsorships, and influencer marketing to strengthen market presence.
Asia-Pacific is expected to witness the fastest growth due to urbanization, rising disposable income, and increasing fitness trends.
Medical-grade compression wear will gain traction for recovery, injury prevention, and therapeutic applications.
The market will see increased competition from emerging brands offering cost-effective alternatives.
Companies will prioritize product differentiation and technological innovation to maintain a competitive edge in the industry.
CHAPTER NO. 1 : INTRODUCTION 26
1.1.1. Report Description 26 Purpose of the Report 26 USP & Key Offerings 26
1.1.2. Key Benefits for Stakeholders 26
1.1.3. Target Audience 27
1.1.4. Report Scope 27
1.1.5. Regional Scope 28 CHAPTER NO. 2 : EXECUTIVE SUMMARY 29
2.1. Compression Sportswear Market Snapshot 29
2.1.1. Global Compression Sportswear Market, 2018 – 2032 (USD Million) 30 CHAPTER NO. 3 : GEOPOLITICAL CRISIS IMPACT ANALYSIS 31
3.1. Russia-Ukraine and Israel-Palestine War Impacts 31 CHAPTER NO. 4 : COMPRESSION SPORTSWEAR MARKET – INDUSTRY ANALYSIS 32
4.1. Introduction 32
4.2. Market Drivers 33
4.2.1. Increasing Cases of Sports Injuries due to Hectic International Sports Schedule 33
4.2.2. Continuous Development of Innovative Fabric Technologies 34
4.3. Market Restraints 35
4.3.1. Lower Product Awareness & Availability of Counterfeit Products 35
4.4. Market Opportunities 36
4.4.1. Market Opportunity Analysis 36
4.5. Porter’s Five Forces Analysis 37 CHAPTER NO. 5 : ANALYSIS COMPETITIVE LANDSCAPE 38
5.1. Company Market Share Analysis – 2023 38
5.1.1. Global Compression Sportswear Market: Company Market Share, by Volume, 2023 38
5.1.2. Global Compression Sportswear Market: Company Market Share, by Revenue, 2023 39
5.1.3. Global Compression Sportswear Market: Top 6 Company Market Share, by Revenue, 2023 39
5.1.4. Global Compression Sportswear Market: Top 3 Company Market Share, by Revenue, 2023 40
5.2. Global Compression Sportswear Market Company Revenue Market Share, 2023 41
5.3. Company Assessment Metrics, 2023 42
5.3.1. Stars 42
5.3.2. Emerging Leaders 42
5.3.3. Pervasive Players 42
5.3.4. Participants 42
5.4. Start-ups /SMEs Assessment Metrics, 2023 42
5.4.1. Progressive Companies 42
5.4.2. Responsive Companies 42
5.4.3. Dynamic Companies 42
5.4.4. Starting Blocks 42
5.5. Strategic Developments 43
5.5.1. Acquisitions & Mergers 43 New Product Launch 43 Regional Expansion 43
5.6. Key Players Product Matrix 44 CHAPTER NO. 6 : PESTEL & ADJACENT MARKET ANALYSIS 45
6.1. PESTEL 45
6.1.1. Political Factors 45
6.1.2. Economic Factors 45
6.1.3. Social Factors 45
6.1.4. Technological Factors 45
6.1.5. Environmental Factors 45
6.1.6. Legal Factors 45
6.2. Adjacent Market Analysis 45 CHAPTER NO. 7 : COMPRESSION SPORTSWEAR MARKET – BY PRODUCT TYPE SEGMENT ANALYSIS 46
7.1. Compression Sportswear Market Overview, by Product Type Segment 46
7.1.1. Compression Sportswear Market Revenue Share, By Product Type, 2023 & 2032 47
7.1.2. Compression Sportswear Market Attractiveness Analysis, By Product Type 48
7.1.3. Incremental Revenue Growth Opportunity, by Product Type, 2024 – 2032 48
7.1.4. Compression Sportswear Market Revenue, By Product Type, 2018, 2023, 2027 & 2032 49
7.2. Shirts 50
7.2.1. Global Shirts Compression Sportswear Market Revenue, By Region, 2018 – 2023 (USD Million) 51
7.2.2. Global Shirts Compression Sportswear Market Revenue, By Region, 2024 – 2032 (USD Million) 51
7.3. Shorts 52
7.3.1. Global Shorts Compression Sportswear Market Revenue, By Region, 2018 – 2023 (USD Million) 53
7.3.2. Global Shorts Compression Sportswear Market Revenue, By Region, 2024 – 2032 (USD Million) 53
7.4. Tights/Leggings 54
7.4.1. Global Tights/Leggings Compression Sportswear Market Revenue, By Region, 2018 – 2023 (USD Million) 55
7.4.2. Global Tights/Leggings Compression Sportswear Market Revenue, By Region, 2024 – 2032 (USD Million) 55
7.5. Innerwear 56
7.5.1. Global Innerwear Compression Sportswear Market Revenue, By Region, 2018 – 2023 (USD Million) 57
7.5.2. Global Innerwear Compression Sportswear Market Revenue, By Region, 2024 – 2032 (USD Million) 57
7.6. Others 58
7.6.1. Global Others Compression Sportswear Market Revenue, By Region, 2018 – 2023 (USD Million) 59
7.6.2. Global Others Compression Sportswear Market Revenue, By Region, 2024 – 2032 (USD Million) 59 CHAPTER NO. 8 : COMPRESSION SPORTSWEAR MARKET – BY END-USER SEGMENT ANALYSIS 60
8.1. Compression Sportswear Market Overview, by End-user Segment 60
8.1.1. Compression Sportswear Market Revenue Share, By End-user, 2023 & 2032 61
8.1.2. Compression Sportswear Market Attractiveness Analysis, By End-user 62
8.1.3. Incremental Revenue Growth Opportunity, by End-user, 2024 – 2032 62
8.1.4. Compression Sportswear Market Revenue, By End-user, 2018, 2023, 2027 & 2032 63
8.2. Men 64
8.2.1. Global Men Compression Sportswear Market Revenue, By Region, 2018 – 2023 (USD Million) 65
8.2.2. Global Men Compression Sportswear Market Revenue, By Region, 2024 – 2032 (USD Million) 65
8.3. Women 66
8.3.1. Global Women Compression Sportswear Market Revenue, By Region, 2018 – 2023 (USD Million) 67
8.3.2. Global Women Compression Sportswear Market Revenue, By Region, 2024 – 2032 (USD Million) 67
8.4. Children 68
8.4.1. Global Children Compression Sportswear Market Revenue, By Region, 2018 – 2023 (USD Million) 69
8.4.2. Global Children Compression Sportswear Market Revenue, By Region, 2024 – 2032 (USD Million) 69 CHAPTER NO. 9 : COMPRESSION SPORTSWEAR MARKET – BY DISTRIBUTION CHANNEL SEGMENT ANALYSIS 70
9.1. Compression Sportswear Market Overview, by Distribution Channel Segment 70
9.1.1. Compression Sportswear Market Revenue Share, By Distribution Channel, 2023 & 2032 71
9.1.2. Compression Sportswear Market Attractiveness Analysis, By Distribution Channel 72
9.1.3. Incremental Revenue Growth Opportunity, by Distribution Channel, 2024 – 2032 72
9.1.4. Compression Sportswear Market Revenue, By Distribution Channel, 2018, 2023, 2027 & 2032 73
9.2. Hypermarket/Supermarket 74
9.2.1. Global Hypermarket/Supermarket Compression Sportswear Market Revenue, By Region, 2018 – 2023 (USD Million) 75
9.2.2. Global Hypermarket/Supermarket Compression Sportswear Market Revenue, By Region, 2024 – 2032 (USD Million) 75
9.3. Specialty Stores 76
9.3.1. Global Specialty Stores Compression Sportswear Market Revenue, By Region, 2018 – 2023 (USD Million) 77
9.3.2. Global Specialty Stores Compression Sportswear Market Revenue, By Region, 2024 – 2032 (USD Million) 77
9.4. Multi-Brand Stores 78
9.4.1. Global Multi-Brand Stores Compression Sportswear Market Revenue, By Region, 2018 – 2023 (USD Million) 79
9.4.2. Global Multi-Brand Stores Compression Sportswear Market Revenue, By Region, 2024 – 2032 (USD Million) 79
9.5. Online 80
9.5.1. Global Online Compression Sportswear Market Revenue, By Region, 2018 – 2023 (USD Million) 81
9.5.2. Global Online Compression Sportswear Market Revenue, By Region, 2024 – 2032 (USD Million) 81
9.6. Others 82
9.6.1. Global Others Compression Sportswear Market Revenue, By Region, 2018 – 2023 (USD Million) 83
9.6.2. Global Others Compression Sportswear Market Revenue, By Region, 2024 – 2032 (USD Million) 83 CHAPTER NO. 10 : COMPRESSION SPORTSWEAR MARKET – REGIONAL ANALYSIS 84
10.1. Compression Sportswear Market Overview, by Regional Segments 84
10.2. Region 85
10.2.1. Global Compression Sportswear Market Revenue Share, By Region, 2023 & 2032 85
10.2.2. Compression Sportswear Market Attractiveness Analysis, By Region 86
10.2.3. Incremental Revenue Growth Opportunity, by Region, 2024 – 2032 86
10.2.4. Compression Sportswear Market Revenue, By Region, 2018, 2023, 2027 & 2032 87
10.2.5. Global Compression Sportswear Market Revenue, By Region, 2018 – 2023 (USD Million) 88
10.2.6. Global Compression Sportswear Market Revenue, By Region, 2024 – 2032 (USD Million) 88
10.3. Product Type 89
10.3.1. Global Compression Sportswear Market Revenue, By Product Type, 2018 – 2023 (USD Million) 89
10.3.2. Global Compression Sportswear Market Revenue, By Product Type, 2024 – 2032 (USD Million) 89
10.4. End-user 90
10.4.1. Global Compression Sportswear Market Revenue, By End-user, 2018 – 2023 (USD Million) 90
10.4.2. Global Compression Sportswear Market Revenue, By End-user, 2024 – 2032 (USD Million) 90
10.5. Distribution Channel 91
10.5.1. Global Compression Sportswear Market Revenue, By Distribution Channel, 2018 – 2023 (USD Million) 91
10.5.2. Global Compression Sportswear Market Revenue, By Distribution Channel, 2024 – 2032 (USD Million) 91 CHAPTER NO. 11 : COMPRESSION SPORTSWEAR MARKET – NORTH AMERICA 92
11.1. North America 92
11.1.1. Key Highlights 92
11.1.2. North America Compression Sportswear Market Revenue, By Country, 2018 – 2023 (USD Million) 93
11.1.3. North America Compression Sportswear Market Revenue, By Product Type, 2018 – 2023 (USD Million) 94
11.1.4. North America Compression Sportswear Market Revenue, By End-user, 2018 – 2023 (USD Million) 95
11.1.5. North America Compression Sportswear Market Revenue, By Distribution Channel, 2018 – 2023 (USD Million) 96
11.2. U.S. 97
11.3. Canada 97
11.4. Mexico 97 CHAPTER NO. 12 : COMPRESSION SPORTSWEAR MARKET – EUROPE 98
12.1. Europe 98
12.1.1. Key Highlights 98
12.1.2. Europe Compression Sportswear Market Revenue, By Country, 2018 – 2023 (USD Million) 99
12.1.3. Europe Compression Sportswear Market Revenue, By Product Type, 2018 – 2023 (USD Million) 100
12.1.4. Europe Compression Sportswear Market Revenue, By End-user, 2018 – 2023 (USD Million) 101
12.1.5. Europe Compression Sportswear Market Revenue, By Distribution Channel, 2018 – 2023 (USD Million) 102
12.2. UK 103
12.3. France 103
12.4. Germany 103
12.5. Italy 103
12.6. Spain 103
12.7. Russia 103
12.8. Belgium 103
12.9. Netherland 103
12.10. Austria 103
12.11. Sweden 103
12.12. Poland 103
12.13. Denmark 103
12.14. Switzerland 103
12.15. Rest of Europe 103 CHAPTER NO. 13 : COMPRESSION SPORTSWEAR MARKET – ASIA PACIFIC 104
13.1. Asia Pacific 104
13.1.1. Key Highlights 104
13.1.2. Asia Pacific Compression Sportswear Market Revenue, By Country, 2018 – 2023 (USD Million) 105
13.1.3. Asia Pacific Compression Sportswear Market Revenue, By Product Type, 2018 – 2023 (USD Million) 106
13.1.4. Asia Pacific Compression Sportswear Market Revenue, By End-user, 2018 – 2023 (USD Million) 107
13.1.5. Asia Pacific Compression Sportswear Market Revenue, By Distribution Channel, 2018 – 2023 (USD Million) 108
13.2. China 109
13.3. Japan 109
13.4. South Korea 109
13.5. India 109
13.6. Australia 109
13.7. Thailand 109
13.8. Indonesia 109
13.9. Vietnam 109
13.10. Malaysia 109
13.11. Philippines 109
13.12. Taiwan 109
13.13. Rest of Asia Pacific 109 CHAPTER NO. 14 : COMPRESSION SPORTSWEAR MARKET – LATIN AMERICA 110
14.1. Latin America 110
14.1.1. Key Highlights 110
14.1.2. Latin America Compression Sportswear Market Revenue, By Country, 2018 – 2023 (USD Million) 111
14.1.3. Latin America Compression Sportswear Market Revenue, By Product Type, 2018 – 2023 (USD Million) 112
14.1.4. Latin America Compression Sportswear Market Revenue, By End-user, 2018 – 2023 (USD Million) 113
14.1.5. Latin America Compression Sportswear Market Revenue, By Distribution Channel, 2018 – 2023 (USD Million) 114
14.2. Brazil 115
14.3. Argentina 115
14.4. Peru 115
14.5. Chile 115
14.6. Colombia 115
14.7. Rest of Latin America 115 CHAPTER NO. 15 : COMPRESSION SPORTSWEAR MARKET – MIDDLE EAST 116
15.1. Middle East 116
15.1.1. Key Highlights 116
15.1.2. Middle East Compression Sportswear Market Revenue, By Country, 2018 – 2023 (USD Million) 117
15.1.3. Middle East Compression Sportswear Market Revenue, By Product Type, 2018 – 2023 (USD Million) 118
15.1.4. Middle East Compression Sportswear Market Revenue, By End-user, 2018 – 2023 (USD Million) 119
15.1.5. Middle East Compression Sportswear Market Revenue, By Distribution Channel, 2018 – 2023 (USD Million) 120
15.2. UAE 121
15.3. KSA 121
15.4. Israel 121
15.5. Turkey 121
15.6. Iran 121
15.7. Rest of Middle East 121 CHAPTER NO. 16 : COMPRESSION SPORTSWEAR MARKET – AFRICA 122
16.1. Africa 122
16.1.1. Key Highlights 122
16.1.2. Africa Compression Sportswear Market Revenue, By Country, 2018 – 2023 (USD Million) 123
16.1.3. Africa Compression Sportswear Market Revenue, By Product Type, 2018 – 2023 (USD Million) 124
16.1.4. Africa Compression Sportswear Market Revenue, By End-user, 2018 – 2023 (USD Million) 125
16.1.5. Africa Compression Sportswear Market Revenue, By Distribution Channel, 2018 – 2023 (USD Million) 126
16.2. Egypt 127
16.3. Nigeria 127
16.4. Algeria 127
16.5. Morocco 127
16.6. Rest of Africa 127 CHAPTER NO. 17 : COMPANY PROFILES 128
17.1. Under Armour, Inc. 128
17.1.1. Company Overview 128
17.1.2. Product Portfolio 128
17.1.3. Swot Analysis 128
17.1.4. Business Strategy 129
17.1.5. Financial Overview 129
17.2. Nike, Inc. 130
17.3. Adidas AG 130
17.4. Puma SE 130
17.5. Skins International Trading AG 130
17.6. 2XU Pty Ltd. 130
17.7. CW-X 130
17.8. Reebok International Ltd. 130
17.9. Bauerfeind AG 130
17.10. Asics Corporation 130
17.11. Zensah 130
17.12. Fuaark 130
List of Figures
FIG NO. 1. Global Compression Sportswear Market Revenue, 2018 – 2032 (USD Million) 34
FIG NO. 2. Porter’s Five Forces Analysis for Global Compression Sportswear Market 41
FIG NO. 3. Company Share Analysis, 2023 42
FIG NO. 4. Company Share Analysis, 2023 43
FIG NO. 5. Company Share Analysis, 2023 43
FIG NO. 6. Company Share Analysis, 2023 44
FIG NO. 7. Compression Sportswear Market – Company Revenue Market Share, 2023 45
FIG NO. 8. Compression Sportswear Market Revenue Share, By Product Type, 2023 & 2032 51
FIG NO. 9. Market Attractiveness Analysis, By Product Type 52
FIG NO. 10. Incremental Revenue Growth Opportunity by Product Type, 2024 – 2032 52
FIG NO. 11. Compression Sportswear Market Revenue, By Product Type, 2018, 2023, 2027 & 2032 53
FIG NO. 12. Global Compression Sportswear Market for Shirts, Revenue (USD Million) 2018 – 2032 54
FIG NO. 13. Global Compression Sportswear Market for Shorts, Revenue (USD Million) 2018 – 2032 56
FIG NO. 14. Global Compression Sportswear Market for Tights/Leggings, Revenue (USD Million) 2018 – 2032 58
FIG NO. 15. Global Compression Sportswear Market for Innerwear, Revenue (USD Million) 2018 – 2032 60
FIG NO. 16. Global Compression Sportswear Market for Others, Revenue (USD Million) 2018 – 2032 62
FIG NO. 17. Compression Sportswear Market Revenue Share, By End-user, 2023 & 2032 65
FIG NO. 18. Market Attractiveness Analysis, By End-user 66
FIG NO. 19. Incremental Revenue Growth Opportunity by End-user, 2024 – 2032 66
FIG NO. 20. Compression Sportswear Market Revenue, By End-user, 2018, 2023, 2027 & 2032 67
FIG NO. 21. Global Compression Sportswear Market for Men, Revenue (USD Million) 2018 – 2032 68
FIG NO. 22. Global Compression Sportswear Market for Women, Revenue (USD Million) 2018 – 2032 70
FIG NO. 23. Global Compression Sportswear Market for Children, Revenue (USD Million) 2018 – 2032 72
FIG NO. 24. Compression Sportswear Market Revenue Share, By Distribution Channel, 2023 & 2032 75
FIG NO. 25. Market Attractiveness Analysis, By Distribution Channel 76
FIG NO. 26. Incremental Revenue Growth Opportunity by Distribution Channel, 2024 – 2032 76
FIG NO. 27. Compression Sportswear Market Revenue, By Distribution Channel, 2018, 2023, 2027 & 2032 77
FIG NO. 28. Global Compression Sportswear Market for Hypermarket/Supermarket, Revenue (USD Million) 2018 – 2032 78
FIG NO. 29. Global Compression Sportswear Market for Specialty Stores, Revenue (USD Million) 2018 – 2032 80
FIG NO. 30. Global Compression Sportswear Market for Multi-Brand Stores, Revenue (USD Million) 2018 – 2032 82
FIG NO. 31. Global Compression Sportswear Market for Online, Revenue (USD Million) 2018 – 2032 84
FIG NO. 32. Global Compression Sportswear Market for Others, Revenue (USD Million) 2018 – 2032 86
FIG NO. 33. Global Compression Sportswear Market Revenue Share, By Region, 2023 & 2032 89
FIG NO. 34. Market Attractiveness Analysis, By Region 90
FIG NO. 35. Incremental Revenue Growth Opportunity by Region, 2024 – 2032 90
FIG NO. 36. Compression Sportswear Market Revenue, By Region, 2018, 2023, 2027 & 2032 91
FIG NO. 37. North America Compression Sportswear Market Revenue, 2018 – 2032 (USD Million) 96
FIG NO. 38. Europe Compression Sportswear Market Revenue, 2018 – 2032 (USD Million) 102
FIG NO. 39. Asia Pacific Compression Sportswear Market Revenue, 2018 – 2032 (USD Million) 108
FIG NO. 40. Latin America Compression Sportswear Market Revenue, 2018 – 2032 (USD Million) 114
FIG NO. 41. Middle East Compression Sportswear Market Revenue, 2018 – 2032 (USD Million) 120
FIG NO. 42. Africa Compression Sportswear Market Revenue, 2018 – 2032 (USD Million) 126
List of Tables
TABLE NO. 1. : Global Compression Sportswear Market: Snapshot 34
TABLE NO. 2. : Drivers for the Compression Sportswear Market: Impact Analysis 38
TABLE NO. 3. : Restraints for the Compression Sportswear Market: Impact Analysis 40
TABLE NO. 4. : Global Shirts Compression Sportswear Market Revenue, By Region, 2018 – 2023 (USD Million) 56
TABLE NO. 5. : Global Shirts Compression Sportswear Market Revenue, By Region, 2024 – 2032 (USD Million) 56
TABLE NO. 6. : Global Shorts Compression Sportswear Market Revenue, By Region, 2018 – 2023 (USD Million) 58
TABLE NO. 7. : Global Shorts Compression Sportswear Market Revenue, By Region, 2024 – 2032 (USD Million) 58
TABLE NO. 8. : Global Tights/Leggings Compression Sportswear Market Revenue, By Region, 2018 – 2023 (USD Million) 60
TABLE NO. 9. : Global Tights/Leggings Compression Sportswear Market Revenue, By Region, 2024 – 2032 (USD Million) 60
TABLE NO. 10. : Global Innerwear Compression Sportswear Market Revenue, By Region, 2018 – 2023 (USD Million) 62
TABLE NO. 11. : Global Innerwear Compression Sportswear Market Revenue, By Region, 2024 – 2032 (USD Million) 62
TABLE NO. 12. : Global Others Compression Sportswear Market Revenue, By Region, 2018 – 2023 (USD Million) 64
TABLE NO. 13. : Global Others Compression Sportswear Market Revenue, By Region, 2024 – 2032 (USD Million) 64
TABLE NO. 14. : Global Men Compression Sportswear Market Revenue, By Region, 2018 – 2023 (USD Million) 70
TABLE NO. 15. : Global Men Compression Sportswear Market Revenue, By Region, 2024 – 2032 (USD Million) 70
TABLE NO. 16. : Global Women Compression Sportswear Market Revenue, By Region, 2018 – 2023 (USD Million) 72
TABLE NO. 17. : Global Women Compression Sportswear Market Revenue, By Region, 2024 – 2032 (USD Million) 72
TABLE NO. 18. : Global Children Compression Sportswear Market Revenue, By Region, 2018 – 2023 (USD Million) 74
TABLE NO. 19. : Global Children Compression Sportswear Market Revenue, By Region, 2024 – 2032 (USD Million) 74
TABLE NO. 20. : Global Hypermarket/Supermarket Compression Sportswear Market Revenue, By Region, 2018 – 2023 (USD Million) 80
TABLE NO. 21. : Global Hypermarket/Supermarket Compression Sportswear Market Revenue, By Region, 2024 – 2032 (USD Million) 80
TABLE NO. 22. : Global Specialty Stores Compression Sportswear Market Revenue, By Region, 2018 – 2023 (USD Million) 82
TABLE NO. 23. : Global Specialty Stores Compression Sportswear Market Revenue, By Region, 2024 – 2032 (USD Million) 82
TABLE NO. 24. : Global Multi-Brand Stores Compression Sportswear Market Revenue, By Region, 2018 – 2023 (USD Million) 84
TABLE NO. 25. : Global Multi-Brand Stores Compression Sportswear Market Revenue, By Region, 2024 – 2032 (USD Million) 84
TABLE NO. 26. : Global Online Compression Sportswear Market Revenue, By Region, 2018 – 2023 (USD Million) 86
TABLE NO. 27. : Global Online Compression Sportswear Market Revenue, By Region, 2024 – 2032 (USD Million) 86
TABLE NO. 28. : Global Others Compression Sportswear Market Revenue, By Region, 2018 – 2023 (USD Million) 88
TABLE NO. 29. : Global Others Compression Sportswear Market Revenue, By Region, 2024 – 2032 (USD Million) 88
TABLE NO. 30. : Global Compression Sportswear Market Revenue, By Region, 2018 – 2023 (USD Million) 93
TABLE NO. 31. : Global Compression Sportswear Market Revenue, By Region, 2024 – 2032 (USD Million) 93
TABLE NO. 32. : Global Compression Sportswear Market Revenue, By Product Type, 2018 – 2023 (USD Million) 94
TABLE NO. 33. : Global Compression Sportswear Market Revenue, By Product Type, 2024 – 2032 (USD Million) 94
TABLE NO. 34. : Global Compression Sportswear Market Revenue, By End-user, 2018 – 2023 (USD Million) 95
TABLE NO. 35. : Global Compression Sportswear Market Revenue, By End-user, 2024 – 2032 (USD Million) 95
TABLE NO. 36. : Global Compression Sportswear Market Revenue, By Distribution Channel, 2018 – 2023 (USD Million) 96
TABLE NO. 37. : Global Compression Sportswear Market Revenue, By Distribution Channel, 2024 – 2032 (USD Million) 96
TABLE NO. 38. : North America Compression Sportswear Market Revenue, By Country, 2018 – 2023 (USD Million) 98
TABLE NO. 39. : North America Compression Sportswear Market Revenue, By Country, 2024 – 2032 (USD Million) 98
TABLE NO. 40. : North America Compression Sportswear Market Revenue, By Product Type, 2018 – 2023 (USD Million) 99
TABLE NO. 41. : North America Compression Sportswear Market Revenue, By Product Type, 2024 – 2032 (USD Million) 99
TABLE NO. 42. : North America Compression Sportswear Market Revenue, By End-user, 2018 – 2023 (USD Million) 100
TABLE NO. 43. : North America Compression Sportswear Market Revenue, By End-user, 2024 – 2032 (USD Million) 100
TABLE NO. 44. : North America Compression Sportswear Market Revenue, By Distribution Channel, 2018 – 2023 (USD Million) 101
TABLE NO. 45. : North America Compression Sportswear Market Revenue, By Distribution Channel, 2024 – 2032 (USD Million) 101
TABLE NO. 46. : Europe Compression Sportswear Market Revenue, By Country, 2018 – 2023 (USD Million) 104
TABLE NO. 47. : Europe Compression Sportswear Market Revenue, By Country, 2024 – 2032 (USD Million) 104
TABLE NO. 48. : Europe Compression Sportswear Market Revenue, By Product Type, 2018 – 2023 (USD Million) 105
TABLE NO. 49. : Europe Compression Sportswear Market Revenue, By Product Type, 2024 – 2032 (USD Million) 105
TABLE NO. 50. : Europe Compression Sportswear Market Revenue, By End-user, 2018 – 2023 (USD Million) 106
TABLE NO. 51. : Europe Compression Sportswear Market Revenue, By End-user, 2024 – 2032 (USD Million) 106
TABLE NO. 52. : Europe Compression Sportswear Market Revenue, By Distribution Channel, 2018 – 2023 (USD Million) 107
TABLE NO. 53. : Europe Compression Sportswear Market Revenue, By Distribution Channel, 2024 – 2032 (USD Million) 107
TABLE NO. 54. : Asia Pacific Compression Sportswear Market Revenue, By Country, 2018 – 2023 (USD Million) 110
TABLE NO. 55. : Asia Pacific Compression Sportswear Market Revenue, By Country, 2024 – 2032 (USD Million) 110
TABLE NO. 56. : Asia Pacific Compression Sportswear Market Revenue, By Product Type, 2018 – 2023 (USD Million) 111
TABLE NO. 57. : Asia Pacific Compression Sportswear Market Revenue, By Product Type, 2024 – 2032 (USD Million) 111
TABLE NO. 58. : Asia Pacific Compression Sportswear Market Revenue, By End-user, 2018 – 2023 (USD Million) 112
TABLE NO. 59. : Asia Pacific Compression Sportswear Market Revenue, By End-user, 2024 – 2032 (USD Million) 112
TABLE NO. 60. : Asia Pacific Compression Sportswear Market Revenue, By Distribution Channel, 2018 – 2023 (USD Million) 113
TABLE NO. 61. : Asia Pacific Compression Sportswear Market Revenue, By Distribution Channel, 2024 – 2032 (USD Million) 113
TABLE NO. 62. : Latin America Compression Sportswear Market Revenue, By Country, 2018 – 2023 (USD Million) 116
TABLE NO. 63. : Latin America Compression Sportswear Market Revenue, By Country, 2024 – 2032 (USD Million) 116
TABLE NO. 64. : Latin America Compression Sportswear Market Revenue, By Product Type, 2018 – 2023 (USD Million) 117
TABLE NO. 65. : Latin America Compression Sportswear Market Revenue, By Product Type, 2024 – 2032 (USD Million) 117
TABLE NO. 66. : Latin America Compression Sportswear Market Revenue, By End-user, 2018 – 2023 (USD Million) 118
TABLE NO. 67. : Latin America Compression Sportswear Market Revenue, By End-user, 2024 – 2032 (USD Million) 118
TABLE NO. 68. : Latin America Compression Sportswear Market Revenue, By Distribution Channel, 2018 – 2023 (USD Million) 119
TABLE NO. 69. : Latin America Compression Sportswear Market Revenue, By Distribution Channel, 2024 – 2032 (USD Million) 119
TABLE NO. 70. : Middle East Compression Sportswear Market Revenue, By Country, 2018 – 2023 (USD Million) 122
TABLE NO. 71. : Middle East Compression Sportswear Market Revenue, By Country, 2024 – 2032 (USD Million) 122
TABLE NO. 72. : Middle East Compression Sportswear Market Revenue, By Product Type, 2018 – 2023 (USD Million) 123
TABLE NO. 73. : Middle East Compression Sportswear Market Revenue, By Product Type, 2024 – 2032 (USD Million) 123
TABLE NO. 74. : Middle East Compression Sportswear Market Revenue, By End-user, 2018 – 2023 (USD Million) 124
TABLE NO. 75. : Middle East Compression Sportswear Market Revenue, By End-user, 2024 – 2032 (USD Million) 124
TABLE NO. 76. : Middle East Compression Sportswear Market Revenue, By Distribution Channel, 2018 – 2023 (USD Million) 125
TABLE NO. 77. : Middle East Compression Sportswear Market Revenue, By Distribution Channel, 2024 – 2032 (USD Million) 125
TABLE NO. 78. : Africa Compression Sportswear Market Revenue, By Country, 2018 – 2023 (USD Million) 128
TABLE NO. 79. : Africa Compression Sportswear Market Revenue, By Country, 2024 – 2032 (USD Million) 128
TABLE NO. 80. : Africa Compression Sportswear Market Revenue, By Product Type, 2018 – 2023 (USD Million) 129
TABLE NO. 81. : Africa Compression Sportswear Market Revenue, By Product Type, 2024 – 2032 (USD Million) 129
TABLE NO. 82. : Africa Compression Sportswear Market Revenue, By End-user, 2018 – 2023 (USD Million) 130
TABLE NO. 83. : Africa Compression Sportswear Market Revenue, By End-user, 2024 – 2032 (USD Million) 130
TABLE NO. 84. : Africa Compression Sportswear Market Revenue, By Distribution Channel, 2018 – 2023 (USD Million) 131
TABLE NO. 85. : Africa Compression Sportswear Market Revenue, By Distribution Channel, 2024 – 2032 (USD Million) 131
Request Sample
We prioritize the confidentiality and security of your data. Our promise: your information remains private.
Ready to Transform Data into Decisions?
Request Your Sample Report and Start Your Journey of Informed Choices
Providing the strategic compass for industry titans.
Frequently Asked Questions:
What is the current size of the Global Compression Sportswear market?
The Global Compression Sportswear market was valued at USD 4,240.00 million in 2023 and is projected to reach USD 10,671.46 million by 2032, growing at a CAGR of 10.80% during the forecast period (2023-2032).
What factors are driving the growth of the Global Compression Sportswear market?
The market is driven by rising fitness awareness, increasing sports participation, and the benefits of compression wear in enhancing muscle recovery and performance. Technological advancements, such as moisture-wicking fabrics, seamless designs, and smart textiles, are further fueling demand.
What are the key segments within the Global Compression Sportswear market?
The market is segmented by: • Product Type: Shirts, Shorts, Tights/Leggings, Innerwear, Others • End-User: Men, Women, Children • Distribution Channel: Hypermarket/Supermarket, Specialty Stores, Multi-Brand Stores, Online, Others • Geography: North America, Europe, Asia-Pacific, Latin America, Middle East, and Africa
What are some challenges faced by the Global Compression Sportswear market?
The market faces challenges such as high production costs, supply chain constraints, and pricing pressures. Intense competition from counterfeit and low-cost manufacturers affects brand reputation and profitability.
Who are the major players in the Global Compression Sportswear market?
Key players include Under Armour, Nike, Adidas, Puma, Skins International Trading AG, 2XU Pty Ltd., CW-X, Reebok International Ltd., Bauerfeind AG, Asics Corporation, Zensah, and Fuaark. These companies focus on product innovation, sustainable materials, and digital expansion strategies to strengthen their market position.
About Author
Rajdeep Kumar Deb
Lead Analyst – Consumer & Finance
Rajdeep brings a decade of consumer goods and financial services insight to strategic market analysis.
The Compression Product Market is projected to grow from USD 4,350 million in 2024 to USD 6,575.3 million by 2032, at a CAGR of 5.3% during the forecast period.
The Compression Garments Market size was valued at USD 1,400.00 million in 2018 to USD 1,601.96 million in 2024 and is anticipated to reach USD 2,396.12 million by 2032, at a CAGR of 5.21% during the forecast period.
The Cold Compression Devices market size was valued at USD 980.00 million in 2018, increased to USD 1,200.35 million in 2024, and is anticipated to reach USD 2,061.30 million by 2032, at a CAGR of 7.01% during the forecast period.
The Global Decompression Toys Market is projected to grow from USD 2,253.96 million in 2024 to an estimated USD 3,687.08 million by 2032, with a compound annual growth rate (CAGR) of 6.34% from 2025 to 2032.
The Static Compression Therapy Market is projected to grow from USD 162 million in 2024 to an estimated USD 278.34 million by 2032, with a compound annual growth rate (CAGR) of 7% from 2024 to 2032.
The Radial Compression Device Market is projected to grow from USD 305.5 million in 2024 to USD 617.72 million by 2032, at a compound annual growth rate (CAGR) of 9.2%.
U.S. Compression Sportswear Market size was valued at USD 1,322.62 million in 2024 and is anticipated to reach USD 2,254.82 million by 2032, at a CAGR of 6.90% during the forecast period (2024-2032).
Europe Compression Sportswear Market size was valued at USD 1,193.67 million in 2024 and is anticipated to reach USD 1,910.10 million by 2032, at a CAGR of 6.05% during the forecast period (2024-2032).
UK Compression Sportswear Market size was valued at USD 198.15 million in 2024 and is anticipated to reach USD 332.36 million by 2032, at a CAGR of 6.68% during the forecast period (2024-2032).
Purchase Options
The report comes as a view-only PDF document, optimized for individual clients. This version is recommended for personal digital use and does not allow printing. Use restricted to one purchaser only.
$4999
To meet the needs of modern corporate teams, our report comes in two formats: a printable PDF and a data-rich Excel sheet. This package is optimized for internal analysis. Unlimited users allowed within one corporate location (e.g., regional office).
$6999
The report will be delivered in printable PDF format along with the report’s data Excel sheet. This license offers 100 Free Analyst hours where the client can utilize Credence Research Inc. research team. Permitted for unlimited global use by all users within the purchasing corporation, such as all employees of a single company.
Thank you for the data! The numbers are exactly what we asked for and what we need to build our business case.
Materials Scientist (privacy requested)
The report was an excellent overview of the Industrial Burners market. This report does a great job of breaking everything down into manageable chunks.