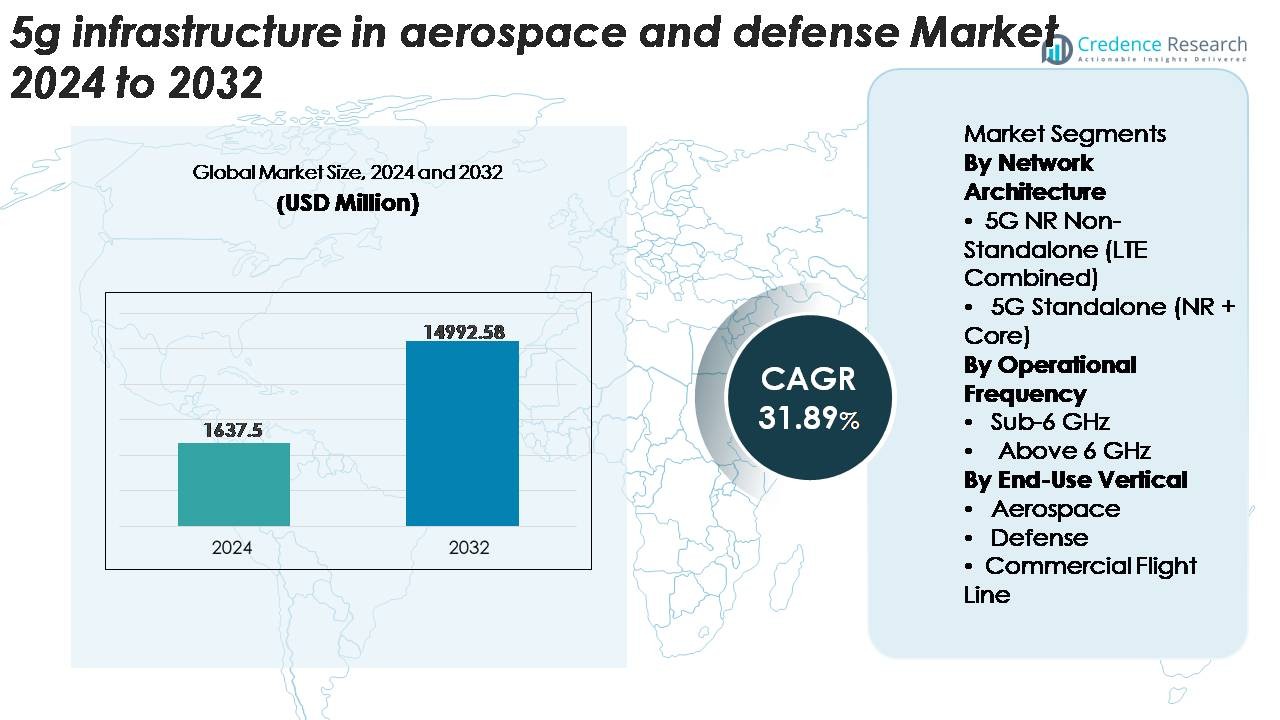
Home » Aerospace & defense » 5G Infrastructure in Aerospace and Defense Market

Global 5G Infrastructure in Aerospace and Defense Market By Communication Infrastructure (Small Cell, Macro Cell, and Radio Access Network (RAN)), By Core Network Technology (Software-Defined Networking (SDN), Fog Computing (FC), Mobile Edge Computing (MEC), and Network Functions Virtualization (NFV))

Price: $4999

Published: | Report ID: 16450 | Report Format : PDF

Key Highlights of the report

How are the major segments performing in the 5G Infrastructure in Aerospace and Defense market?

  • In 2022, the Small Cell segment accounted for the largest share of the market as it can facilitate 5G deployment.
  • In 2022, Software-Defined Networking (SDN) segment accounted for the largest share of the market owing to agility, the capacity to design and implement policy-driven network supervision, and network automation.
  • In 2022, the Ultra-reliable Low-latency Communications (URLLC) segment was anticipated to hold a prominent share in the global 5G Infrastructure in Aerospace and Defense market as it is 100 times faster than the 4G network.
  • In 2022, Radio Frequency Integrated Circuit (RFIC) Chipset segment accounted for the largest share owing to Low power consumption, high reliability, and lower cost.
  • In 2022, the airborne segment was anticipated to hold a prominent share of the global 5G Infrastructure in Aerospace and Defense market. Mission-critical communications and airborne applications (like drones) will be able to operate more effectively thanks to developments in 5G technology.

Which region dominated the 5G Infrastructure in Aerospace and Defense market?

In 2022, The market in North America is anticipated to experience the fastest growth in the 5G in defense market throughout the projection period due to the US Department of Defense’s increased investment in the technology. Additionally, the growing demand for low-latency communication technology, the expansion of IoT’s use of connected systems, and the allocation of a large frequency band to the military have created new opportunities for developers to produce 5G components and raise the effectiveness of the system.

Design Element 2

Access crucial information at unmatched prices!

Request your free sample report today & start making informed decisions powered by Credence Research!

Download Free Sample
CTA Design Element 3

How is US Market Performing in the 5G Infrastructure in Aerospace and Defense market?

In 2022, the US will lead the world in 5G Infrastructure in Aerospace and Defense, dominating the global market for the region of North America. In defense, 5G technology enhances the processing and operation of ISR (intelligence, surveillance, and reconnaissance) systems, makes new command and control systems possible, improves augmented and virtual reality applications, updates maintenance procedures, and boosts logistics supply efficiency using blockchain technology. IoT-connected systems are being used more frequently, which has increased the demand for low-latency communication technology. The US military’s receipt of a large frequency band has given system designers new chances to create 5G-enabled components and improve the operational effectiveness of all associated systems.

How is the economy impacting the global 5G Infrastructure in Aerospace and Defense growth?

The COVID-19 pandemic greatly increased reliance on technology, making it imperative that we deploy cutting-edge 5G infrastructure. Investments in reliable connectivity platforms have been prompted by an increase in the frequency of business operations moving to the cloud and other virtual spaces. This trend is expected to continue after the pandemic crisis because businesses and enterprises are unlikely to switch back to the traditional mode of operation. Additionally, businesses attempt to synchronize their increasingly different business requirements, driving demand for 5G infrastructure. In contrast to many other sectors, 5G infrastructure vendors may experience little impact from the upcoming recession.

What is the competitive environment of the 5G Infrastructure in Aerospace and Defense market?

The major market participants use a variety of tactics to broaden their market penetration and take the lead in the industry. Partnerships, acquisitions, and collaboration strengthen their position in the international market. For instance, in June 2022, Raytheon Technologies Co. and Northrop Grumman Corp. announced that the United States had awarded them contracts to create missiles that counter hypersonic weapons. The verification was completed in January 2022 at the KT Research and Development Center in South Korea by KT, a Korean carrier, and Fujitsu, a Japanese technology company. To test call connections for open fronthaul, the two businesses used Fujitsu’s Open RAN-based 5G base station technology. The Japanese competitor NTT Docomo will support Fujitsu technically throughout the project. With the opening of this new facility, KT hopes to hasten O-RAN technology’s integration into Korea’s 5G network.

Executive Summary

What are the key trends in the 5G Infrastructure in Aerospace and Defense market?

  • The proliferation of small 5G network segments is primarily caused by the widespread small cell deployment by 5G network operators. As 5G network operators continue to use more small cells, the rate at which data is transferred should increase.
  • Almost everyone and everything can be connected to the 5G mobile network, including things, technology, and machines. If 5G networks are used for defense and security purposes, they could, among other things, improve logistics operations for greater efficiency, expand ISR systems and processing, and create new command and control techniques.

How are Government Initiatives fuelling 5G Infrastructure in Aerospace and Defense Market?

Governments can provide secure, dependable, and flexible safety for their citizens and assets thanks to 5G. These traits encourage governments to increase their funding for developing 5G technology. For instance, Taiwan’s National Communications Commission (NCC) provided five telecom operators with a subsidy totaling USD 948.5 Mn for deploying a 5G network from 2021 to 2025. This demonstrates the desire of governments to promote the growth of 5G technologies. Government grants for 5G supplier’s R&D, subsidies, and other forms of aid help telecom companies and other 5G-related businesses build expensive infrastructures and services that will encourage the spread of 5G. Government funding is assisting the development of the 5G industry. The increase in government initiatives during the forecast period will likely accelerate the adoption of 5G Infrastructure in Aerospace and Defense.

5G Infrastructure in Aerospace and Defense Market

Which are the key investments by the 5G Infrastructure in Aerospace and Defense market players?

To start 5G infrastructure in China, Japan, South Korea, China Mobile, KT Corp., and China Telecom are investing much money. During the forecast period, increased national investments in 5G technologies are anticipated to fuel the market’s expansion. For instance, the U.S. Department of Defense announced in October 2020 that it would invest $600 million in 5G test beds and other experimental projects at 5 U.S. military test sites. The project will be extended over several more military bases in the future.

Some major players in the 5G Infrastructure in Aerospace and Defense market are Telefonaktiebolaget LM Ericsson, Huawei Investment & Holding Co., Ltd, Nokia Corporation, Samsung Electronics Co., Ltd, NEC Corporation, Thales Group, L3Harris Technologies, Inc., Raytheon Technologies Corporation, Ligado Networks, and Wind River Systems, Inc.

What are the Major Driving Factors for the 5G Infrastructure in Aerospace and Defense Market?

The Internet of Things (IoT) is expected to grow demand for 5G technology during the forecast period, propelling the market for 5G services. According to information from the Federation of Indian Chambers of Commerce and Industry (FICCI), the IoT is expected to generate US$ 1.1 trillion in revenue globally by the end of 2025. Due to the swift advancement of virtualization in the networking domain, the 5G industry is likely to experience significant growth in the near future. The market is expected to grow due to the low latency provided and the faster data speeds. Ultra-High Definition (UHD) videos, augmented reality, and virtual reality are just a few industries where 5G services will be in high demand. The introduction and adoption of technologies like Enhanced Mobile Broadband and Ultra Reliable Low Latency Communication are fueling the development of the 5G core market.

What are the Major Risks for the 5G Infrastructure in Aerospace and Defense Market?

The high cost of the mobile phone subscription for the 5G network is anticipated to impede the 5G Infrastructure in Aerospace and Defense market growth during the forecast period. Because of the high cost of production, 5G smartphones would be pricey, which is likely to restrain market growth going forward.

Which is the key application in the 5G Infrastructure in Aerospace and Defense market?

During the forecast period, the Airborne segment is expected to hold a prominent share in the global 5G Infrastructure in Aerospace and Defense market. Potassium hydroxide is an inorganic combination with the formula KOH and is also comprehended as As 5G technology develops, airborne applications like drones and mission-critical communications will be able to operate more effectively. This market’s expansion is driven by the rapid development of 5G networks and infrastructure and the rising usage of IoT devices and 5G networks. The objectives are modernizing communication systems, enhancing connectivity, and reducing response times in emergencies. The increased use of automated vehicles for surveillance, intelligence gathering, and target recognition is another important factor fueling market revenue growth.

How is the 5G Infrastructure in Aerospace and Defense market performing in regions?

During the forecast period, the Asia Pacific market is anticipated to witness the fastest growth in the global 5G Infrastructure in Aerospace and Defense market. The active involvement of established key regional players can be blamed for the 5G technology’s explosive growth in APAC. Furthermore, the region’s 5G Infrastructure in Aerospace and Defense market has been significantly boosted by the rising demand for smartphones with high-speed data in developing nations like India, China, and Japan.  The spectrum will be priced by the Department of Telecommunications (DoT), but significant investment in 5G technology is likely to drive up the cost of the spectrum.

What is the regulatory landscape for the 5G Infrastructure in Aerospace and Defense market?

A road map for addressing the technical, security, standards and policy, and partnership aspects of how DoD can use and advance 5G networks and applications are provided by the DoD 5G Strategy and this implementation plan. Compared to earlier wireless technology generations, 5G offers many more features that can be tailored for particular applications, such as to satisfy an application’s performance or security needs.  Additionally, commercial technologies and applications are increasingly in line with DoD requirements.  As a result, DoD has the chance to utilize 5G applications early on, assisting American businesses in developing and maturing those applications and the underlying 5G ecosystem more quickly.

What is the Market Size of 5G Infrastructure in Aerospace and Defense regarding value?

The global 5G Infrastructure in Aerospace and Defense market is anticipated to grow at a substantial CAGR of 28.50% in the upcoming years. The global 5G Infrastructure in Aerospace and Defense industry was estimated to be worth USD 615.9 million in 2022 and was expected to be worth USD 3563.13 million by 2030.

Shape Your Report to Specific Countries or Regions & Enjoy 30% Off!

What are the major players planning for the future of the 5G Infrastructure in Aerospace and Defense market?

The 5G network is expected to be used by the defense industry for both current and future systems, taking advantage of its beneficial and valuable features like quick response times and wide bandwidths, which are soon anticipated to enable incredibly quick transmission and reception of images showing real-time battlefield events. According to estimates, these factors will also accelerate the adoption of 5G technologies in the aerospace and defense sectors, ultimately boosting the market growth in the ensuing years.

REPORT ATTRIBUTE DETAILS
5G Infrastructure in Aerospace and Defense Market by Volume Yes
5G Infrastructure in Aerospace and Defense Market by Value Yes
5G Infrastructure in Aerospace and Defense Market, Tornado Analysis Yes
5G Infrastructure in Aerospace and Defense Market, STAR Analysis Yes
5G Infrastructure in Aerospace and Defense Market, SRC Analysis Yes
5G Infrastructure in Aerospace and Defense Market Pricing Analysis Yes (On Demand)
5G Infrastructure in Aerospace and Defense Market Segment Analysis By Communication Infrastructure (Small Cell, Macro Cell, and Radio Access Network (RAN))

By Core Network Technology (Software-Defined Networking (SDN), Fog Computing (FC), Mobile Edge Computing (MEC), and Network Functions Virtualization (NFV))

By Network Type (Enhanced Mobile Broadband (eMBB), Ultra-Reliable Low-Latency Communications (URLLC), and Massive Machine Type Communications (MMTC))

By Chipset (Application-specific Integrated Circuit (ASIC) Chipset, Radio Frequency Integrated Circuit (RFIC) Chipset, and Millimeter Wave (mmWave) Chipset)

By Platform (Land, Naval, and Airborne)

5G Infrastructure in Aerospace and Defense Market, Regional Analysis North America (US and Canada)

Europe (Germany, UK, France, Italy, Spain, and Rest of Europe)

Asia Pacific (China, India, Japan, South Korea, South East Asia, and Rest of Asia Pacific)

Latin America (Brazil, Mexico, and Rest of Latin America)

Middle East and Africa (GCC Countries, South Africa, and Rest of Middle East and Africa)

5G Infrastructure in Aerospace and Defense Market Key Companies Telefonaktiebolaget LM Ericsson, Huawei Investment & Holding Co., Ltd, Nokia Corporation, Samsung Electronics Co., Ltd, NEC Corporation, Thales Group, L3Harris Technologies, Inc., Raytheon Technologies Corporation, Ligado Networks, and Wind River Systems, Inc.
5G Infrastructure in Aerospace and Defense Market Competitive Landscape Market Share Analysis

Competitive Benchmarking

Key Players Market Positioning

Geographical Presence Analysis

Major Strategies Adopted

Segmentation of Global 5G Infrastructure in Aerospace and Defense Market-

Global 5G Infrastructure in Aerospace and Defense Market – By Communication Infrastructure

  • Small Cell
  • Macro Cell
  • Radio Access Network (RAN)

Global 5G Infrastructure in Aerospace and Defense Market – By Core Network Technology

  • Software-Defined Networking (SDN)
  • Fog Computing (FC)
  • Mobile Edge Computing (MEC)
  • Network Functions Virtualization (NFV)

Global 5G Infrastructure in Aerospace and Defense Market – By Network Type

  • Enhanced Mobile Broadband (eMBB)
  • Ultra-Reliable Low-Latency Communications (URLLC)
  • Massive Machine Type Communications (MMTC)

Global 5G Infrastructure in Aerospace and Defense Market – By Chipset

  • Application-specific Integrated Circuit (ASIC) Chipset
  • Radio Frequency Integrated Circuit (RFIC) Chipset
  • Millimeter Wave (mmWave) Chipset

Global 5G Infrastructure in Aerospace and Defense Market – By Platform

  • Land
  • Naval
  • Airborne

Global 5G Infrastructure in Aerospace and Defense Market – By Region

  • North America
    • U.S.
    • Canada
  • Europe
    • Germany
    • France
    • U.K.
    • Italy
    • Spain
    • Rest of Europe
  • Asia Pacific
    • China
    • Japan
    • India
    • South Korea
    • South-east Asia
    • Rest of Asia Pacific
  • Latin America
    • Brazil
    • Mexico
    • Rest of Latin America
  • Middle East & Africa
    • GCC Countries
    • South Africa
    • Rest of Middle East and Africa

1. Preface
1.1. Report Description
1.1.1. Purpose of the Report
1.1.2. Target Audience
1.1.3. USP and Key Offerings
1.2. Research Scope
1.3. Research Methodology
1.3.1. Phase I – Secondary Research
1.3.2. Phase II – Primary Research
1.3.3. Phase III – Expert Panel Review
1.3.4. Approach Adopted
1.3.4.1. Top-Down Approach
1.3.4.2. Bottom-Up Approach
1.3.5. Assumptions
1.4. Market Introduction
1.5. Market Research Scope

2. Executive Summary
2.1. Market Snapshot: Global Automotive Air Filters Market
2.2. Global Automotive Air Filters Market, By Type
2.3. Global Automotive Air Filters Market, By Vehicle Type
2.4. Global Automotive Air Filters Market, By Propulsion
2.5. Global Automotive Air Filters Market, By Sales Channel
2.6. Global Automotive Air Filters Market, By Region

3. Market Dynamics & Factors Analysis
3.1. Introduction
3.1.1. Global Automotive Air Filters Market Value, 2017-2030, (US$ Mn))
3.1.2. Y-o-Y Growth Trend Analysis
3.2. Market Dynamics
3.2.1. Market Drivers
3.2.2. Market Restraints
3.2.3. Market Opportunities
3.2.4. Major Industry Challenges
3.3. Growth and Development Patterns
3.4. Investment Feasibility Analysis
3.5. Market Opportunity Analysis
3.5.1. Type
3.5.2. Vehicle Type
3.5.3. Propulsion
3.5.4. Sales Channel
3.5.5. Geography

4. Premium Insights
4.1. STAR (Situation, Task, Action, Results) Analysis
4.2. Porter’s Five Forces Analysis
4.2.1. Threat of New Entrants
4.2.2. Bargaining Power of Buyers/Consumers
4.2.3. Bargaining Power of Suppliers
4.2.4. Threat of Substitute Types
4.2.5. Intensity of Competitive Rivalry
4.3. Key Market Trends
4.3.1. Demand Side Trends
4.3.2. Supply Side Trends
4.4. Value Chain Analysis
4.5. Type Analysis
4.6. Analysis and Recommendations
4.7. Marketing Strategy Analysis
4.7.1. Direct Marketing
4.7.2. Indirect Marketing
4.7.3. Marketing Channel Development Trend

5. Market Positioning of Key Players, 2022
5.1. Company market share of key players, 2022
5.2. Competitive Benchmarking
5.3. Market Positioning of Key Vendors
5.4. Geographical Presence Analysis
5.5. Major Strategies Adopted by Key Players
5.5.1. Key Strategies Analysis
5.5.2. Mergers and Acquisitions
5.5.3. Partnerships
5.5.4. Product Launch
5.5.5. Geographical Expansion
5.5.6. Others

6. Economic Impact Analysis
6.1. Recession Impact
6.1.1. North America
6.1.2. Europe
6.1.3. Asia Pacific
6.1.4. Latin America
6.1.5. Middle East and Africa
6.2. Ukraine-Russia War Impact
6.2.1. North America
6.2.2. Europe
6.2.3. Asia Pacific
6.2.4. Latin America
6.2.5. Middle East and Africa
6.3. COVID-19 Impact Analysis
6.3.1. North America
6.3.2. Europe
6.3.3. Asia Pacific
6.3.4. Latin America
6.3.5. Middle East and Africa

7. Global Automotive Air Filters Market
7.1. Global Automotive Air Filters Market, by Type, 2017-2030 (US$ Mn))
7.1.1. Overview
7.1.2. Global Automotive Air Filters Market, By Type, 2022 vs 2030 (in%)
7.1.3. Global Automotive Air Filters Market, By Air Intake Filters, 2017-2030 (US$ Mn))
7.1.4. Global Automotive Air Filters Market, By Cabin Air Filters, 2017-2030 (US$ Mn))
7.2. Global Automotive Air Filters Market, by Vehicle Type, 2017-2030 (US$ Mn))
7.2.1. Overview
7.2.2. Global Automotive Air Filters Market, By Vehicle Type, 2022 vs 2030 (in%)
7.2.3. Global Automotive Air Filters Market, By Passenger Cars, 2017-2030 (US$ Mn))
7.2.4. Global Automotive Air Filters Market, By Light Commercial Vehicles, 2017-2030 (US$ Mn))
7.2.5. Global Automotive Air Filters Market, By Heavy Commercial Vehicles, 2017-2030 (US$ Mn))
7.3. Global Automotive Air Filters Market, by Propulsion, 2017-2030 (US$ Mn))
7.3.1. Overview
7.3.2. Global Automotive Air Filters Market, By Propulsion, 2022 vs 2030 (in%)
7.3.3. Global Automotive Air Filters Market, By ICE and Hybrid Vehicles, 2017-2030 (US$ Mn))
7.3.4. Global Automotive Air Filters Market, By Electric Vehicles, 2017-2030 (US$ Mn))
7.4. Global Automotive Air Filters Market, by Sales Channel, 2017-2030 (US$ Mn))
7.4.1. Overview
7.4.2. Global Automotive Air Filters Market, By Sales Channel, 2022 vs 2030 (in%)
7.4.3. Global Automotive Air Filters Market, By Original Equipment Manufacturer (OEM), 2017-2030 (US$ Mn))
7.4.4. Global Automotive Air Filters Market, By Aftermarket, 2017-2030 (US$ Mn))

8. North America Automotive Air Filters Market Analysis
8.1. North America Automotive Air Filters Market, by Type, 2017-2030(US$ Mn))
8.1.1. Overview
8.1.2. SRC Analysis
8.2. North America Automotive Air Filters Market, by Vehicle Type, 2017-2030(US$ Mn))
8.2.1. Overview
8.2.2. SRC Analysis
8.3. North America Automotive Air Filters Market, by Propulsion, 2017-2030(US$ Mn))
8.3.1. Overview
8.3.2. SRC Analysis
8.4. North America Automotive Air Filters Market, by Sales Channel, 2017-2030(US$ Mn))
8.4.1. Overview
8.4.2. SRC Analysis
8.5. North America Automotive Air Filters Market, by Country, 2017-2030 (US$ Mn))
8.5.1. U.S.
8.5.1.1. U.S. Automotive Air Filters Market Estimates and Forecast, 2017-2030 (US$ Mn))
8.5.1.2. U.S. Automotive Air Filters, By Type, 2017-2030 (US$ Mn))
8.5.1.3. U.S. Automotive Air Filters, By Vehicle Type, 2017-2030 (US$ Mn))
8.5.1.4. U.S. Automotive Air Filters, By Propulsion, 2017-2030 (US$ Mn))
8.5.1.5. U.S. Automotive Air Filters, By Sales Channel, 2017-2030 (US$ Mn))
8.5.2. Canada
8.5.2.1. Canada Automotive Air Filters Market Estimates and Forecast, 2017-2030 (US$ Mn))
8.5.2.2. Canada Automotive Air Filters, By Type, 2017-2030 (US$ Mn))
8.5.2.3. Canada Automotive Air Filters, By Vehicle Type, 2017-2030 (US$ Mn))
8.5.2.4. Canada Automotive Air Filters, By Propulsion, 2017-2030 (US$ Mn))
8.5.2.5. Canada Automotive Air Filters, By Sales Channel, 2017-2030 (US$ Mn))

9. Europe Automotive Air Filters Market Analysis
9.1. Europe Automotive Air Filters Market, by Type, 2017-2030(US$ Mn))
9.1.1. Overview
9.1.2. SRC Analysis
9.2. Europe Automotive Air Filters Market, by Vehicle Type, 2017-2030(US$ Mn))
9.2.1. Overview
9.2.2. SRC Analysis
9.3. Europe Automotive Air Filters Market, by Propulsion, 2017-2030(US$ Mn))
9.3.1. Overview
9.3.2. SRC Analysis
9.4. Europe Automotive Air Filters Market, by Sales Channel, 2017-2030(US$ Mn))
9.4.1. Overview
9.4.2. SRC Analysis
9.5. Europe Automotive Air Filters Market, by Country, 2017-2030 (US$ Mn))
9.5.1. Germany
9.5.1.1. Germany Automotive Air Filters Market Estimates and Forecast, 2017-2030 (US$ Mn))
9.5.1.2. Germany Automotive Air Filters, By Type, 2017-2030 (US$ Mn))
9.5.1.3. Germany Automotive Air Filters, By Vehicle Type, 2017-2030 (US$ Mn))
9.5.1.4. Germany Automotive Air Filters, By Propulsion, 2017-2030 (US$ Mn))
9.5.1.5. Germany Automotive Air Filters, By Sales Channel, 2017-2030 (US$ Mn))
9.5.2. France
9.5.2.1. France Automotive Air Filters Market Estimates and Forecast, 2017-2030 (US$ Mn))
9.5.2.2. France Automotive Air Filters, By Type, 2017-2030 (US$ Mn))
9.5.2.3. France Automotive Air Filters, By Vehicle Type, 2017-2030 (US$ Mn))
9.5.2.4. France Automotive Air Filters, By Propulsion, 2017-2030 (US$ Mn))
9.5.2.5. France Automotive Air Filters, By Sales Channel, 2017-2030 (US$ Mn))
9.5.3. UK
9.5.3.1. UK Automotive Air Filters Market Estimates and Forecast, 2017-2030 (US$ Mn))
9.5.3.2. UK Automotive Air Filters, By Type, 2017-2030 (US$ Mn))
9.5.3.3. UK Automotive Air Filters, By Vehicle Type, 2017-2030 (US$ Mn))
9.5.3.4. UK Automotive Air Filters, By Propulsion, 2017-2030 (US$ Mn))
9.5.3.5. UK Automotive Air Filters, By Sales Channel, 2017-2030 (US$ Mn))
9.5.4. Italy
9.5.4.1. Italy Automotive Air Filters Market Estimates and Forecast, 2017-2030 (US$ Mn))
9.5.4.2. Italy Automotive Air Filters, By Type, 2017-2030 (US$ Mn))
9.5.4.3. Italy Automotive Air Filters, By Vehicle Type, 2017-2030 (US$ Mn))
9.5.4.4. Italy Automotive Air Filters, By Propulsion, 2017-2030 (US$ Mn))
9.5.4.5. Italy Automotive Air Filters, By Sales Channel, 2017-2030 (US$ Mn))
9.5.5. Spain
9.5.5.1. Spain Automotive Air Filters Market Estimates and Forecast, 2017-2030 (US$ Mn))
9.5.5.2. Spain Automotive Air Filters, By Type, 2017-2030 (US$ Mn))
9.5.5.3. Spain Automotive Air Filters, By Vehicle Type, 2017-2030 (US$ Mn))
9.5.5.4. Spain Automotive Air Filters, By Propulsion, 2017-2030 (US$ Mn))
9.5.5.5. Spain Automotive Air Filters, By Sales Channel, 2017-2030 (US$ Mn))
9.5.6. Rest of Europe
9.5.6.1. Rest of Europe Automotive Air Filters Market Estimates and Forecast, 2017-2030 (US$ Mn))
9.5.6.2. Rest of Europe Automotive Air Filters, By Type, 2017-2030 (US$ Mn))
9.5.6.3. Rest of Europe Automotive Air Filters, By Vehicle Type, 2017-2030 (US$ Mn))
9.5.6.4. Rest of Europe Automotive Air Filters, By Propulsion, 2017-2030 (US$ Mn))
9.5.6.5. Rest of Europe Automotive Air Filters, By Sales Channel, 2017-2030 (US$ Mn))

10. Asia Pacific Automotive Air Filters Market Analysis
10.1. Asia Pacific Automotive Air Filters Market, by Type, 2017-2030(US$ Mn))
10.1.1. Overview
10.1.2. SRC Analysis
10.2. Asia Pacific Automotive Air Filters Market, by Vehicle Type, 2017-2030(US$ Mn))
10.2.1. Overview
10.2.2. SRC Analysis
10.3. Asia Pacific Automotive Air Filters Market, by Propulsion, 2017-2030(US$ Mn))
10.3.1. Overview
10.3.2. SRC Analysis
10.4. Asia Pacific Automotive Air Filters Market, by Sales Channel, 2017-2030(US$ Mn))
10.4.1. Overview
10.4.2. SRC Analysis
10.5. Asia Pacific Automotive Air Filters Market, by Country, 2017-2030 (US$ Mn))
10.5.1. China
10.5.1.1. China Automotive Air Filters Market Estimates and Forecast, 2017-2030 (US$ Mn))
10.5.1.2. China Automotive Air Filters, By Type, 2017-2030 (US$ Mn))
10.5.1.3. China Automotive Air Filters, By Vehicle Type, 2017-2030 (US$ Mn))
10.5.1.4. China Automotive Air Filters, By Propulsion, 2017-2030 (US$ Mn))
10.5.1.5. China Automotive Air Filters, By Sales Channel, 2017-2030 (US$ Mn))
10.5.2. Japan
10.5.2.1. Japan Automotive Air Filters Market Estimates and Forecast, 2017-2030 (US$ Mn))
10.5.2.2. Japan Automotive Air Filters, By Type, 2017-2030 (US$ Mn))
10.5.2.3. Japan Automotive Air Filters, By Vehicle Type, 2017-2030 (US$ Mn))
10.5.2.4. Japan Automotive Air Filters, By Propulsion, 2017-2030 (US$ Mn))
10.5.2.5. Japan Automotive Air Filters, By Sales Channel, 2017-2030 (US$ Mn))
10.5.3. India
10.5.3.1. India Automotive Air Filters Market Estimates and Forecast, 2017-2030 (US$ Mn))
10.5.3.2. India Automotive Air Filters, By Type, 2017-2030 (US$ Mn))
10.5.3.3. India Automotive Air Filters, By Vehicle Type, 2017-2030 (US$ Mn))
10.5.3.4. India Automotive Air Filters, By Propulsion, 2017-2030 (US$ Mn))
10.5.3.5. India Automotive Air Filters, By Sales Channel, 2017-2030 (US$ Mn))
10.5.4. South Korea
10.5.4.1. South Korea Automotive Air Filters Market Estimates and Forecast, 2017-2030 (US$ Mn))
10.5.4.2. South Korea Automotive Air Filters, By Type, 2017-2030 (US$ Mn))
10.5.4.3. South Korea Automotive Air Filters, By Vehicle Type, 2017-2030 (US$ Mn))
10.5.4.4. South Korea Automotive Air Filters, By Propulsion, 2017-2030 (US$ Mn))
10.5.4.5. South Korea Automotive Air Filters, By Sales Channel, 2017-2030 (US$ Mn))
10.5.5. South-East Asia
10.5.5.1. South-East Asia Automotive Air Filters Market Estimates and Forecast, 2017-2030 (US$ Mn))
10.5.5.2. South-East Asia Automotive Air Filters, By Type, 2017-2030 (US$ Mn))
10.5.5.3. South-East Asia Automotive Air Filters, By Vehicle Type, 2017-2030 (US$ Mn))
10.5.5.4. South-East Asia Automotive Air Filters, By Propulsion, 2017-2030 (US$ Mn))
10.5.5.5. South-East Asia Automotive Air Filters, By Sales Channel, 2017-2030 (US$ Mn))
10.5.6. Rest of Asia Pacific
10.5.6.1. Rest of Asia Pacific Automotive Air Filters Market Estimates and Forecast, 2017-2030 (US$ Mn))
10.5.6.2. Rest of Asia Pacific Automotive Air Filters, By Type, 2017-2030 (US$ Mn))
10.5.6.3. Rest of Asia Pacific Automotive Air Filters, By Vehicle Type, 2017-2030 (US$ Mn))
10.5.6.4. Rest of Asia Pacific Automotive Air Filters, By Propulsion, 2017-2030 (US$ Mn))
10.5.6.5. Rest of Asia Pacific Automotive Air Filters, By Sales Channel, 2017-2030 (US$ Mn))

11. Latin America Automotive Air Filters Market Analysis
11.1. Latin America Automotive Air Filters Market, by Type, 2017-2030(US$ Mn))
11.1.1. Overview
11.1.2. SRC Analysis
11.2. Latin America Automotive Air Filters Market, by Vehicle Type, 2017-2030(US$ Mn))
11.2.1. Overview
11.2.2. SRC Analysis
11.3. Latin America Automotive Air Filters Market, by Propulsion, 2017-2030(US$ Mn))
11.3.1. Overview
11.3.2. SRC Analysis
11.4. Latin America Automotive Air Filters Market, by Sales Channel, 2017-2030(US$ Mn))
11.4.1. Overview
11.4.2. SRC Analysis
11.5. Latin America Automotive Air Filters Market, by Country, 2017-2030 (US$ Mn))
11.5.1. Brazil
11.5.1.1. Brazil Automotive Air Filters Market Estimates and Forecast, 2017-2030 (US$ Mn))
11.5.1.2. Brazil Automotive Air Filters, By Type, 2017-2030 (US$ Mn))
11.5.1.3. Brazil Automotive Air Filters, By Vehicle Type, 2017-2030 (US$ Mn))
11.5.1.4. Brazil Automotive Air Filters, By Propulsion, 2017-2030 (US$ Mn))
11.5.1.5. Brazil Automotive Air Filters, By Sales Channel, 2017-2030 (US$ Mn))
11.5.2. Mexico
11.5.2.1. Mexico Automotive Air Filters Market Estimates and Forecast, 2017-2030 (US$ Mn))
11.5.2.2. Mexico Automotive Air Filters, By Type, 2017-2030 (US$ Mn))
11.5.2.3. Mexico Automotive Air Filters, By Vehicle Type, 2017-2030 (US$ Mn))
11.5.2.4. Mexico Automotive Air Filters, By Propulsion, 2017-2030 (US$ Mn))
11.5.2.5. Mexico Automotive Air Filters, By Sales Channel, 2017-2030 (US$ Mn))
11.5.3. Rest of Latin America
11.5.3.1. Rest of Latin America Automotive Air Filters Market Estimates and Forecast, 2017-2030 (US$ Mn))
11.5.3.2. Rest of Latin America Automotive Air Filters, By Type, 2017-2030 (US$ Mn))
11.5.3.3. Rest of Latin America Automotive Air Filters, By Vehicle Type, 2017-2030 (US$ Mn))
11.5.3.4. Rest of Latin America Automotive Air Filters, By Propulsion, 2017-2030 (US$ Mn))
11.5.3.5. Rest of Latin America Automotive Air Filters, By Sales Channel, 2017-2030 (US$ Mn))

12. Middle East and Africa Automotive Air Filters Market Analysis
12.1. Middle East and Africa Automotive Air Filters Market, by Type, 2017-2030(US$ Mn))
12.1.1. Overview
12.1.2. SRC Analysis
12.2. Middle East and Africa Automotive Air Filters Market, by Vehicle Type, 2017-2030(US$ Mn))
12.2.1. Overview
12.2.2. SRC Analysis
12.3. Middle East and Africa Automotive Air Filters Market, by Propulsion, 2017-2030(US$ Mn))
12.3.1. Overview
12.3.2. SRC Analysis
12.4. Middle East and Africa Automotive Air Filters Market, by Sales Channel, 2017-2030(US$ Mn))
12.4.1. Overview
12.4.2. SRC Analysis
12.5. Middle East and Africa Automotive Air Filters Market, by Country, 2017-2030 (US$ Mn))
12.5.1. GCC Countries
12.5.1.1. GCC Countries Automotive Air Filters Market Estimates and Forecast, 2017-2030 (US$ Mn))
12.5.1.2. GCC Countries Automotive Air Filters, By Type, 2017-2030 (US$ Mn))
12.5.1.3. GCC Countries Automotive Air Filters, By Vehicle Type, 2017-2030 (US$ Mn))
12.5.1.4. GCC Countries Automotive Air Filters, By Propulsion, 2017-2030 (US$ Mn))
12.5.1.5. GCC Countries Automotive Air Filters, By Sales Channel, 2017-2030 (US$ Mn))
12.5.2. South Africa
12.5.2.1. South Africa Automotive Air Filters Market Estimates and Forecast, 2017-2030 (US$ Mn))
12.5.2.2. South Africa Automotive Air Filters, By Type, 2017-2030 (US$ Mn))
12.5.2.3. South Africa Automotive Air Filters, By Vehicle Type, 2017-2030 (US$ Mn))
12.5.2.4. South Africa Automotive Air Filters, By Propulsion, 2017-2030 (US$ Mn))
12.5.2.5. South Africa Automotive Air Filters, By Sales Channel, 2017-2030 (US$ Mn))
12.5.3. Rest of Middle East and Africa
12.5.3.1. Rest of Middle East and Africa Automotive Air Filters Market Estimates and Forecast, 2017-2030 (US$ Mn))
12.5.3.2. Rest of Middle East and Africa Automotive Air Filters, By Type, 2017-2030 (US$ Mn))
12.5.3.3. Rest of Middle East and Africa Automotive Air Filters, By Vehicle Type, 2017-2030 (US$ Mn))
12.5.3.4. Rest of Middle East and Africa Automotive Air Filters, By Propulsion, 2017-2030 (US$ Mn))
12.5.3.5. Rest of Middle East and Africa Automotive Air Filters, By Sales Channel, 2017-2030 (US$ Mn))

13. Company Profiles
13.1. Cummins Inc.
13.1.1. Company Overview
13.1.2. Products/Services Portfolio
13.1.3. Geographical Presence
13.1.4. Financial Summary
13.1.4.1. Market Revenue and Net Profit (2019-2022)
13.1.4.2. Business Segment Revenue Analysis
13.1.4.3. Geographical Revenue Analysis
13.2. Denso Corporation
13.3. Donaldson Company, Inc.
13.4. General Motors Company
13.5. Hengst SE, MAHLE GmbH
13.6. MANN+HUMMEL International GmbH & Co. KG
13.7. Robert Bosch GmbH
13.8. Sogefi S.p.A
13.9. K&N Engineering, Inc.
13.10. Toyota Boshoku Corporation
13.11. ALCO Filters Ltd.
13.12. Valeo SA
13.13. UFI FILTERS spa
13.14. Ahlstrom-Munksjo Oyj
13.15. Freudenberg Filtration Technologies SE & Co. KG
13.16. Parker Hannifin Corporation
13.17. Hollingsworth & Vose GmbH
13.18. CabinAir Sweden AB
13.19. Hanon Systems

List of Figures
FIG. 1 Global Automotive Air Filters Market: Research Methodology
FIG. 2 Market Size Estimation – Top Down & Bottom up Approach
FIG. 3 Global Automotive Air Filters Market Segmentation
FIG. 4 Global Automotive Air Filters Market, by Type, 2022 (US$ Mn))
FIG. 5 Global Automotive Air Filters Market, by Vehicle Type, 2022 (US$ Mn))
FIG. 6 Global Automotive Air Filters Market, by Propulsion, 2022 (US$ Mn))
FIG. 7 Global Automotive Air Filters Market, by Sales Channel, 2022 (US$ Mn))
FIG. 8 Global Automotive Air Filters Market, by Geography, 2022 (US$ Mn))
FIG. 9 Attractive Investment Proposition, by Type, 2022
FIG. 10 Attractive Investment Proposition, by Vehicle Type, 2022
FIG. 11 Attractive Investment Proposition, by Propulsion, 2022
FIG. 12 Attractive Investment Proposition, by Sales Channel, 2022
FIG. 13 Attractive Investment Proposition, by Geography, 2022
FIG. 14 Global Market Share Analysis of Key Automotive Air Filters Market Manufacturers, 2022
FIG. 15 Global Market Positioning of Key Automotive Air Filters Market Manufacturers, 2022
FIG. 16 Global Automotive Air Filters Market Value Contribution, By Type, 2022 & 2030 (Value %)
FIG. 17 Global Automotive Air Filters Market, by Air Intake Filters, Value, 2017-2030 (US$ Mn))
FIG. 18 Global Automotive Air Filters Market, by Cabin Air Filters, Value, 2017-2030 (US$ Mn))
FIG. 19 Global Automotive Air Filters Market Value Contribution, By Vehicle Type, 2022 & 2030 (Value %)
FIG. 20 Global Automotive Air Filters Market, by Passenger Cars, Value, 2017-2030 (US$ Mn))
FIG. 21 Global Automotive Air Filters Market, by Light Commercial Vehicles, 2017-2030 (US$ Mn))
FIG. 22 Global Automotive Air Filters Market, by Heavy Commercial Vehicles, 2017-2030 (US$ Mn))
FIG. 23 Global Automotive Air Filters Market Value Contribution, By Propulsion, 2022 & 2030 (Value %)
FIG. 24 Global Automotive Air Filters Market, by ICE and Hybrid Vehicles, Value, 2017-2030 (US$ Mn))
FIG. 25 Global Automotive Air Filters Market, by Electric Vehicles, 2017-2030 (US$ Mn))
FIG. 26 Global Automotive Air Filters Market Value Contribution, By Sales Channel, 2022 & 2030 (Value %)
FIG. 27 Global Automotive Air Filters Market, by Original Equipment Manufacturer (OEM), Value, 2017-2030 (US$ Mn))
FIG. 28 Global Automotive Air Filters Market, by Aftermarket, 2017-2030 (US$ Mn))
FIG. 29 North America Automotive Air Filters Market, 2017-2030 (US$ Mn))
FIG. 30 U.S. Automotive Air Filters Market, 2017-2030 (US$ Mn))
FIG. 31 Canada Automotive Air Filters Market, 2017-2030 (US$ Mn))
FIG. 32 Europe Automotive Air Filters Market, 2017-2030 (US$ Mn))
FIG. 33 Germany Automotive Air Filters Market, 2017-2030 (US$ Mn))
FIG. 34 France Automotive Air Filters Market, 2017-2030 (US$ Mn))
FIG. 35 U.K. Automotive Air Filters Market, 2017-2030 (US$ Mn))
FIG. 36 Italy Automotive Air Filters Market, 2017-2030 (US$ Mn))
FIG. 37 Spain Automotive Air Filters Market, 2017-2030 (US$ Mn))
FIG. 38 Rest of Europe Automotive Air Filters Market, 2017-2030 (US$ Mn))
FIG. 39 Asia Pacific Automotive Air Filters Market, 2017-2030 (US$ Mn))
FIG. 40 China Automotive Air Filters Market, 2017-2030 (US$ Mn))
FIG. 41 Japan Automotive Air Filters Market, 2017-2030 (US$ Mn))
FIG. 42 India Automotive Air Filters Market, 2017-2030 (US$ Mn))
FIG. 43 South Korea Automotive Air Filters Market, 2017-2030 (US$ Mn))
FIG. 44 South-East Asia Automotive Air Filters Market, 2017-2030 (US$ Mn))
FIG. 45 Rest of Asia Pacific Automotive Air Filters Market, 2017-2030 (US$ Mn))
FIG. 46 Latin America Automotive Air Filters Market, 2017-2030 (US$ Mn))
FIG. 47 Brazil Automotive Air Filters Market, 2017-2030 (US$ Mn))
FIG. 48 Mexico Automotive Air Filters Market, 2017-2030 (US$ Mn))
FIG. 49 Rest of Latin America Automotive Air Filters Market, 2017-2030 (US$ Mn))
FIG. 50 Middle East & Africa Automotive Air Filters Market, 2017-2030 (US$ Mn))
FIG. 51 GCC Countries Automotive Air Filters Market, 2017-2030 (US$ Mn))
FIG. 52 South Africa Automotive Air Filters Market, 2017-2030 (US$ Mn))
FIG. 53 Rest of Middle East and Africa Automotive Air Filters Market, 2017-2030 (US$ Mn))

List of Tables
TABLE 1 Market Snapshot: Global Automotive Air Filters Market
TABLE 2 Global Automotive Air Filters Market, by Competitive Benchmarking, 2022
TABLE 3 Global Automotive Air Filters Market, by Geographical Presence Analysis, 2022
TABLE 4 Global Automotive Air Filters Market, by Key Strategies Analysis, 2022
TABLE 5 Global Automotive Air Filters Market, by Type, 2017-2030 (US$ Mn))
TABLE 6 Global Automotive Air Filters Market, by Vehicle Type, 2017-2030 (US$ Mn))
TABLE 7 Global Automotive Air Filters Market, by Propulsion, 2017-2030 (US$ Mn))
TABLE 8 Global Automotive Air Filters Market, by Sales Channel, 2017-2030 (US$ Mn))
TABLE 9 Global Automotive Air Filters Market, by Geography, 2017-2030 (US$ Mn))
TABLE 10 North America Automotive Air Filters Market, by Type, 2017-2030 (US$ Mn))
TABLE 11 North America Automotive Air Filters Market, by Vehicle Type, 2017-2030 (US$ Mn))
TABLE 12 North America Automotive Air Filters Market, by Propulsion, 2017-2030 (US$ Mn))
TABLE 13 North America Automotive Air Filters Market, by Sales Channel, 2017-2030 (US$ Mn))
TABLE 14 North America Automotive Air Filters Market, by Country, 2017-2030 (US$ Mn))
TABLE 15 US Automotive Air Filters Market, by Type, 2017-2030 (US$ Mn))
TABLE 16 US Automotive Air Filters Market, by Vehicle Type, 2017-2030 (US$ Mn))
TABLE 17 US Automotive Air Filters Market, by Propulsion, 2017-2030 (US$ Mn))
TABLE 18 US Automotive Air Filters Market, by Sales Channel, 2017-2030 (US$ Mn))
TABLE 19 Canada Automotive Air Filters Market, by Type, 2017-2030 (US$ Mn))
TABLE 20 Canada Automotive Air Filters Market, by Vehicle Type, 2017-2030 (US$ Mn))
TABLE 21 Canada Automotive Air Filters Market, by Propulsion, 2017-2030 (US$ Mn))
TABLE 22 Canada Automotive Air Filters Market, by Sales Channel, 2017-2030 (US$ Mn))
TABLE 23 Europe Automotive Air Filters Market, by Type, 2017-2030 (US$ Mn))
TABLE 24 Europe Automotive Air Filters Market, by Vehicle Type, 2017-2030 (US$ Mn))
TABLE 25 Europe Automotive Air Filters Market, by Propulsion, 2017-2030 (US$ Mn))
TABLE 26 Europe Automotive Air Filters Market, by Sales Channel, 2017-2030 (US$ Mn))
TABLE 27 Europe Automotive Air Filters Market, by Country, 2017-2030 (US$ Mn))
TABLE 28 Germany Automotive Air Filters Market, by Type, 2017-2030 (US$ Mn))
TABLE 29 Germany Automotive Air Filters Market, by Vehicle Type, 2017-2030 (US$ Mn))
TABLE 30 Germany Automotive Air Filters Market, by Propulsion, 2017-2030 (US$ Mn))
TABLE 31 Germany Automotive Air Filters Market, by Sales Channel, 2017-2030 (US$ Mn))
TABLE 32 France Automotive Air Filters Market, by Type, 2017-2030 (US$ Mn))
TABLE 33 France Automotive Air Filters Market, by Vehicle Type, 2017-2030 (US$ Mn))
TABLE 34 France Automotive Air Filters Market, by Propulsion, 2017-2030 (US$ Mn))
TABLE 35 France Automotive Air Filters Market, by Sales Channel, 2017-2030 (US$ Mn))
TABLE 36 UK Automotive Air Filters Market, by Type, 2017-2030 (US$ Mn))
TABLE 37 UK Automotive Air Filters Market, by Vehicle Type, 2017-2030 (US$ Mn))
TABLE 38 UK Automotive Air Filters Market, by Propulsion, 2017-2030 (US$ Mn))
TABLE 39 UK Automotive Air Filters Market, by Sales Channel, 2017-2030 (US$ Mn))
TABLE 40 Italy Automotive Air Filters Market, by Type, 2017-2030 (US$ Mn))
TABLE 41 Italy Automotive Air Filters Market, by Vehicle Type, 2017-2030 (US$ Mn))
TABLE 42 Italy Automotive Air Filters Market, by Propulsion, 2017-2030 (US$ Mn))
TABLE 43 Italy Automotive Air Filters Market, by Sales Channel, 2017-2030 (US$ Mn))
TABLE 44 Spain Automotive Air Filters Market, by Type, 2017-2030 (US$ Mn))
TABLE 45 Spain Automotive Air Filters Market, by Vehicle Type, 2017-2030 (US$ Mn))
TABLE 46 Spain Automotive Air Filters Market, by Propulsion, 2017-2030 (US$ Mn))
TABLE 47 Spain Automotive Air Filters Market, by Sales Channel, 2017-2030 (US$ Mn))
TABLE 48 Rest of Europe Automotive Air Filters Market, by Type, 2017-2030 (US$ Mn))
TABLE 49 Rest of Europe Automotive Air Filters Market, by Vehicle Type, 2017-2030 (US$ Mn))
TABLE 50 Rest of Europe Automotive Air Filters Market, by Propulsion, 2017-2030 (US$ Mn))
TABLE 51 Rest of Europe Automotive Air Filters Market, by Sales Channel, 2017-2030 (US$ Mn))
TABLE 52 Asia Pacific Automotive Air Filters Market, by Type, 2017-2030 (US$ Mn))
TABLE 53 Asia Pacific Automotive Air Filters Market, by Vehicle Type, 2017-2030 (US$ Mn))
TABLE 54 Asia Pacific Automotive Air Filters Market, by Propulsion, 2017-2030 (US$ Mn))
TABLE 55 Asia Pacific Automotive Air Filters Market, by Sales Channel, 2017-2030 (US$ Mn))
TABLE 56 Asia Pacific Automotive Air Filters Market, by Country, 2017-2030 (US$ Mn))
TABLE 57 China Automotive Air Filters Market, by Type, 2017-2030 (US$ Mn))
TABLE 58 China Automotive Air Filters Market, by Vehicle Type, 2017-2030 (US$ Mn))
TABLE 59 China Automotive Air Filters Market, by Propulsion, 2017-2030 (US$ Mn))
TABLE 60 China Automotive Air Filters Market, by Sales Channel, 2017-2030 (US$ Mn))
TABLE 61 Japan Automotive Air Filters Market, by Type, 2017-2030 (US$ Mn))
TABLE 62 Japan Automotive Air Filters Market, by Vehicle Type, 2017-2030 (US$ Mn))
TABLE 63 Japan Automotive Air Filters Market, by Propulsion, 2017-2030 (US$ Mn))
TABLE 64 Japan Automotive Air Filters Market, by Sales Channel, 2017-2030 (US$ Mn))
TABLE 65 India Automotive Air Filters Market, by Type, 2017-2030 (US$ Mn))
TABLE 66 India Automotive Air Filters Market, by Vehicle Type, 2017-2030 (US$ Mn))
TABLE 67 India Automotive Air Filters Market, by Propulsion, 2017-2030 (US$ Mn))
TABLE 68 India Automotive Air Filters Market, by Sales Channel, 2017-2030 (US$ Mn))
TABLE 69 South Korea Automotive Air Filters Market, by Type, 2017-2030 (US$ Mn))
TABLE 70 South Korea Automotive Air Filters Market, by Vehicle Type, 2017-2030 (US$ Mn))
TABLE 71 South Korea Automotive Air Filters Market, by Propulsion, 2017-2030 (US$ Mn))
TABLE 72 South Korea Automotive Air Filters Market, by Sales Channel, 2017-2030 (US$ Mn))
TABLE 73 South-East Asia Automotive Air Filters Market, by Type, 2017-2030 (US$ Mn))
TABLE 74 South-East Asia Automotive Air Filters Market, by Vehicle Type, 2017-2030 (US$ Mn))
TABLE 75 South-East Asia Automotive Air Filters Market, by Propulsion, 2017-2030 (US$ Mn))
TABLE 76 South-East Asia Automotive Air Filters Market, by Sales Channel, 2017-2030 (US$ Mn))
TABLE 77 Rest of Asia Pacific Automotive Air Filters Market, by Type, 2017-2030 (US$ Mn))
TABLE 78 Rest of Asia Pacific Automotive Air Filters Market, by Vehicle Type, 2017-2030 (US$ Mn))
TABLE 79 Rest of Asia Pacific Automotive Air Filters Market, by Propulsion, 2017-2030 (US$ Mn))
TABLE 80 Rest of Asia Pacific Automotive Air Filters Market, by Sales Channel, 2017-2030 (US$ Mn))
TABLE 81 Latin America Automotive Air Filters Market, by Type, 2017-2030 (US$ Mn))
TABLE 82 Latin America Automotive Air Filters Market, by Vehicle Type, 2017-2030 (US$ Mn))
TABLE 83 Latin America Automotive Air Filters Market, by Propulsion, 2017-2030 (US$ Mn))
TABLE 84 Latin America Automotive Air Filters Market, by Sales Channel, 2017-2030 (US$ Mn))
TABLE 85 Latin America Automotive Air Filters Market, by Country, 2017-2030 (US$ Mn))
TABLE 86 Brazil Automotive Air Filters Market, by Type, 2017-2030 (US$ Mn))
TABLE 87 Brazil Automotive Air Filters Market, by Vehicle Type, 2017-2030 (US$ Mn))
TABLE 88 Brazil Automotive Air Filters Market, by Propulsion, 2017-2030 (US$ Mn))
TABLE 89 Brazil Automotive Air Filters Market, by Sales Channel, 2017-2030 (US$ Mn))
TABLE 90 Mexico Automotive Air Filters Market, by Type, 2017-2030 (US$ Mn))
TABLE 91 Mexico Automotive Air Filters Market, by Vehicle Type, 2017-2030 (US$ Mn))
TABLE 92 Mexico Automotive Air Filters Market, by Propulsion, 2017-2030 (US$ Mn))
TABLE 93 Mexico Automotive Air Filters Market, by Sales Channel, 2017-2030 (US$ Mn))
TABLE 94 Rest of Latin America Automotive Air Filters Market, by Type, 2017-2030 (US$ Mn))
TABLE 95 Rest of Latin America Automotive Air Filters Market, by Vehicle Type, 2017-2030 (US$ Mn))
TABLE 96 Rest of Latin America Automotive Air Filters Market, by Propulsion, 2017-2030 (US$ Mn))
TABLE 97 Rest of Latin America Automotive Air Filters Market, by Sales Channel, 2017-2030 (US$ Mn))
TABLE 98 Middle East and Africa Automotive Air Filters Market, by Type, 2017-2030 (US$ Mn))
TABLE 99 Middle East and Africa Automotive Air Filters Market, by Vehicle Type, 2017-2030 (US$ Mn))
TABLE 100 Middle East and Africa Automotive Air Filters Market, by Propulsion, 2017-2030 (US$ Mn))
TABLE 101 Middle East and Africa Automotive Air Filters Market, by Sales Channel, 2017-2030 (US$ Mn))
TABLE 102 Middle East and Africa Automotive Air Filters Market, by Country, 2017-2030 (US$ Mn))
TABLE 103 GCC Countries Automotive Air Filters Market, by Type, 2017-2030 (US$ Mn))
TABLE 104 GCC Countries Automotive Air Filters Market, by Vehicle Type, 2017-2030 (US$ Mn))
TABLE 105 GCC Countries Automotive Air Filters Market, by Propulsion, 2017-2030 (US$ Mn))
TABLE 106 GCC Countries Automotive Air Filters Market, by Sales Channel, 2017-2030 (US$ Mn))
TABLE 107 South Africa Automotive Air Filters Market, by Type, 2017-2030 (US$ Mn))
TABLE 108 South Africa Automotive Air Filters Market, by Vehicle Type, 2017-2030 (US$ Mn))
TABLE 109 South Africa Automotive Air Filters Market, by Propulsion, 2017-2030 (US$ Mn))
TABLE 110 South Africa Automotive Air Filters Market, by Sales Channel, 2017-2030 (US$ Mn))
TABLE 111 Rest of Middle East and Africa Automotive Air Filters Market, by Type, 2017-2030 (US$ Mn))
TABLE 112 Rest of Middle East and Africa Automotive Air Filters Market, by Vehicle Type, 2017-2030 (US$ Mn))
TABLE 113 Rest of Middle East and Africa Automotive Air Filters Market, by Propulsion, 2017-2030 (US$ Mn))
TABLE 114 Rest of Middle East and Africa Automotive Air Filters Market, by Sales Channel, 2017-2030 (US$ Mn)

Frequently asked questions

How does COVID-19 Impact the global 5G Infrastructure in Aerospace and Defense market?

The impact of COVID-19 on the world has been unprecedented and staggering, and the pandemic has had a negative effect on the demand for 5G Infrastructure in Aerospace and Defense market globally.

Which is the leading region of the market for 5G Infrastructure in Aerospace and Defense?

North America accounted for the most heightened share in the global 5G Infrastructure in Aerospace and Defense market.

What are the key drivers for the growth of the 5G Infrastructure in Aerospace and Defense market?

Several 5G applications, including high-speed data streaming and real-time health monitoring, are anticipated to be some of the most important market trends for 5G in aviation. These include factors like a rise in demand for 5G Infrastructure in Aerospace and Defense.

Which is the major segment in the 5G Infrastructure in Aerospace and Defense market by type?

The Small Cell segment had a major global market share in 2022.

Which is the major segment in the 5G Infrastructure in Aerospace and Defense market by application?

The Airborne segment had a major share in the global market.

Solar-Powered Drone Market

Published:
Report ID: 33586

Aerial Imaging Market

Published:
Report ID: 2597

Commercial Aircraft Passenger Service Unit (PSU) Market

Published:
Report ID: 32095

Aviation Fuel Market

Published:
Report ID: 23337

Defense Cyber Security Market

Published:
Report ID: 23353

Aerospace Valves Market

Published:
Report ID: 22847

Intelligent Marine Navigation Systems Market

Published:
Report ID: 6903

Flight Management Systems (FMS) Market

Published:
Report ID: 18832

Aerospace Antimicrobial Coating Market

Published:
Report ID: 18580

Ground and Cargo Handling Services Market

Published:
Report ID: 17986

High Altitude Platforms (HAPs) Market

Published:
Report ID: 6809

Purchase Options

$2999
Delivery Format: Excel.
$4999
Designed for the individual purchaser.
$6999
Users located at a single corporate site or regional office.
$7999
Allowed for unlimited sharing globally within one company.
Smallform of Sample request

Have a question?

User Profile

Don’t settle for less – trust Mitul to help you find the best solution.

Report delivery within 24 to 48 hours

– Other Info –

What people say?-

User Review

I am very impressed with the information in this report. The author clearly did their research when they came up with this product and it has already given me a lot of ideas.

Jana Schmidt
CEDAR CX Technologies

– Connect with us –

Phone

+91 6232 49 3207


support

24/7 Research Support


sales@credenceresearch.com

– Research Methodology –

Going beyond the basics: advanced techniques in research methodology

– Trusted By –

Pepshi, LG, Nestle
Motorola, Honeywell, Johnson and johnson
LG Chem, SIEMENS, Pfizer
Unilever, Samsonite, QIAGEN