
| REPORT ATTRIBUTE | DETAILS |
|---|---|
| Historical Period | 2020-2023 |
| Base Year | 2024 |
| Forecast Period | 2025-2032 |
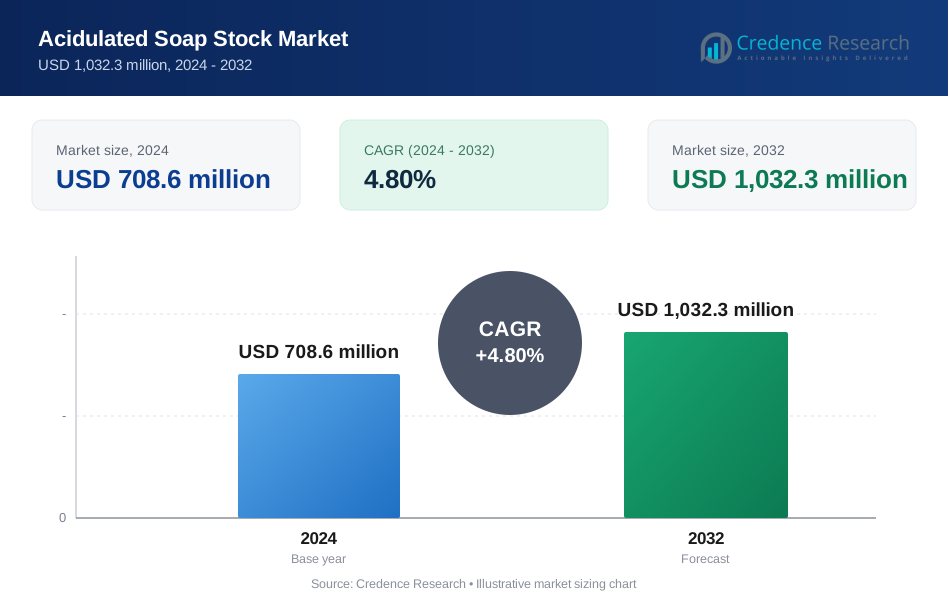
| Acidulated Soap Stock Market Size 2024 | USD 708.6 million |
| Acidulated Soap Stock Market, CAGR | 4.80% |
| Acidulated Soap Stock Market Size 2032 | USD 1,032.3 million |
Market Overview
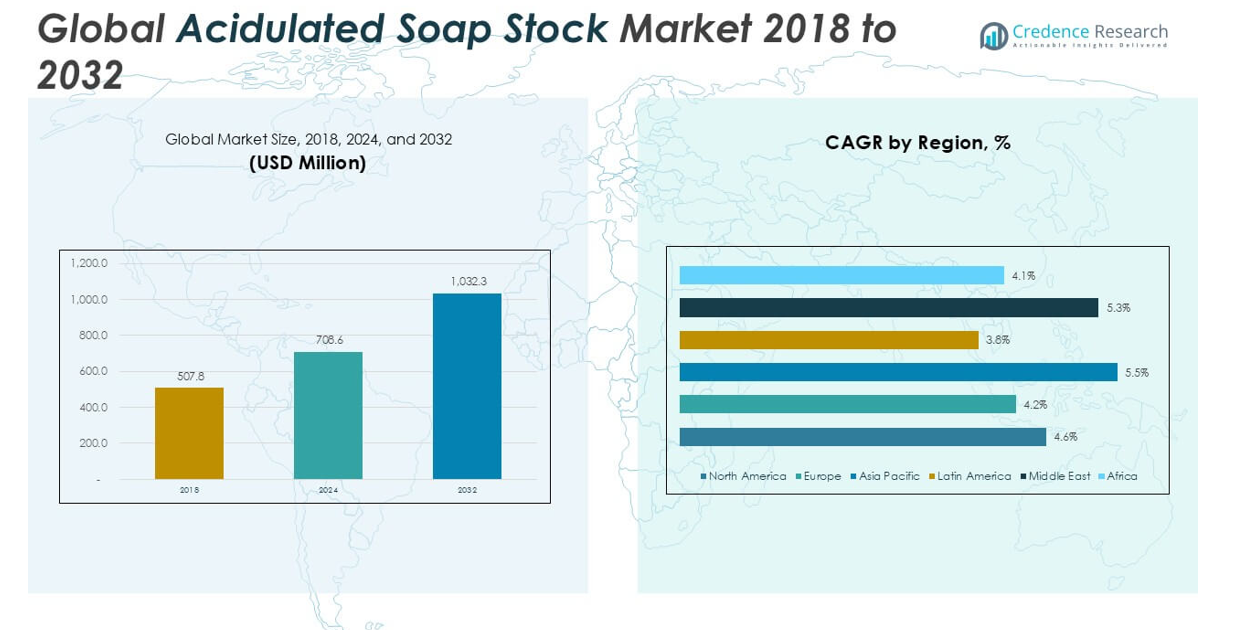
The Acidulated Soap Stock market size was valued at USD 507.8 million in 2018, reached USD 708.6 million in 2024, and is anticipated to reach USD 1,032.3 million by 2032, at a CAGR of 4.80% during the forecast period. The Acidulated Soap Stock market is led by prominent players such as Archer Daniels Midland Company, Cargill, Incorporated, Nutreco N.V., FFM Berhad, Bunge Limited, SEMO Milling, LLC, Wilmar International Limited, Louis Dreyfus Company, IOI Loders Croklaan, and Aveno NV. These companies command significant influence due to their robust global supply chains, broad product portfolios, and established client networks. Asia Pacific emerges as the leading region, holding a 31.4% share of the global market in 2024, driven by high demand from the animal feed and biodiesel industries. North America and Europe also represent key markets, supported by advanced processing technologies and strong adoption of sustainable raw material practices. The competitive landscape remains dynamic, with market leaders focusing on efficiency, sustainability, and expansion into high-growth regions.Market Insights
- The Acidulated Soap Stock market reached USD 708.6 million in 2024 and is expected to grow to USD 1,032.3 million by 2032 at a CAGR of 4.80%.
- Market growth is primarily driven by expanding demand in the animal feed and biodiesel sectors, with feed applications contributing about 55% of market share in 2024.
- Trends such as the adoption of sustainable and circular economy practices, alongside increasing utilization of by-products in various industries, are shaping the market’s direction.
- The market is moderately fragmented, with key players like Archer Daniels Midland, Cargill, and Wilmar International competing through diversified product portfolios and expansion strategies, while quality variability and regulatory compliance remain as notable restraints.
- Asia Pacific leads with 31.4% of the global market share in 2024, followed by Europe at 23.0% and North America at 18.6%, while vegetable oil stands as the dominant product type with over 60% segment share.
Market Segmentation Analysis:
By Product Type: Vegetable oil stands as the dominant product type in the Acidulated Soap Stock market, accounting for over 60% of total revenue share in 2024. Within this segment, soybean oil leads due to its high availability, cost-effectiveness, and widespread use in animal feed and industrial applications. The market growth is primarily driven by the expanding biodiesel industry and the increasing demand for sustainable feed ingredients. Glyceride oil, while growing steadily, remains a smaller contributor compared to vegetable oil-based sub-segments.- For instance, Cargill operates soybean oil extraction plants with a combined annual capacity exceeding 10 million metric tons, enabling large-scale acidulated soap stock production for industrial clients.
- For instance, Archer Daniels Midland Company (ADM) produces acidulated soap stock for animal feed formulations across more than 40 feed manufacturing plants worldwide.
Market Overview
Expansion of the Animal Feed Industry
Growth in the global animal feed industry drives demand for acidulated soap stock, as it serves as an economical and energy-rich ingredient for livestock and poultry diets. Feed manufacturers increasingly adopt acidulated soap stock due to its nutritional profile and cost benefits compared to traditional fats and oils. Expanding livestock populations, particularly in emerging markets, further boost consumption, establishing feed as a critical growth engine for the overall market.- For instance, Tyson Foods processes over 41 million chickens per week, with many feed suppliers incorporating acidulated soap stock to meet such large-scale nutritional demands.
Rising Biodiesel Production
The accelerating production of biodiesel significantly contributes to the growth of the Acidulated Soap Stock market. Acidulated soap stock acts as a valuable feedstock for biodiesel manufacturing, favored for its availability and lower procurement cost. Policies promoting renewable energy and sustainable fuels in both developed and developing regions support the adoption of acidulated soap stock, creating new opportunities and strengthening its market position in the biofuels sector.- For instance, Renewable Energy Group’s biodiesel facility in Iowa has a nameplate production capacity of 100 million gallons annually, utilizing acidulated soap stock as a major feedstock.
Increasing Demand for Cost-Effective Raw Materials
Industries such as animal nutrition, soaps, and biodiesel production seek cost-effective raw materials to maintain profitability and operational efficiency. Acidulated soap stock, a by-product of oil refining, provides an attractive alternative due to its competitive pricing and multifunctional applications. The ongoing emphasis on circular economy practices and by-product valorization in various industries accelerates market uptake, further supporting sustained growth.Key Trends & Opportunities
Adoption of Sustainable and Circular Economy Practices
Sustainability and waste minimization trends present strong opportunities for the Acidulated Soap Stock market. Industry players increasingly focus on repurposing by-products, such as acidulated soap stock, for use in animal feed, biodiesel, and soaps. This approach not only reduces environmental impact but also enhances resource utilization, aligning with global environmental objectives and offering a competitive advantage for market participants.- For instance, Wilmar International recycles over 800,000 metric tons of soap stock annually, integrating it into downstream feed and biofuel production streams.
Expansion into Emerging Markets
The growing livestock and biofuel sectors in emerging economies create significant opportunities for market expansion. Regions such as Asia Pacific and Latin America experience heightened demand for cost-effective feed and biofuel inputs, driven by population growth and government support for agricultural modernization. Market players investing in local partnerships and distribution networks stand to benefit from the rising adoption of acidulated soap stock in these high-potential markets.- For instance, Bunge Limited operates 12 oilseed processing facilities across Brazil, supplying acidulated soap stock to both local feed producers and biodiesel plants.
Key Challenges
Quality Variability and Standardization Issues
One major challenge in the Acidulated Soap Stock market lies in the inconsistent quality and composition of the product, which varies by source and processing method. This variability complicates standardization and poses concerns for feed formulators and industrial users who require reliable specifications. Ensuring consistent quality remains critical for building trust and fostering broader adoption across diverse end-use applications.Regulatory and Safety Concerns
Regulatory scrutiny over animal feed and biofuel ingredients introduces compliance challenges for acidulated soap stock suppliers. Stringent regulations governing permissible impurities, labeling, and traceability raise barriers for market entry, particularly in regions with strict quality controls. Suppliers must continually invest in quality assurance and compliance systems to navigate these regulatory landscapes and mitigate risks.Competition from Alternative Feedstocks
The Acidulated Soap Stock market faces competition from other low-cost feedstocks, such as used cooking oil, tallow, and other vegetable oil by-products. These alternatives offer similar functional benefits and are sometimes preferred due to regional availability or regulatory incentives. The presence of substitute raw materials requires acidulated soap stock suppliers to differentiate on quality, price, and reliability to maintain market share.Regional Analysis
North America: North America captured 18.6% of the global Acidulated Soap Stock market in 2024, with a value of USD 131.74 million, up from USD 95.37 million in 2018. The market is projected to reach USD 189.32 million by 2032, reflecting a CAGR of 4.6%. Strong demand from animal feed and biodiesel sectors, especially in the United States, supports this region’s growth. Continued innovation in feed formulations and investments in renewable energy projects enhance North America’s competitive position within the global market. Europe: Europe accounted for 23.0% of the global market in 2024, valued at USD 162.66 million, compared to USD 120.20 million in 2018. Forecasts indicate a rise to USD 227.11 million by 2032, with a CAGR of 4.2%. The region benefits from mature animal feed and biofuel industries, coupled with advanced circular economy policies. Major markets such as Germany, France, and the UK drive high adoption of acidulated soap stock, emphasizing sustainable resource use and environmental compliance. Asia Pacific: Asia Pacific dominated with a 31.4% market share in 2024, holding USD 222.87 million, rising from USD 152.90 million in 2018. The region is expected to achieve USD 343.14 million by 2032, registering the highest CAGR at 5.5%. Fast-expanding livestock and biodiesel industries in China, India, and Southeast Asia underpin this growth. Rising populations, policy support for sustainable agriculture, and rapid industrialization make Asia Pacific the leading contributor to global market revenue. Latin America: Latin America represented 7.1% of the global Acidulated Soap Stock market in 2024, with revenue reaching USD 50.65 million, up from USD 38.34 million in 2018. The market is anticipated to total USD 68.23 million by 2032, growing at a CAGR of 3.8%. Regional demand is driven by developing livestock and biofuel sectors, particularly in Brazil and Argentina. Opportunities for growth continue to emerge from agricultural modernization, despite some dependence on imports and evolving processing infrastructure. Middle East: The Middle East accounted for 10.9% of the market share in 2024, posting USD 77.83 million, compared to USD 54.18 million in 2018. The market should reach USD 117.68 million by 2032 at a CAGR of 5.3%. Strong investment in livestock and poultry production, especially in Saudi Arabia and the UAE, drives regional demand. National policies prioritizing food security and sustainable feed solutions further bolster market prospects for acidulated soap stock. Africa: Africa held 8.9% of the global market in 2024, with a value of USD 62.88 million, increasing from USD 46.82 million in 2018. The market is projected to reach USD 86.82 million by 2032, at a CAGR of 4.1%. The region’s market share reflects growing interest in cost-effective animal feed and biofuel applications, particularly in Nigeria and South Africa. Efforts to enhance agricultural productivity and develop processing capacity underpin future growth potential for acidulated soap stock across Africa.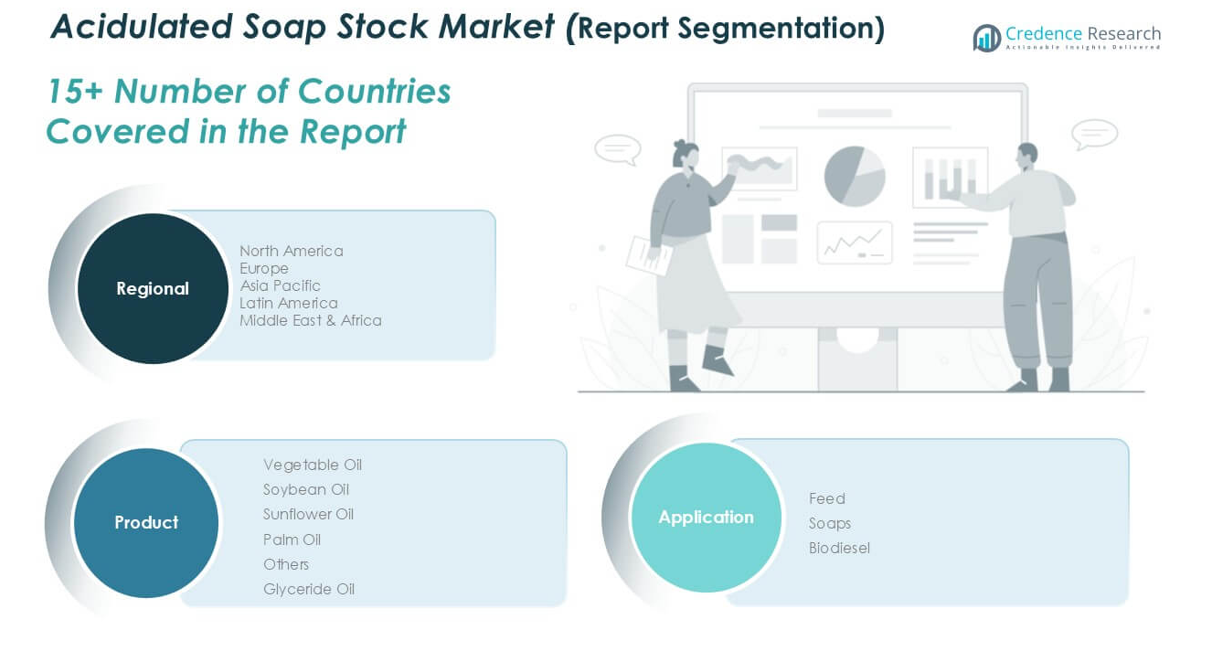
Market Segmentations:
By Product Type:- Vegetable Oil
- Soybean Oil
- Sunflower Oil
- Palm Oil
- Others
- Glyceride Oil
- Feed
- Soaps
- Biodiesel
- North America
- U.S.
- Canada
- Mexico
- Europe
- Germany
- France
- U.K.
- Italy
- Spain
- Rest of Europe
- Asia Pacific
- China
- Japan
- India
- South Korea
- South-east Asia
- Rest of Asia Pacific
- Latin America
- Brazil
- Argentina
- Rest of Latin America
- Middle East & Africa
- GCC Countries
- South Africa
- Rest of the Middle East and Africa
Competitive Landscape
The competitive landscape of the Acidulated Soap Stock market features a mix of multinational corporations and regional players, with key participants such as Archer Daniels Midland Company, Cargill, Incorporated, Nutreco N.V., FFM Berhad, Bunge Limited, SEMO Milling, LLC, Wilmar International Limited, Louis Dreyfus Company, IOI Loders Croklaan, and Aveno NV. These companies leverage extensive raw material sourcing capabilities, integrated supply chains, and diversified product portfolios to maintain a strong market position. Strategic initiatives focus on expanding production capacity, forging local partnerships, and enhancing R&D for process efficiency and product quality. Leading players also invest in sustainable sourcing and value-added by-products to align with evolving regulatory and consumer demands. Competitive rivalry remains moderate to high, as companies seek to differentiate through price, quality, and service reliability. The market’s fragmented nature creates opportunities for regional firms to capture niche segments while global leaders consolidate their presence through mergers, acquisitions, and expansion into emerging markets.Key Player Analysis
- Archer Daniels Midland Company
- Cargill, Incorporated
- Nutreco N.V.
- FFM Berhad
- Bunge Limited
- SEMO Milling, LLC
- Wilmar International Limited
- Louis Dreyfus Company
- IOI Loders Croklaan
- Aveno NV
Recent Developments
- In August 2022, LDC (Louis Dreyfus Company) opened a new soy liquid lecithin plant in Claypool, Indiana, integrating soybean processing, biodiesel production, and glycerin. This integration suggests a comprehensive approach to maximizing value from soybean processing byproducts, which would include acidulated soap stock generated from the refining process.
Market Concentration & Characteristics
The Acidulated Soap Stock Market displays a moderately fragmented structure, characterized by the presence of both global conglomerates and a range of regional suppliers. It features low to moderate market concentration, with leading companies such as Archer Daniels Midland, Cargill, and Wilmar International leveraging their vertical integration, extensive distribution networks, and strong sourcing capabilities to secure a competitive edge. Smaller regional firms focus on niche applications and local customer bases, benefitting from their agility and adaptability. The market’s dynamics reflect intense price competition, product differentiation, and a growing emphasis on sustainability and value-added by-products. Barriers to entry remain moderate, shaped by requirements for quality assurance, regulatory compliance, and technical expertise in refining processes. It benefits from stable demand in feed and biofuel sectors, while ongoing innovation in processing technologies and evolving consumer preferences for cost-effective, sustainable ingredients continue to shape market strategies. The diverse end-use landscape offers room for specialized players to capture growth opportunities.Report Coverage
The research report offers an in-depth analysis based on Product Type, Application, and Geography. It details leading market players, providing an overview of their business, product offerings, investments, revenue streams, and key applications. Additionally, the report includes insights into the competitive environment, SWOT analysis, current market trends, as well as the primary drivers and constraints. Furthermore, it discusses various factors that have driven market expansion in recent years. The report also explores market dynamics, regulatory scenarios, and technological advancements that are shaping the industry. It assesses the impact of external factors and global economic changes on market growth. Lastly, it provides strategic recommendations for new entrants and established companies to navigate the complexities of the market.Future Outlook
- The demand for acidulated soap stock is expected to rise due to its growing use in animal feed as a cost-effective energy source.
- Expansion in the biodiesel industry will support market growth, as acidulated soap stock serves as a crucial feedstock.
- Increased focus on sustainable and circular economy practices is encouraging the use of by-products like acidulated soap stock.
- Emerging economies are likely to present new growth opportunities due to rising demand for livestock nutrition products.
- The oleochemical sector is projected to boost demand for acidulated soap stock in surfactants and detergents production.
- Advancements in processing technologies are improving the quality and usability of acidulated soap stock across applications.
- Regulatory support for waste reduction and by-product utilization is positively impacting market dynamics.
- Fluctuations in raw material availability and prices may pose a challenge to consistent market expansion.
- Strategic partnerships between soap manufacturers and biodiesel producers are expected to strengthen the supply chain.
- Rising awareness among industries about low-cost raw material alternatives is expected to enhance market penetration.
Request a Free Sample
Fill in your details and we'll send you a free sample report.
- Sample data tables & charts
- Research methodology
Need a Custom Version of This Report?
Tailor the scope, geography, or segments to your exact requirements.
- Custom geography or segment scope
- Direct access to our analyst team
Frequently Asked Questions
What is the current size of the Acidulated Soap Stock Market?
What factors are driving the growth of the Acidulated Soap Stock Market?
What are some challenges faced by the Acidulated Soap Stock Market?
Who are the major players in the Acidulated Soap Stock Market?
Who are the major players in this market?
Table of Content
Chapter 1. Report Introduction
- 1.1 Report Description & Purpose
- 1.1.1 Report Title & Market Definition
- 1.1.2 Unique Selling Propositions (USP) & Key Differentiators
- 1.1.3 Value Proposition for Stakeholders
- 1.2 Research Objectives
- 1.2.1 Market Sizing Objectives (Volume & Revenue)
- 1.2.2 Segmentation Objectives
- 1.2.3 Competitive Intelligence Objectives
- 1.2.4 Forecast & Scenario Objectives
- 1.3 Report Scope
- 1.3.1 Acidulated Soap Stock Scope – Types & Subtypes Covered
- 1.3.2 Geographic Scope – Regions & Countries Covered
- 1.3.3 Historical Period, Base Year & Forecast Period (2024; forecast to 2032)
- 1.3.4 Inclusions & Exclusions
- 1.4 HS Code & Classification Framework
- 1.5 Currency, Units & Pricing Basis
- 1.6 Target Stakeholders
- 1.7 Limitations & Assumptions
Chapter 2. Executive Summary
- 2.1 Global Acidulated Soap Stock Market Snapshot
- 2.1.1 Market Size – Historical (2024) & Forecast (2024-2032) (2024: USD 708.6 million → 2032: USD 1,032.3 million)
- 2.1.2 Volume & Revenue – Global Totals
- 2.1.3 Key Market Highlights – Top Five Facts
- 2.2 Acidulated Soap Stock Market Segmentation Snapshot
- 2.2.1 Market Split by Region – 2024 vs. 2032
- 2.3 Competitive Snapshot
- 2.3.1 Top 10 Players by Revenue Share – 2024
- 2.3.2 Top 10 Players by Volume Share – 2024
- 2.3.3 Recent Strategic Developments (18-Month Summary)
- 2.4 Key Investment Highlights & Strategic Conclusions
Chapter 3. Acidulated Soap Stock Market Dynamics & Industry Analysis
- 3.1 Market Overview & Context
- 3.1.1 Acidulated Soap Stock Market Position in the Broader Automotive Value Chain
- 3.1.2 OEM vs. Replacement Market Dynamics
- 3.1.3 Market Maturity & Development Stage by Region
- 3.2 Acidulated Soap Stock Market Drivers
- 3.3 Acidulated Soap Stock Market Restraints & Challenges
- 3.4 Acidulated Soap Stock Market Opportunities
- 3.5 Porter's Five Forces Analysis
- 3.5.1 Threat of New Entrants
- 3.5.2 Bargaining Power of Suppliers
- 3.5.3 Bargaining Power of Buyers
- 3.5.4 Threat of Substitutes
- 3.5.5 Competitive Rivalry – Intensity Assessment
- 3.6 Acidulated Soap Stock Value Chain Analysis
- 3.6.1 Upstream – Raw Material/Input Suppliers
- 3.6.1.1 Raw Material/Input 1
- 3.6.1.2 Raw Material/Input 2
- 3.6.1.3 Raw Material/Input 3
- 3.6.2 Midstream – Production/Manufacturing/Service Delivery
- 3.6.2.1 Production/Process Overview
- 3.6.2.2 Key Facility Locations & Capacity by Manufacturer
- 3.6.3 Downstream – Distribution & End Consumer
- 3.6.3.1 Primary Channel – B2B/OEM
- 3.6.3.2 Secondary Channels – Dealer, Retail, Online, Direct
- 3.6.4 Value Chain Profitability Analysis
- 3.6.1 Upstream – Raw Material/Input Suppliers
- 3.7 PESTEL Analysis
- 3.7.1 Political Factors
- 3.7.2 Economic Factors
- 3.7.3 Social Factors
- 3.7.4 Technological Factors
- 3.7.5 Environmental Factors
- 3.7.6 Legal Factors
- 3.8 Acidulated Soap Stock Supply Chain Analysis
- 3.8.1 Raw Material/Input Supply Risk Assessment
- 3.8.2 Manufacturing Concentration Risk (Geographic Exposure)
- 3.8.3 Trade Disruption Impact Analysis
- 3.9 Regulatory & Policy Landscape
Note: The regulatory and policy landscape section covers regulations based on their applicability to the market, Acidulated Soap Stock category, geography, and scope of the study. Only regulatory frameworks with a material impact on operations, compliance, trade, sustainability, or market access are analyzed in detail.
Chapter 4. Key Investment Pockets & Opportunity Analysis
- 4.1 Acidulated Soap Stock Market Attractiveness Analysis
- 4.1.1 By Region – Investment Attractiveness Matrix (Volume × CAGR)
- 4.2 Absolute Revenue Growth Opportunity
- 4.2.1 By Region – Absolute USD Growth Through 2032
- 4.3 Incremental Volume Opportunity
- 4.3.1 By Region – Incremental Volume Through 2032
- 4.3.2 Segment – Incremental Volume
- 4.4 Emerging Submarket Opportunity Deep Dive (Subject to Applicability)
- 4.5 Emerging Market Opportunity Scorecards
- 4.5.1 United States
- 4.5.2 Europe
- 4.5.3 Asia
- 4.5.4 Middle East & Africa
Note: Emerging Market Opportunity Scorecards will be included based on relevance and strategic importance. Regions listed are indicative and may vary depending on data availability and market dynamics.
Chapter 5. Acidulated Soap Stock Import-Export Analysis & Trade Flows
- 5.1 Global Trade Overview
- 5.1.1 Global Export Value by Country (2024)
- 5.1.2 Global Export Volume by Country (2024)
- 5.1.3 Global Import Value by Country (2024)
- 5.1.4 Global Import Volume by Country (2024)
- 5.1.5 Net Trade Balance by Country (2024)
- 5.2 Export Analysis – Segment
- 5.2.1 Type 1 (HS Code)
- 5.2.2 Type 2 (HS Code)
- 5.2.3 Type 3 (HS Code)
- 5.2.4 Type 4 (HS Code)
- 5.2.5 Type 5 (HS Code)
- 5.3 Import Analysis – Segment
- 5.3.1 Type 1 (HS Code)
- 5.3.2 Type 2 (HS Code)
- 5.3.3 Type 3 (HS Code)
- 5.3.4 Type 4 (HS Code)
- 5.3.5 Type 5 (HS Code)
- 5.4 Average Unit Trade Prices
- 5.4.1 Average Export Price – Segment & Country
- 5.4.2 Average Import Price – Segment & Source Country
- 5.4.3 Price Trends (2024)
- 5.5 Key Trade Route Analysis
- 5.5.1 Trade Route 1
- 5.5.2 Trade Route 2
- 5.5.3 Trade Route 3
- 5.5.4 Trade Route 4
- 5.5.5 Trade Route 5
- 5.6 Trade Policy Impact Assessment
- 5.6.1 US Anti-Dumping & Section 301 Tariffs
- 5.6.2 EU Customs Union Impact
- 5.6.3 Major Free Trade Agreements
- 5.6.4 USMCA Rules of Origin
Note: Trade policy analysis will be included only where relevant to the Acidulated Soap Stock market.
Chapter 6. Competitive Landscape & Company Benchmarking
- 6.1 Acidulated Soap Stock Market Concentration & Structure
- 6.1.1 Herfindahl-Hirschman Index (HHI) – vs. 2024
- 6.1.2 Tier 1, Tier 2 & Tier 3 Market Structure
- 6.1.3 Global, Regional & Local Player Dynamics
- 6.2 Acidulated Soap Stock Market Share Analysis – 2024
- 6.2.1 Global Revenue Share by Company
- 6.2.2 Global Volume Share by Company
- 6.2.3 Regional Revenue Share
- 6.2.4 Market Share Evolution ( vs. 2024)
- 6.2.5 OEM Segment Share by Company
- 6.2.6 Replacement Segment Share by Company
- 6.3 Production/Delivery Capacity & Facility Analysis
- 6.3.1 Global Installed Capacity
- 6.3.2 Capacity Utilization Rates
- 6.3.3 Production/Output Volume
- 6.3.4 Facility Locations & Capacity Map
- 6.3.5 Planned Capacity Additions
- 6.4 Acidulated Soap Stock Competitive Benchmarking Matrix
- 6.4.1 Revenue, Volume, CAGR & Profitability Comparison
- 6.4.2 Channel Revenue Mix
- 6.4.3 Geographic Revenue Exposure
- 6.4.4 R&D Intensity
- 6.4.5 Sustainability Maturity
- 6.5 Strategic Developments in Acidulated Soap Stock (Last 24 Months)
- 6.5.1 Mergers, Acquisitions & Divestments
- 6.5.2 New Acidulated Soap Stock Launches
- 6.5.3 Facility Expansions
- 6.5.4 Strategic Alliances, Joint Ventures & Partnerships
- 6.5.5 Distribution Expansion & Market Entry
- 6.5.6 Sustainability & ESG Initiatives
- 6.6 Competitive Strategy Mapping
- 6.6.1 Leader, Challenger, Follower & Niche Classification
- 6.6.2 Pricing Strategy Comparison
- 6.6.3 Channel Strategy Matrix
Note: Strategic developments are included based on their materiality and the availability of reliable information.
Chapter 7. Global Acidulated Soap Stock Market – By Distribution Channel
- 7.1 Segment Overview
- 7.1.1 Volume & Revenue Split by Channel (2024 & 2032)
- 7.1.2 Channel Mix Evolution (2024-2032)
Chapter 8. Regional Market Analysis – Global Overview
- 8.1 Global Regional Overview
- 8.1.1 Regional Volume Share
- 8.1.2 Regional Revenue Share
- 8.1.3 Regional Volume by Region
- 8.1.4 Regional Revenue by Region
- 8.1.5 Regional Forecast Through 2032
- 8.2 Cross-Regional Segment Analysis
- 8.2.1 By Distribution Channel
- 8.2.2 By Brand/Price Tier
Chapter 9. North America Acidulated Soap Stock Market
- 9.1 United States
- 9.2 Canada
- 9.3 Mexico
Chapter 10. Europe Acidulated Soap Stock Market
- 10.1 Germany
- 10.2 France
- 10.3 Italy
- 10.4 United Kingdom
- 10.5 Spain
- 10.6 Poland
- 10.7 Russia
- 10.8 Netherlands
- 10.9 Belgium
- 10.10 Sweden
- 10.11 Denmark
- 10.12 Norway
- 10.13 Rest of Europe
Chapter 11. Asia Pacific Acidulated Soap Stock Market
- 11.1 China
- 11.2 India
- 11.3 Japan
- 11.4 South Korea
- 11.5 Thailand
- 11.6 Indonesia
- 11.7 Vietnam
- 11.8 Malaysia
- 11.9 Australia
- 11.10 Rest of Asia Pacific
Chapter 12. Latin America Acidulated Soap Stock Market
- 12.1 Brazil
- 12.2 Argentina
- 12.3 Colombia
- 12.4 Chile
- 12.5 Rest of Latin America
Chapter 13. Middle East Acidulated Soap Stock Market
- 13.1 Saudi Arabia
- 13.2 United Arab Emirates
- 13.3 Turkey
- 13.4 Israel
- 13.5 Iran
- 13.6 Rest of the Middle East
Chapter 14. Africa Acidulated Soap Stock Market
- 14.1 South Africa
- 14.2 Egypt
- 14.3 Nigeria
- 14.4 Morocco
- 14.5 Rest of Africa
Chapter 15. Acidulated Soap Stock Company Profiles
- 15.1 [Company 01]
- 15.1.1 Company Overview
- 15.1.2 Key Management Personnel
- 15.1.3 Products & Services Portfolio
- 15.1.4 Financial Performance
- 15.1.5 Key Market Focus & Geographic Presence
- 15.1.6 Recent Developments & Strategic Initiatives
Note: The company profile list is preliminary and may change based on research findings, market developments, data availability, and client requirements.
Chapter 16. Appendices
- Appendix A – List of Abbreviations & Acronyms
- Appendix B – Industry Classification Code Reference – Full Series
- Appendix C – Production & Capacity Data Tables
- Appendix D – End-Use & Demand Base Tables
- Appendix E – Consumption & Replacement Rate Assumptions
- Appendix F – ASP Reference Tables
- Appendix G – Manufacturing & Facility Database
- Appendix H – Import-Export Data Tables
- Appendix I – Regulatory Summary Tables
- Appendix J – Primary Research Participant List (Anonymized)
- Appendix K – Primary Research Questionnaire Framework
- Appendix L – Data Sources & Bibliography
- Appendix M – Market Size Divergence & Source Comparison
Chapter 17. Research Methodology
- 17.1 Research Framework & Philosophy
- 17.2 Secondary Research – Sources, Hierarchy & Data Extraction
- 17.3 Data Modeling – Bottom-Up & Top-Down Market Sizing
- 17.4 Primary Research – Stakeholder Framework, LOI & Sample Sizes
- 17.5 Forecast Methodology – Regression, Scenario & Sensitivity Analysis
- 17.6 Quality Control – Four-Layer Validation Framework
- 17.7 Limitations & Standard Assumptions
- 17.8 Disclaimer
