Home » Healthcare » Active Pharmaceutical Ingredient CDMO Market

Active Pharmaceutical Ingredient CDMO Market By Product (Traditional Active Pharmaceutical Workflow, Highly Potent Active Pharmaceutical Workflow, Antibody Drug Conjugate, Others); By Service Type (Contract Development [Custom Synthesis, Process Development, Scale-up, Analytical Services, Others], Contract Manufacturing [Commercial-Scale API Production, Process Optimization, Others]); By API Type (Synthetic APIs, Biotech APIs); By Workflow (Clinical, Commercial); By Therapeutic Area (Oncology, Hormonal, Glaucoma, Cardiovascular Disease, Diabetes, Others); By Region – Growth, Share, Opportunities & Competitive Analysis, 2024 – 2032

Report ID: 115307 | Report Format : Excel, PDF

Market Overview

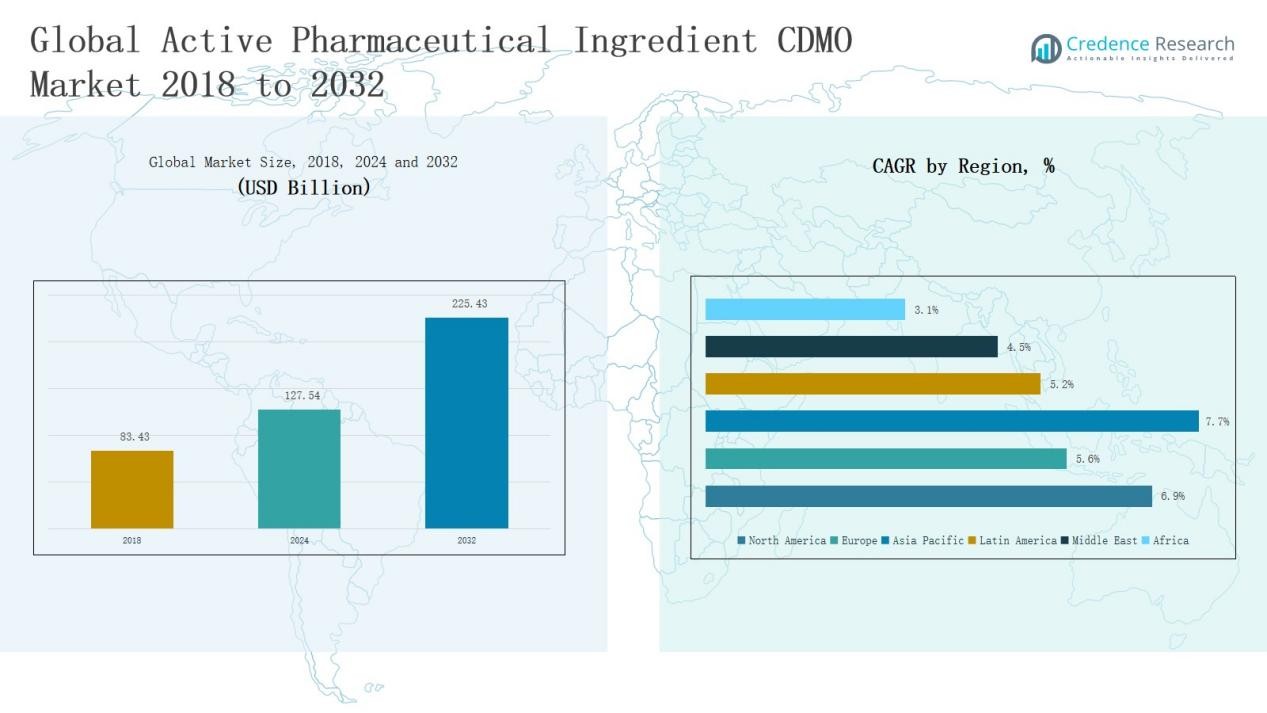
Active Pharmaceutical Ingredient CDMO Market size was valued at USD 83.43 million in 2018 to USD 127.54 million in 2024 and is anticipated to reach USD 225.43 million by 2032, at a CAGR of 6.87% during the forecast period.

REPORT ATTRIBUTE DETAILS
Historical Period 2020-2024
Base Year 2024
Forecast Period 2025-2032
Active Pharmaceutical Ingredient (API) CDMO Market Size 2024 USD 127.54 Million
Active Pharmaceutical Ingredient (API) CDMO Market, CAGR  6.87%
Active Pharmaceutical Ingredient (API) CDMO Market Size 2032 USD 225.43 Million


The Active Pharmaceutical Ingredient (API) CDMO Market is shaped by global leaders such as Thermo Fisher Scientific, Lonza, Catalent, Samsung Biologics, CordenPharma, Cambrex, Recipharm, Siegfried, WuXi AppTec, and Piramal Pharma Solutions. These companies dominate through extensive manufacturing capacity, advanced R&D capabilities, and expertise in highly potent and complex molecules, including biologics, peptides, and antibody drug conjugates. Strategic mergers, global partnerships, and investments in specialized facilities further strengthen their competitive positions. Regionally, Asia Pacific led the market in 2024 with a 37% share, driven by cost-efficient production, strong government support in India and China, and rapid expansion of biomanufacturing hubs.

Access crucial information at unmatched prices!

Request your sample report today & start making informed decisions powered by Credence Research Inc.!

Download Sample

Market Insights

  • The Active Pharmaceutical Ingredient CDMO Market grew from USD 83.43 million in 2018 to USD 127.54 million in 2024, projected to reach USD 225.43 million by 2032.
  • Traditional APIs led with 47% share in 2024, supported by generics demand, cost efficiency, and established large-scale synthesis methods, while HP-APIs and ADCs are expanding rapidly.
  • Contract Development held 55% share in 2024, with process development leading at 22%, while Commercial-Scale API Production dominated Contract Manufacturing at 45% market contribution.
  • Synthetic APIs dominated with 62% share in 2024, driven by cost-effective production, while Biotech APIs (38%) grew quickly with biologics approvals and rising demand for advanced therapies.
  • Asia Pacific led with 37% share in 2024, followed by North America at 32% and Europe at 20%, while Latin America, Middle East, and Africa accounted for smaller contributions.
Market Segment Insights

By Product

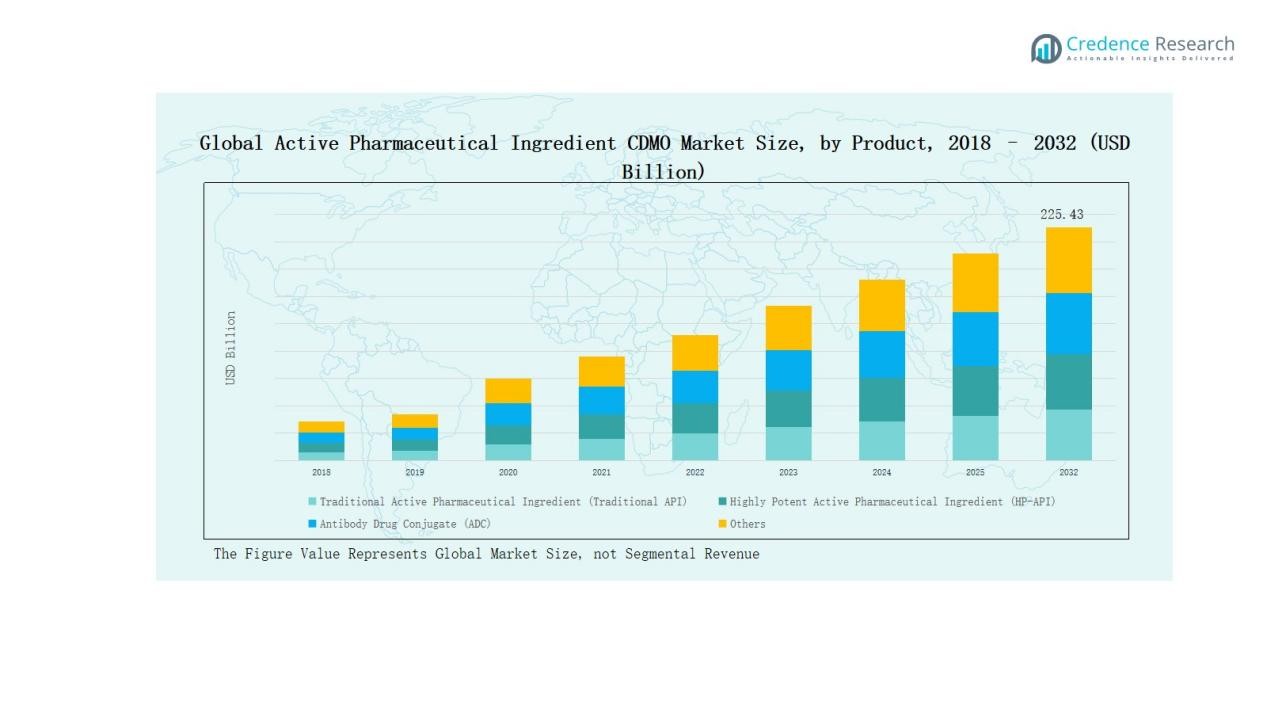
Traditional Active Pharmaceutical Workflow (Traditional API) dominated the market with a 47% share in 2024, driven by strong demand for generic medicines and established synthesis methods. Cost efficiency, wide therapeutic applicability, and large-scale production capabilities reinforce its leadership. HP-APIs are growing steadily, supported by rising oncology and hormonal therapies. Antibody Drug Conjugates (ADCs) are expanding quickly, fueled by targeted cancer treatment demand and high investment in bioconjugation technologies. The “Others” category, though smaller, includes niche and emerging molecules, supported by growing pipeline diversification.

  • For instance, Teva’s operations, the company recently announced plans to divest its Teva API (TAPI) unit, its small-molecule active pharmaceutical ingredient business, to better focus on its core portfolio of over 3,500 generic and specialty medicines.

By Service Type

Contract Development led the market with a 55% share in 2024, supported by pharmaceutical firms outsourcing early-stage development for cost and speed advantages. Within this, Process Development accounted for the largest portion at 22%, driven by the need for scalable and regulatory-compliant workflows. Custom synthesis also holds strong adoption, enabling companies to secure unique APIs with IP protection. Analytical services are increasingly critical, supported by stringent regulatory guidelines. Contract Manufacturing, though slightly smaller at 45%, remains vital, with Commercial-Scale API Production dominating due to consistent demand for large-volume supply.

  • For instance, Catalent introduced advanced analytical platforms in 2024 for biologics characterization, aligning with FDA and EMA expectations for more comprehensive product release testing.

By API Type

Synthetic APIs remained the dominant segment with a 62% share in 2024, reflecting strong reliance on chemical synthesis for both generic and branded drugs. Their cost-effectiveness, established manufacturing protocols, and scalability drive continued leadership. Biotech APIs, including biologics, peptides, and oligonucleotides, held a 38% share, expanding rapidly due to rising biologics approvals, growth in precision medicine, and increasing demand for advanced therapies. The biotech segment is expected to close the gap, supported by ongoing innovation in complex molecules and investments in biomanufacturing facilities.
Active Pharmaceutical Ingredient CDMO Market Size

Key Growth Drivers

Rising Outsourcing of API Production

Pharmaceutical companies increasingly outsource API production to CDMOs, enabling them to focus on drug discovery and commercialization. CDMOs provide cost savings, flexible manufacturing, and regulatory compliance, making outsourcing a strategic choice. The growing complexity of drug molecules also drives reliance on specialized expertise. This trend is particularly strong among mid-sized pharma firms that lack large-scale manufacturing capacity, reinforcing CDMOs’ role as key partners in meeting rising global API demand across therapeutic areas.

  • For instance, Axplora, a CDMO that ensures API quality and supply chain security by auditing its ingredient suppliers rigorously and embedding quality into every operational aspect to meet pharma companies’ demands for reliability and regulatory compliance.

Growing Demand for Highly Potent APIs (HP-APIs)

The surge in oncology and hormonal therapies boosts demand for HP-APIs, which require advanced containment and specialized facilities. CDMOs investing in high-containment infrastructure are gaining significant contracts from both large and small pharma companies. With rising cancer incidence and the shift toward targeted therapies, HP-APIs are projected to record strong double-digit growth. This demand not only drives revenue but also pushes CDMOs to expand capabilities in cytotoxic handling, high-potency formulation, and compliance with stringent global safety standards.

  • For instance, in 2022, Catalent expanded its nasal drug development and manufacturing capabilities at its Morrisville, North Carolina facility. Separately, it completed a $10 million expansion of its highly potent micronization capabilities at its facilities in Malvern, Pennsylvania, and Dartford, U.K.

Expansion of Biotech and Complex Molecules

The increasing adoption of biologics, peptides, and oligonucleotides is fueling growth in biotech APIs. CDMOs are investing in advanced biomanufacturing and analytical platforms to cater to this demand. Regulatory approvals for biologics are rising, further accelerating CDMO engagement in biotech projects. As precision medicine and RNA-based therapies expand, CDMOs with expertise in complex molecules are positioned to capture higher-value contracts. This shift toward innovation-driven molecules provides long-term growth opportunities and diversifies revenue streams for the API CDMO industry.

Key Trends & Opportunities

Growth of Antibody Drug Conjugates (ADCs)

ADCs are gaining momentum as a promising class of targeted therapies, particularly in oncology. CDMOs specializing in conjugation chemistry and biomanufacturing are securing major contracts from global pharma firms. Rising investment in ADC R&D, coupled with expanding pipelines, creates strong outsourcing opportunities. CDMOs with dual expertise in biologics and cytotoxic payloads are positioned at the forefront of this trend. This focus on targeted therapies provides significant growth opportunities while also diversifying the service portfolio beyond traditional APIs.

  • FOr instance, Thermo Fisher Scientific, which offers integrated end-to-end development and manufacturing services, accelerating ADC clinical and commercial supply.

Regional Expansion and Emerging Markets

Emerging markets such as Asia-Pacific and Latin America are becoming attractive for API outsourcing due to cost advantages and expanding healthcare infrastructure. CDMOs are investing in regional manufacturing hubs to tap into growing local demand. Governments in countries like India and China are also promoting domestic production through favorable policies. This regional expansion not only reduces supply chain risks for pharma companies but also positions CDMOs closer to high-growth therapeutic markets, improving competitiveness in global supply networks.

  • For instance, Lonza opened a new API manufacturing suite in Guangzhou, China in 2022, strengthening its footprint in the Asia-Pacific region to better serve multinational drug developers working on small molecules.

Key Challenges

Stringent Regulatory Compliance

API CDMOs must comply with rigorous regulatory requirements from authorities such as the FDA, EMA, and PMDA. Meeting global quality standards across multiple markets requires significant investment in documentation, audits, and validation processes. Non-compliance risks costly delays, fines, and loss of client trust. Smaller CDMOs often face higher pressure due to limited resources. Maintaining continuous compliance while scaling operations remains a major challenge that can slow expansion and increase operational costs in a competitive market.

Pricing Pressure and Margin Constraints

CDMOs face constant pricing pressure from pharmaceutical companies seeking to reduce development and manufacturing costs. While outsourcing demand is strong, the competition among CDMOs keeps margins thin. Large CDMOs with economies of scale often dominate contracts, making it difficult for smaller players to compete on pricing. Furthermore, the high cost of infrastructure upgrades, technology adoption, and compliance intensifies financial strain. Sustaining profitability while offering competitive pricing remains a key challenge for the industry.

Supply Chain Disruptions and Dependency Risks

Global supply chains for raw materials and intermediates are increasingly vulnerable to disruptions, as highlighted during the COVID-19 pandemic. Heavy reliance on specific regions, such as China and India, for critical inputs exposes CDMOs to risk. Geopolitical tensions, logistics delays, or raw material shortages can disrupt production timelines and impact client deliveries. Ensuring resilient supply chains through diversification and strategic partnerships is critical, yet it remains a significant challenge for maintaining consistent API output.
Active Pharmaceutical In gredient CDMO Market Segmentation

Regional Analysis

North America

North America held a 32% share of the global API CDMO market in 2024, supported by advanced pharmaceutical infrastructure, strong R&D spending, and high outsourcing adoption by major pharma companies. The region generated USD 35.81 billion in 2024, projected to reach USD 63.57 billion by 2032, growing at a CAGR of 6.9%. The United States dominates, driven by biologics approvals, oncology drug demand, and FDA-compliant manufacturing facilities. Strategic investments in high-potency and biotech APIs further reinforce North America’s leadership, positioning the region as a key hub for innovation-driven API outsourcing.

Europe

Europe accounted for 20% of the market in 2024, reaching USD 22.59 billion, and is projected to grow to USD 36.32 billion by 2032 at a CAGR of 5.6%. The region benefits from strong regulatory standards, advanced manufacturing clusters in Germany, Switzerland, and the UK, and a high concentration of CDMOs with biologics expertise. European companies are increasingly outsourcing to optimize costs while maintaining compliance with EMA requirements. The region’s focus on oncology, rare diseases, and HP-API production continues to drive steady growth, though competition from Asia-Pacific impacts pricing dynamics.

Asia Pacific

Asia Pacific emerged as the largest regional market with a 37% share in 2024, valued at USD 58.33 billion, and is projected to grow to USD 109.34 billion by 2032 at a CAGR of 7.7%. The region’s leadership is driven by cost-effective manufacturing, expanding domestic demand, and strong government initiatives in India and China to promote API production. Japan and South Korea also contribute significantly with biotech and peptide API development. Availability of skilled labor, favorable policies, and rapid expansion of biomanufacturing facilities make Asia Pacific the fastest-growing hub for global API outsourcing.

Latin America

Latin America represented a 4% share of the global market in 2024, reaching USD 5.82 billion, and is forecast to reach USD 9.08 billion by 2032 at a CAGR of 5.2%. Brazil and Mexico lead the region due to growing pharmaceutical investments and rising generic drug demand. Increasing partnerships with multinational pharma firms are boosting contract development opportunities. However, limited infrastructure and high dependency on imports for intermediates constrain growth. Despite challenges, the region offers emerging opportunities, particularly in cost-sensitive segments and expansion of local manufacturing facilities.

Middle East

The Middle East contributed a 3% share in 2024, generating USD 3.18 billion, with expectations to reach USD 4.72 billion by 2032 at a CAGR of 4.5%. Growth is supported by rising investments in healthcare infrastructure, expansion of local pharma manufacturing, and government initiatives to reduce import dependency. GCC countries dominate the market, particularly Saudi Arabia and the UAE, which are developing specialized pharma hubs. However, the market remains relatively small compared to Asia-Pacific and North America, limiting its global influence but presenting niche outsourcing opportunities.

Africa

Africa accounted for the smallest share at 2% in 2024, generating USD 1.80 billion, and is projected to reach USD 2.40 billion by 2032 with a CAGR of 3.1%. The market is primarily concentrated in South Africa and Egypt, supported by government-led initiatives to expand local pharmaceutical production. Infrastructure challenges, limited R&D capabilities, and heavy reliance on imports hinder rapid growth. Despite these barriers, increasing focus on affordable generics and international partnerships could support modest expansion, making Africa a long-term opportunity for API CDMO players.

Active Pharmaceutical Ingredient CDMO Market Segmentation1

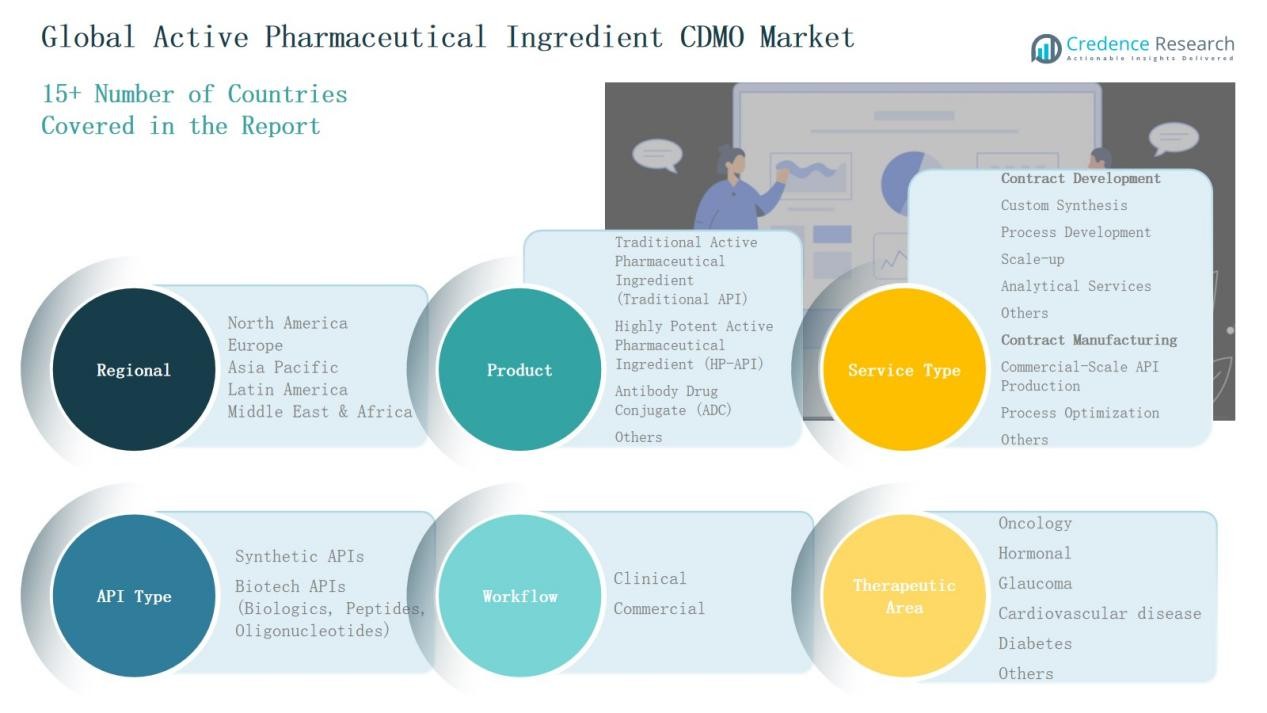
Market Segmentations:

By Product

  • Traditional Active Pharmaceutical Workflow (Traditional API)
  • Highly Potent Active Pharmaceutical Workflow (HP-API)
  • Antibody Drug Conjugate (ADC)
  • Others

By Service Type

Contract Development

  • Custom Synthesis
  • Process Development
  • Scale-up
  • Analytical Services
  • Others

Contract Manufacturing

  • Commercial-Scale API Production
  • Process Optimization
  • Others

By API Type

  • Synthetic APIs
  • Biotech APIs (Biologics, Peptides, Oligonucleotides)

By Workflow

  • Clinical
  • Commercial

By Therapeutic Area

  • Oncology
  • Hormonal
  • Glaucoma
  • Cardiovascular Disease
  • Diabetes
  • Others

By Region

  • North America (U.S., Canada, Mexico)
  • Europe (UK, France, Germany, Italy, Spain, Russia, Rest of Europe)
  • Asia Pacific (China, Japan, South Korea, India, Australia, Southeast Asia, Rest of APAC)
  • Latin America (Brazil, Argentina, Rest of Latin America)
  • Middle East (GCC Countries, Israel, Turkey, Rest of Middle East)
  • Africa (South Africa, Egypt, Rest of Africa)

Competitive Landscape

The Active Pharmaceutical Ingredient (API) CDMO market is highly competitive, shaped by global leaders and specialized regional firms. Major players such as Thermo Fisher Scientific, Lonza, Catalent, Samsung Biologics, and CordenPharma dominate with extensive manufacturing networks, advanced R&D capabilities, and regulatory expertise across multiple geographies. These companies focus on expanding high-potency and biologics capacities, while strengthening partnerships with large pharmaceutical and biotech firms. Mid-sized CDMOs, including Cambrex, Recipharm, Siegfried, Piramal Pharma Solutions, and WuXi AppTec, are gaining traction through niche expertise, flexible operations, and cost-efficient offerings. The market is witnessing consolidation, with mergers and acquisitions enhancing scale, service integration, and global reach. Competition is driven by technological innovation, compliance with stringent quality standards, and the ability to manage complex molecules such as HP-APIs, peptides, and antibody drug conjugates. Pricing pressure, supply chain resilience, and differentiated service portfolios remain key factors influencing market positioning and long-term competitiveness.

Shape Your Report to Specific Countries or Regions & Enjoy 30% Off!

Key Players

  • Thermo Fisher Scientific Inc. (Pantheon)
  • CordenPharma International
  • Samsung Biologics
  • Lonza
  • Catalent, Inc.
  • Cambrex Corporation
  • Recipharm AB
  • Siegfried Holding AG
  • WuXi AppTec
  • Piramal Pharma Solutions

Recent Developments

  • In May 2025, HAS Healthcare Advanced Synthesis SA completed the acquisition of Cerbios-Pharma SA, forming a top-tier global CDMO with expanded API, HP-API, and ADC capabilities.
  • In 2025, Zydus Lifesciences acquired Agenus Inc.’s biologics manufacturing facilities in California, marking its entry into the global biologics API CDMO sector.
  • In July 2025, Thermo Fisher Scientific expanded its partnership with Sanofi by acquiring Sanofi’s sterile manufacturing site in Ridgefield, New Jersey, to boost U.S. drug product capacity.
  • In July–August 2025, ESTEVE CDMO acquired Regis Technologies (US), expanding its API CDMO presence and capabilities across the drug development lifecycle.

Report Coverage

The research report offers an in-depth analysis based on Product, Service Type, API Type, Workflow, Therapeutic Area and Region. It details leading market players, providing an overview of their business, product offerings, investments, revenue streams, and key applications. Additionally, the report includes insights into the competitive environment, SWOT analysis, current market trends, as well as the primary drivers and constraints. Furthermore, it discusses various factors that have driven market expansion in recent years. The report also explores market dynamics, regulatory scenarios, and technological advancements that are shaping the industry. It assesses the impact of external factors and global economic changes on market growth. Lastly, it provides strategic recommendations for new entrants and established companies to navigate the complexities of the market.

Future Outlook

  1. Demand for outsourcing will continue to rise as pharma companies focus on core R&D.
  2. CDMOs will expand high-potency API capacity to meet growing oncology drug demand.
  3. Biologics, peptides, and oligonucleotides will gain higher share in outsourced projects.
  4. Investment in advanced containment and automation technologies will enhance production efficiency.
  5. Strategic mergers and acquisitions will accelerate to strengthen service portfolios and scale.
  6. Regional manufacturing hubs in Asia-Pacific will attract more global outsourcing contracts.
  7. Supply chain diversification will become a priority to reduce raw material dependency.
  8. Regulatory compliance and quality certifications will remain critical for winning global contracts.
  9. Growth in antibody drug conjugates will create new opportunities for specialized CDMOs.
  10. Digital technologies and data-driven process optimization will drive competitiveness in API production.

CHAPTER NO. 1: GENESIS OF THE MARKET
1.1 Market Prelude – Introduction & Scope
1.2 The Big Picture – Objectives & Vision
1.3 Strategic Edge – Unique Value Proposition
1.4 Stakeholder Compass – Key Beneficiaries
CHAPTER NO. 2: EXECUTIVE LENS
2.1 Pulse of the Industry – Market Snapshot
2.2 Growth Arc – Revenue Projections (USD Billion)
2.3. Premium Insights – Based on Primary Interviews
CHAPTER NO. 3: ACTIVE PHARMACEUTICAL INGREDIENT CDMO MARKET FORCES & INDUSTRY PULSE
3.1 Foundations of Change – Market Overview
3.2 Catalysts of Expansion – Key Market Drivers
3.2.1 Momentum Boosters – Growth Triggers
3.2.2 Innovation Fuel – Disruptive Technologies
3.3 Headwinds & Crosswinds – Market Restraints
3.3.1 Regulatory Tides – Compliance Challenges
3.3.2 Economic Frictions – Inflationary Pressures
3.4 Untapped Horizons – Growth Potential & Opportunities
3.5 Strategic Navigation – Industry Frameworks
3.5.1 Market Equilibrium – Porter’s Five Forces
3.5.2 Ecosystem Dynamics – Value Chain Analysis
3.5.3 Macro Forces – PESTEL Breakdown
3.6 Service Type Trend Analysis
3.6.1 Regional Service Type Trend
3.6.2 Service Type Trend by product
CHAPTER NO. 4: KEY INVESTMENT EPICENTER
4.1 Regional Goldmines – High-Growth Geographies
4.2 Product Frontiers – Lucrative Product Categories
4.3 Application Sweet Spots – Emerging Demand Segments
CHAPTER NO. 5: REVENUE TRAJECTORY & WEALTH MAPPING
5.1 Momentum Metrics – Forecast & Growth Curves
5.2 Regional Revenue Footprint – Market Share Insights
5.3 Segmental Wealth Flow – Product & Service Type Revenue
CHAPTER NO. 6: TRADE & COMMERCE ANALYSIS
6.1. Import Analysis by Region
6.1.1. Global Market Import Revenue By Region
6.2. Export Analysis by Region
6.2.1. Global Active Pharmaceutical Ingredient CDMO Market Export Revenue By Region
CHAPTER NO. 7: COMPETITION ANALYSIS
7.1. Company Market Share Analysis
7.1.1. Global Active Pharmaceutical Ingredient CDMO Market: Company Market Share
7.2. Global Active Pharmaceutical Ingredient CDMO Market Company Revenue Market Share
7.3. Strategic Developments
7.3.1. Acquisitions & Mergers
7.3.2. New Product Launch
7.3.3. Regional Expansion
7.4. Competitive Dashboard
7.5. Company Assessment Metrics, 2024
CHAPTER NO. 8: ACTIVE PHARMACEUTICAL INGREDIENT CDMO MARKET – BY PRODUCT SEGMENT ANALYSIS
8.1. Active Pharmaceutical Ingredient CDMO Market Overview by Product Segment
8.1.1. Active Pharmaceutical Ingredient CDMO Market Revenue Share By Product
8.2. Traditional Active Pharmaceutical Workflow (Traditional API)
8.3. Highly Potent Active Pharmaceutical Workflow (HP-API)
8.4. Antibody Drug Conjugate (ADC)
8.5. Others
CHAPTER NO. 9: ACTIVE PHARMACEUTICAL INGREDIENT CDMO MARKET – BY SERVICE TYPE SEGMENT ANALYSIS
9.1. Active Pharmaceutical Ingredient CDMO Market Overview by Service Type Segment
9.1.1. Active Pharmaceutical Ingredient CDMO Market Revenue Share By Service Type
9.2. Contract Development
9.2.1. Custom Synthesis
9.2.2. Process Development
9.2.3. Scale-up
9.2.4. Analytical Services
9.2.5. Others
9.3. Contract Manufacturing
9.3.1. Commercial-Scale API Production
9.3.2. Process Optimization
9.3.3. Others
CHAPTER NO. 10: ACTIVE PHARMACEUTICAL INGREDIENT CDMO MARKET – BY API TYPE SEGMENT ANALYSIS
10.1. Active Pharmaceutical Ingredient CDMO Market Overview by API Type Segment
10.1.1. Active Pharmaceutical Ingredient CDMO Market Revenue Share By API Type
10.2. Synthetic APIs
10.3. Biotech APIs (Biologics, Peptides, Oligonucleotides)
CHAPTER NO. 11: ACTIVE PHARMACEUTICAL INGREDIENT CDMO MARKET – BY WORKFLOW SEGMENT ANALYSIS
11.1. Active Pharmaceutical Ingredient CDMO Market Overview by Workflow Segment
11.1.1. Active Pharmaceutical Ingredient CDMO Market Revenue Share By Workflow
11.2. Clinical
11.3. Commercial
CHAPTER NO. 12: ACTIVE PHARMACEUTICAL INGREDIENT CDMO MARKET – BY THERAPEUTIC AREA SEGMENT ANALYSIS
12.1. Active Pharmaceutical Ingredient CDMO Market Overview by Therapeutic Area Segment
12.1.1. Active Pharmaceutical Ingredient CDMO Market Revenue Share By Therapeutic Area
12.2. Oncology
12.3. Hormonal
12.4. Glaucoma
12.5. Cardiovascular disease
12.6. Diabetes
12.7. Others
CHAPTER NO. 13: ACTIVE PHARMACEUTICAL INGREDIENT CDMO MARKET – REGIONAL ANALYSIS
13.1. Active Pharmaceutical Ingredient CDMO Market Overview by Region Segment
13.1.1. Global Active Pharmaceutical Ingredient CDMO Market Revenue Share By Region
13.1.2. Regions
13.1.3. Global Active Pharmaceutical Ingredient CDMO Market Revenue By Region
13.1.4. Product
13.1.5. Global Active Pharmaceutical Ingredient CDMO Market Revenue By Product
13.1.6. Service Type
13.1.7. Global Active Pharmaceutical Ingredient CDMO Market Revenue By Service Type
13.1.8. API Type
13.1.9. Global Active Pharmaceutical Ingredient CDMO Market Revenue By API Type
13.1.10. Workflow
13.1.12. Global Active Pharmaceutical Ingredient CDMO Market Revenue By Workflow
13.1.13. Therapeutic Area
13.1.14. Global Active Pharmaceutical Ingredient CDMO Market Revenue By Therapeutic Area
CHAPTER NO. 14: NORTH AMERICA ACTIVE PHARMACEUTICAL INGREDIENT CDMO MARKET – COUNTRY ANALYSIS
14.1. North America Active Pharmaceutical Ingredient CDMO Market Overview by Country Segment
14.1.1. North America Active Pharmaceutical Ingredient CDMO Market Revenue Share By Region
14.2. North America
14.2.1. North America Active Pharmaceutical Ingredient CDMO Market Revenue By Country
14.2.2. Product
14.2.3. North America Active Pharmaceutical Ingredient CDMO Market Revenue By Product
14.2.4. Service Type
14.2.5. North America Active Pharmaceutical Ingredient CDMO Market Revenue By Service Type
14.2.6. API Type
14.2.7. North America Active Pharmaceutical Ingredient CDMO Market Revenue By API Type
14.2.8. Workflow
14.2.9. North America Active Pharmaceutical Ingredient CDMO Market Revenue By Workflow
14.2.10. Therapeutic Area
14.2.11. North America Active Pharmaceutical Ingredient CDMO Market Revenue By Therapeutic Area
14.3. U.S.
14.4. Canada
14.5. Mexico
CHAPTER NO. 15: EUROPE ACTIVE PHARMACEUTICAL INGREDIENT CDMO MARKET – COUNTRY ANALYSIS
15.1. Europe Active Pharmaceutical Ingredient CDMO Market Overview by Country Segment
15.1.1. Europe Active Pharmaceutical Ingredient CDMO Market Revenue Share By Region
15.2. Europe
15.2.1. Europe Active Pharmaceutical Ingredient CDMO Market Revenue By Country
15.2.2. Product
15.2.3. Europe Active Pharmaceutical Ingredient CDMO Market Revenue By Product
15.2.4. Service Type
15.2.5. Europe Active Pharmaceutical Ingredient CDMO Market Revenue By Service Type
15.2.6. API Type
15.2.7. Europe Active Pharmaceutical Ingredient CDMO Market Revenue By API Type
15.2.8. Workflow
15.2.9. Europe Active Pharmaceutical Ingredient CDMO Market Revenue By Workflow
15.2.10. Therapeutic Area
15.2.11. Europe Active Pharmaceutical Ingredient CDMO Market Revenue By Therapeutic Area
15.3. UK
15.4. France
15.5. Germany
15.6. Italy
15.7. Spain
15.8. Russia
15.9. Rest of Europe
CHAPTER NO. 16: ASIA PACIFIC ACTIVE PHARMACEUTICAL INGREDIENT CDMO MARKET – COUNTRY ANALYSIS
16.1. Asia Pacific Active Pharmaceutical Ingredient CDMO Market Overview by Country Segment
16.1.1. Asia Pacific Active Pharmaceutical Ingredient CDMO Market Revenue Share By Region
16.2. Asia Pacific
16.2.1. Asia Pacific Active Pharmaceutical Ingredient CDMO Market Revenue By Country
16.2.2. Product
16.2.3. Asia Pacific Active Pharmaceutical Ingredient CDMO Market Revenue By Product
16.2.4. Service Type
16.2.5. Asia Pacific Active Pharmaceutical Ingredient CDMO Market Revenue By Service Type
16.2.6. API Type
16.2.7. Asia Pacific Active Pharmaceutical Ingredient CDMO Market Revenue By API Type
16.2.8. Workflow
16.2.9. Asia Pacific Active Pharmaceutical Ingredient CDMO Market Revenue By Workflow
16.2.10. Therapeutic Area
16.2.11. Asia Pacific Active Pharmaceutical Ingredient CDMO Market Revenue By Therapeutic Area
16.3. China
16.4. Japan
16.5. South Korea
16.6. India
16.7. Australia
16.8. Southeast Asia
16.9. Rest of Asia Pacific
CHAPTER NO. 17: LATIN AMERICA ACTIVE PHARMACEUTICAL INGREDIENT CDMO MARKET – COUNTRY ANALYSIS
17.1. Latin America Active Pharmaceutical Ingredient CDMO Market Overview by Country Segment
17.1.1. Latin America Active Pharmaceutical Ingredient CDMO Market Revenue Share By Region
17.2. Latin America
17.2.1. Latin America Active Pharmaceutical Ingredient CDMO Market Revenue By Country
17.2.2. Product
17.2.3. Latin America Active Pharmaceutical Ingredient CDMO Market Revenue By Product
17.2.4. Service Type
17.2.5. Latin America Active Pharmaceutical Ingredient CDMO Market Revenue By Service Type
17.2.6. API Type
17.2.7. Latin America Active Pharmaceutical Ingredient CDMO Market Revenue By API Type
17.2.8. Workflow
17.2.9. Latin America Active Pharmaceutical Ingredient CDMO Market Revenue By Workflow
17.2.10. Therapeutic Area
17.2.11. Latin America Active Pharmaceutical Ingredient CDMO Market Revenue By Therapeutic Area
17.3. Brazil
17.4. Argentina
17.5. Rest of Latin America
CHAPTER NO. 18: MIDDLE EAST ACTIVE PHARMACEUTICAL INGREDIENT CDMO MARKET – COUNTRY ANALYSIS
18.1. Middle East Active Pharmaceutical Ingredient CDMO Market Overview by Country Segment
18.1.1. Middle East Active Pharmaceutical Ingredient CDMO Market Revenue Share By Region
18.2. Middle East
18.2.1. Middle East Active Pharmaceutical Ingredient CDMO Market Revenue By Country
18.2.2. Product
18.2.3. Middle East Active Pharmaceutical Ingredient CDMO Market Revenue By Product
18.2.4. Service Type
18.2.5. Middle East Active Pharmaceutical Ingredient CDMO Market Revenue By Service Type
18.2.6. API Type
18.2.7. Middle East Active Pharmaceutical Ingredient CDMO Market Revenue By API Type
18.2.8. Workflow
18.2.9. Middle East Active Pharmaceutical Ingredient CDMO Market Revenue By Workflow
18.2.10. Therapeutic Area
18.2.11. Middle East Active Pharmaceutical Ingredient CDMO Market Revenue By Therapeutic Area
18.3. GCC Countries
18.4. Israel
18.5. Turkey
18.6. Rest of Middle East
CHAPTER NO. 19: AFRICA ACTIVE PHARMACEUTICAL INGREDIENT CDMO MARKET – COUNTRY ANALYSIS
19.1. Africa Active Pharmaceutical Ingredient CDMO Market Overview by Country Segment
19.1.1. Africa Active Pharmaceutical Ingredient CDMO Market Revenue Share By Region
19.2. Africa
19.2.1. Africa Active Pharmaceutical Ingredient CDMO Market Revenue By Country
19.2.2. Product
19.2.3. Africa Active Pharmaceutical Ingredient CDMO Market Revenue By Product
19.2.4. Service Type
19.2.5. Africa Active Pharmaceutical Ingredient CDMO Market Revenue By Service Type
19.2.6. API Type
19.2.7. Africa Active Pharmaceutical Ingredient CDMO Market Revenue By API Type
19.2.8. Workflow
19.2.9. Africa Active Pharmaceutical Ingredient CDMO Market Revenue By Workflow
19.2.10. Therapeutic Area
19.2.11. Africa Active Pharmaceutical Ingredient CDMO Market Revenue By Therapeutic Area
19.3. South Africa
19.4. Egypt
19.5. Rest of Africa
CHAPTER NO. 20: COMPANY PROFILES
20.1. Thermo Fisher Scientific Inc. (Pantheon)
20.1.1. Company Overview
20.1.2. Product Portfolio
20.1.3. Financial Overview
20.1.4. Recent Developments
20.1.5. Growth Strategy
20.1.6. SWOT Analysis
20.2. CordenPharma International
20.3. Samsung Biologics
20.4. Lonza
20.5. Catalent, Inc.
20.6. Cambrex Corporation
20.7. Recipharm AB
20.8. Company 8
20.9. Company 9
20.10. Company 10

Request Free Sample

We prioritize the confidentiality and security of your data. Our promise: your information remains private.

Ready to Transform Data into Decisions?

Request Your Sample Report and Start Your Journey of Informed Choices


Providing the strategic compass for industry titans.

cr-clients-logos

Frequently Asked Questions

What is the current market size for Active Pharmaceutical Ingredient CDMO Market, and what is its projected size in 2032?

The Active Pharmaceutical Ingredient CDMO Market size reached USD 127.54 million in 2024 and is projected to grow significantly, reaching USD 225.43 million by 2032.

At what Compound Annual Growth Rate is the Active Pharmaceutical Ingredient CDMO Market projected to grow between 2025 and 2032?

The Active Pharmaceutical Ingredient CDMO Market is expected to expand steadily during the forecast period, registering a Compound Annual Growth Rate (CAGR) of 6.87% between 2025 and 2032.

Which Active Pharmaceutical Ingredient CDMO Market segment held the largest share in 2024?

In 2024, the Traditional Active Pharmaceutical Workflow (Traditional API) segment led with 47% market share, driven by strong demand for generics and established production efficiencies.

What are the primary factors fueling the growth of the Active Pharmaceutical Ingredient CDMO Market?

Key growth drivers include rising outsourcing by pharma firms, increasing demand for highly potent APIs, expanding adoption of biotech APIs, and growing investment in advanced manufacturing technologies.

Who are the leading companies in the Active Pharmaceutical Ingredient CDMO Market?

Prominent companies include Thermo Fisher Scientific, Lonza, Catalent, Samsung Biologics, CordenPharma, Cambrex, Recipharm, Siegfried, WuXi AppTec, and Piramal Pharma Solutions, offering global reach and diversified capabilities.

Which region commanded the largest share of the Active Pharmaceutical Ingredient CDMO Market in 2024?

The Asia Pacific region held the largest share at 37% in 2024, supported by cost-effective manufacturing, expanding biomanufacturing capacity, and government-backed API production initiatives.

About Author

Shweta Bisht

Shweta Bisht

Healthcare & Biotech Analyst

Shweta is a healthcare and biotech researcher with strong analytical skills in chemical and agri domains.

View Profile

Related Reports

Malaria Vaccines Market

The Global Malaria Vaccines Market size was valued at USD 392.1 million in 2018 to USD 495.6 million in 2024 and is anticipated to reach USD 640.7 million by 2032, at a CAGR of 3.22% during the forecast period.

Africa Retail Pharmacy Market

The Africa Retail Pharmacy Market size was valued at USD 68,600.00 million in 2018 to USD 70,054.82 million in 2024 and is anticipated to reach USD 86,600.45 million by 2032, at a CAGR of 2.69% during the forecast period.

Guidewires Market

The Guidewires Market size was valued at USD 2.79 billion in 2024 and is anticipated to reach USD 4.2 billion by 2032, at a CAGR of 5.24% during the forecast period (2024-2032).

U.S. Skincare Supplement Market

The U.S. Skin Supplements Market size was valued at USD 491.29 million in 2018 to USD 804.53 million in 2024 and is anticipated to reach USD 1,488.09 million by 2032, at a CAGR of 7.99% during the forecast period.

Funeral Homes and Funeral Services Market

The Global Funeral Homes and Funeral Services Market size was valued at USD 49.07 billion in 2018 to USD 72.15 billion in 2024 and is anticipated to reach USD 122.72 billion by 2032, at a CAGR of 6.39% during the forecast period.

Erectile Dysfunction Treatment Drugs Market

The Global Erectile Dysfunction Treatment Drugs Market size was valued at USD 2,055.4 million in 2018 to USD 3,049.0 million in 2024 and is anticipated to reach USD 4,657.0 million by 2032, at a CAGR of 5.37% during the forecast period.

Microfluidic Components Market

Microfluidic Components Market size was valued at USD 5.18 billion in 2024 and is anticipated to reach USD 12.17 billion by 2032, at a CAGR of 11.26% during the forecast period.

Intravenous Iron Drugs Market

The intravenous iron drugs market size was valued at USD 1.8 billion in 2024 and is anticipated to reach USD 2.98 billion by 2032, at a CAGR of 6.5 % during the forecast period (2024-2032).

Medical Mobility Aids Market

The Medical Mobility Aids Market was valued at USD 9.03 billion in 2024 and is projected to reach USD 15.75 billion by 2032, growing at a CAGR of 7.2% during the forecast period.

Pain Therapeutics Market

Global Pain Therapeutics Market size was valued at USD 58,116.3 million in 2018 to USD 74,483.8 million in 2024 and is anticipated to reach USD 1,10,568.4 million by 2032, at a CAGR of 5.12% during the forecast period.Pain Therapeutics Market Was Valued At US$ 53.2 Bn In 2016, And Is Expected To Reach US$ 85.4 Bn By 2025, Expanding At A CAGR Of 5.3% From 2017 To 2025

Induced Pluripotent Stem Cells Production Market

The induced pluripotent stem cells production market size was valued at USD 1.53 billion in 2024 and is anticipated to reach USD 3.18 billion by 2032, at a CAGR of 9.6% during the forecast period (2024-2032).

Hysteroscopy Instruments Market

The hysteroscopy instruments market size was valued at USD 1.95 billion in 2024 and is anticipated to reach USD 3.39 billion by 2032, at a CAGR of 7.2 % during the forecast period (2024-2032).

Licence Option

The report comes as a view-only PDF document, optimized for individual clients. This version is recommended for personal digital use and does not allow printing. Use restricted to one purchaser only.
$4999

To meet the needs of modern corporate teams, our report comes in two formats: a printable PDF and a data-rich Excel sheet. This package is optimized for internal analysis. Unlimited users allowed within one corporate location (e.g., regional office).
$6999

The report will be delivered in printable PDF format along with the report’s data Excel sheet. This license offers 100 Free Analyst hours where the client can utilize Credence Research Inc. research team. Permitted for unlimited global use by all users within the purchasing corporation, such as all employees of a single company.
$12999

Report delivery within 24 to 48 hours

Credence Staff 3

WILLIAM, North America

Support Staff at Credence Research

KEITH PHILLIPS, Europe

Lee - CR Sales Staff

LEE VALLANCE, Asia Pacific

Kieran Jameson

KIERAN JAMESON, Australia

Smallform of Sample request
User Review

Thank you for the data! The numbers are exactly what we asked for and what we need to build our business case.

Materials Scientist
(privacy requested)

User Review

The report was an excellent overview of the Industrial Burners market. This report does a great job of breaking everything down into manageable chunks.

Imre Hof
Management Assistant, Bekaert

cr-clients-logos

Request Sample