Market Overview
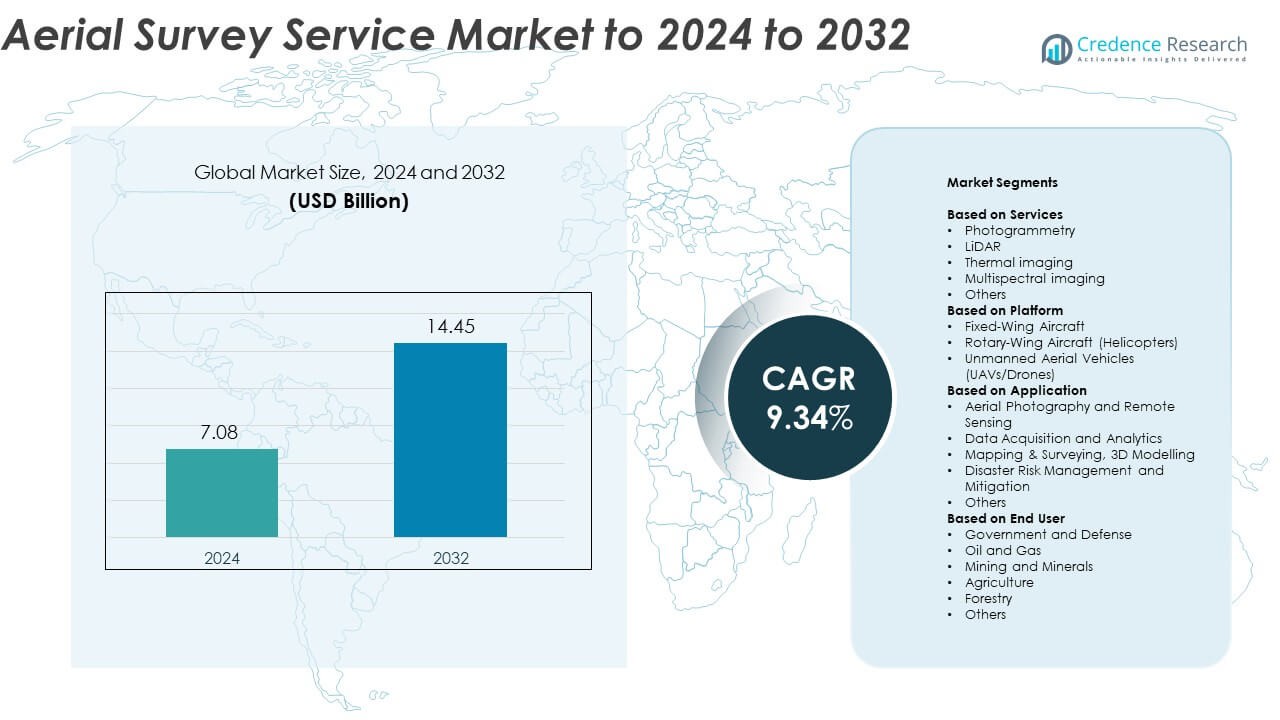
The Aerial Survey Service Market size was valued at USD 7.08 Billion in 2024 and is anticipated to reach USD 14.45 Billion by 2032, at a CAGR of 9.34% during the forecast period.
| REPORT ATTRIBUTE |
DETAILS |
| Historical Period |
2020-2023 |
| Base Year |
2024 |
| Forecast Period |
2025-2032 |
| Aerial Survey Service Market Size 2024 |
USD 7.08 Billion |
| Aerial Survey Service Market, CAGR |
9.34% |
| Aerial Survey Service Market Size 2032 |
USD 14.45 Billion |
The aerial survey service market is dominated by key players including Fugro, CGG, Schlumberger, TGS, Fairfield Geotechnologies, Ocean Infinity, ION Geophysical, and PGS. These companies lead through advanced imaging technologies, extensive global networks, and strong expertise in geospatial data acquisition. North America holds the largest market share at 37.8% in 2024, driven by high adoption of UAV-based mapping and infrastructure development. Europe follows with 29.6% share, supported by sustainable land management initiatives and renewable energy mapping. Asia Pacific captures 22.4% share, fueled by rapid urbanization and government-backed digital mapping programs across major economies such as China, Japan, and India.
Access crucial information at unmatched prices!
Request your sample report today & start making informed decisions powered by Credence Research Inc.!
Download Sample
Market Insights
- The aerial survey service market was valued at USD 7.08 Billion in 2024 and is projected to reach USD 14.45 Billion by 2032, growing at a CAGR of 9.34%.
• Rising demand for UAV-based mapping and LiDAR imaging drives market growth across infrastructure, agriculture, and defense sectors.
• Technological advancements in AI, cloud analytics, and multispectral imaging enhance data precision and reduce project turnaround time.
• The market remains competitive with major players focusing on innovation, automation, and strategic partnerships to expand global service reach.
• North America leads with 37.8% share, followed by Europe at 29.6% and Asia Pacific at 22.4%, while the photogrammetry segment dominates with nearly 38.6% share in 2024.
Market Segmentation Analysis:
By Services
The photogrammetry segment dominates the aerial survey service market, capturing nearly 38.6% share in 2024. Its leadership is driven by extensive adoption in topographic mapping, construction planning, and infrastructure development. Photogrammetry enables high-resolution 3D modeling and precise spatial data extraction at lower costs compared to traditional surveying. The increasing integration of AI-based image processing and cloud data platforms further boosts efficiency and accuracy, making it the preferred service across urban planning, agriculture, and environmental monitoring applications.
- For instance, Leica’s CityMapper-2 mounts two 150 MP nadir sensors and four 150 MP oblique sensors for hybrid capture.
By Platform
Unmanned Aerial Vehicles (UAVs/Drones) lead the market with approximately 49.2% share in 2024. Their dominance is supported by cost-effective operations, high maneuverability, and accessibility in restricted terrains. UAVs are increasingly adopted for large-scale mapping, inspection, and environmental monitoring due to their ability to capture real-time data. Advancements in drone autonomy, battery technology, and payload capacity enhance efficiency. The growing use of drone-based LiDAR and thermal imaging solutions across industries accelerates their adoption globally.
- For instance, DJI’s Matrice 350 RTK lists 55 minutes max flight time and 12 m/s wind resistance.
By Application
Mapping & Surveying and 3D Modelling account for about 44.8% share in 2024, emerging as the leading application segment. Their dominance stems from widespread use in construction, mining, and land management. These applications rely on aerial data for creating accurate topographic maps and volumetric analyses. The demand is further supported by digital twin adoption and smart infrastructure projects. Integration of AI-driven analytics for data visualization enhances project planning accuracy, strengthening this segment’s leadership across both developed and emerging economies.
Key Growth Drivers
Rising Demand for Infrastructure Development and Urban Planning
The growing need for precision mapping in infrastructure and urban planning is a major growth driver. Governments and private developers use aerial survey services for road construction, smart city design, and land-use planning. The technology enables faster data acquisition and cost-effective monitoring compared to ground-based surveys. The integration of GIS and 3D mapping enhances project visualization and resource management, supporting sustainable urban expansion. Increasing public infrastructure budgets across emerging economies further fuel the demand for aerial survey services.
- For instance, Nearmap captures over 308,000 unique square miles annually across its U.S. program, covering more than 1,740 urban areas, which is approximately 797,678 unique km² each year.
Expansion of UAV-Based Surveying Solutions
The rapid adoption of unmanned aerial vehicles (UAVs) for aerial surveys is transforming data collection efficiency. UAVs capture high-resolution imagery, thermal data, and LiDAR readings with lower operational costs. Their ability to access challenging terrains and deliver near real-time insights drives usage in mining, construction, and agriculture. Advancements in automation, GPS precision, and payload capabilities strengthen UAV-based survey reliability. Expanding drone regulations and government approvals across key markets continue to accelerate this trend.
- For instance, senseFly/AgEagle eBee X reaches up to 90 minutes endurance and maps up to 500 ha per flight.
Growing Adoption in Environmental and Resource Monitoring
Aerial survey services are increasingly used in environmental monitoring and resource management. Governments and environmental agencies employ aerial imaging for forest cover mapping, flood assessment, and coastal erosion studies. The capability to capture accurate, large-scale environmental data supports climate resilience and conservation programs. Integration of AI and machine learning improves data analysis, enabling predictive insights for policy planning. Rising awareness about sustainable land use and disaster preparedness amplifies the market growth.
Key Trends & Opportunities
Integration of AI and Cloud-Based Analytics
The adoption of AI-driven data analytics and cloud computing is reshaping aerial survey operations. AI enhances object detection, feature extraction, and change detection, while cloud platforms streamline data sharing and processing. This integration allows faster delivery of survey outputs and supports large-scale projects requiring continuous monitoring. Service providers offering automated workflows and cloud-based data access gain a strong competitive edge in the market.
- For instance, Esri India reported 1,000,000 ArcGIS users in May 2024, underscoring cloud GIS scale.
Increasing Use of Multispectral and LiDAR Technologies
The demand for multispectral and LiDAR technologies is rising due to their high accuracy and versatility. These systems enable detailed topographic mapping, vegetation analysis, and infrastructure inspection. Industries such as agriculture, forestry, and mining are adopting these tools to optimize resource management and improve operational decisions. Continuous improvements in sensor precision and cost reduction of LiDAR equipment open new opportunities for service expansion.
- For instance, Teledyne’s Galaxy Edge airborne LiDAR advertises a 2 MHz pulse rate for high-resolution mapping.
Expansion in Renewable Energy and Utility Mapping
Aerial survey services are gaining traction in renewable energy projects and utility infrastructure management. Solar and wind energy developers use aerial mapping to assess land potential and optimize asset layouts. Similarly, utility companies rely on aerial inspections for transmission line monitoring and fault detection. As clean energy investments rise globally, the demand for accurate and timely aerial data collection continues to grow.
Key Challenges
Regulatory and Airspace Restrictions
Stringent regulations related to drone operations and restricted airspace remain major challenges for market players. Compliance with aviation safety standards and data privacy laws often delays project timelines. Differences in drone usage regulations across regions create operational complexity for global service providers. Securing flight permissions and maintaining safety certifications increase costs. Harmonized regulatory frameworks are essential to ensure wider adoption of aerial survey services.
High Equipment and Data Processing Costs
The high cost of LiDAR sensors, high-resolution cameras, and data processing software limits market penetration among smaller firms. Advanced aerial imaging systems require significant upfront investment and skilled personnel for operation and interpretation. Data storage and processing demand robust IT infrastructure, increasing operational expenditure. Despite falling sensor prices, total survey costs remain a barrier, particularly in developing markets with limited funding capacity.
Regional Analysis
North America
North America dominates the aerial survey service market with nearly 37.8% share in 2024. The region’s leadership is supported by advanced drone regulations, high adoption of LiDAR, and extensive infrastructure development projects. The United States remains a key contributor, driven by demand in construction, defense, and agriculture. The presence of established service providers and integration of AI-based analytics enhance operational precision. Continuous investments in smart city programs and environmental monitoring further strengthen the regional market, while Canada’s expanding use of aerial mapping in natural resource management adds additional growth momentum.
Europe
Europe holds about 29.6% share of the aerial survey service market in 2024. The market benefits from strong government support for geospatial data infrastructure and sustainable land management. Countries such as Germany, the U.K., and France lead adoption due to their focus on precision agriculture, renewable energy mapping, and urban planning. Technological advancements in UAVs and LiDAR systems support cost-efficient data collection. Ongoing EU initiatives for environmental monitoring and smart mobility encourage further adoption of aerial imaging solutions across diverse industrial sectors.
Asia Pacific
Asia Pacific accounts for approximately 22.4% share of the global aerial survey service market in 2024. Rapid infrastructure expansion, rising investments in smart cities, and increasing use of drones for mapping drive regional growth. China, Japan, and India are major contributors, supported by advancements in satellite connectivity and 3D mapping technologies. The growing presence of local drone service startups enhances accessibility for construction, mining, and agriculture applications. Government initiatives promoting digital transformation and geospatial innovation continue to accelerate market penetration across the region.
Latin America
Latin America represents around 6.3% share of the aerial survey service market in 2024. The region’s growth is driven by the increasing use of aerial mapping for mining, agriculture, and energy projects. Brazil, Mexico, and Chile are emerging markets due to growing infrastructure investments and improved drone regulations. Expanding adoption of UAV-based imaging for forest monitoring and land-use planning supports market expansion. However, limited funding for advanced LiDAR systems and inconsistent regulatory frameworks present minor restraints to broader adoption across the region.
Middle East and Africa
The Middle East and Africa hold a combined market share of about 3.9% in 2024. Growth is supported by rising use of aerial surveys in construction, oil exploration, and environmental management. The United Arab Emirates and Saudi Arabia lead adoption due to large-scale infrastructure and renewable energy projects. Africa’s market is gaining traction through mining and agricultural mapping applications. Increasing collaboration between international drone operators and local governments strengthens capacity building, while ongoing modernization of aerial data systems contributes to gradual regional market growth.
Market Segmentations:
By Services
- Photogrammetry
- LiDAR
- Thermal imaging
- Multispectral imaging
- Others
By Platform
- Fixed-Wing Aircraft
- Rotary-Wing Aircraft (Helicopters)
- Unmanned Aerial Vehicles (UAVs/Drones)
By Application
- Aerial Photography and Remote Sensing
- Data Acquisition and Analytics
- Mapping & Surveying, 3D Modelling
- Disaster Risk Management and Mitigation
- Others
By End User
- Government and Defense
- Oil and Gas
- Mining and Minerals
- Agriculture
- Forestry
- Others
By Geography
- North America
- Europe
- Germany
- France
- U.K.
- Italy
- Spain
- Rest of Europe
- Asia Pacific
- China
- Japan
- India
- South Korea
- South-east Asia
- Rest of Asia Pacific
- Latin America
- Brazil
- Argentina
- Rest of Latin America
- Middle East & Africa
- GCC Countries
- South Africa
- Rest of the Middle East and Africa
Competitive Landscape
The competitive landscape of the aerial survey service market features prominent players such as Fugro, CGG, Schlumberger, TGS, Fairfield Geotechnologies, Ocean Infinity, ION Geophysical, PGS, WesternGeco, Sercel, BGP, CNOOC, Nortek Offshore, Geokinetics, and Deep Sea Research. The market is characterized by continuous innovation in imaging technologies, LiDAR systems, and drone-based data acquisition platforms. Companies are investing in AI and cloud integration to enhance data accuracy and reduce project turnaround times. Strategic partnerships, mergers, and service expansions are driving global competitiveness, while increasing demand for high-resolution mapping across infrastructure, energy, and environmental sectors fosters strong competition. Service providers are also focusing on customized solutions for government, defense, and industrial clients to strengthen long-term contracts. Growing emphasis on data security, operational efficiency, and regulatory compliance further differentiates industry leaders from emerging players, positioning the market for sustained technological advancement and geographic expansion over the coming years.
Shape Your Report to Specific Countries or Regions & Enjoy 30% Off!
Key Player Analysis
- Fugro
- CGG
- Schlumberger
- TGS
- Fairfield Geotechnologies
- Ocean Infinity
- ION Geophysical
- PGS
- WesternGeco
- Sercel
- BGP
- CNOOC
- Nortek Offshore
- Geokinetics
- Deep Sea Research
Recent Developments
- In 2025, Schlumberger launched a new artificial intelligence tool to automate processes and workflows for energy companies, enhancing digital capabilities in survey and geophysical services.
- In 2025, Fairfield Geotechnologies delivered production PSTM volumes for its Cedar Canyon 3D survey, covering over 230 square miles in the Delaware Basin with ultra-high trace density and exceptional seismic clarity for reservoir characterization and geosteering.
- In 2024, WesternGeco (SLB) With TGS, launched Engagement Phase 5 OBN acquisition in the U.S. Gulf of Mexico.
Report Coverage
The research report offers an in-depth analysis based on Services, Platform, Application, End-User and Geography. It details leading market players, providing an overview of their business, product offerings, investments, revenue streams, and key applications. Additionally, the report includes insights into the competitive environment, SWOT analysis, current market trends, as well as the primary drivers and constraints. Furthermore, it discusses various factors that have driven market expansion in recent years. The report also explores market dynamics, regulatory scenarios, and technological advancements that are shaping the industry. It assesses the impact of external factors and global economic changes on market growth. Lastly, it provides strategic recommendations for new entrants and established companies to navigate the complexities of the market.
Future Outlook
- The market will experience steady growth driven by increasing infrastructure and urban development projects.
- UAV-based aerial survey solutions will continue to replace conventional surveying methods.
- Advancements in AI, LiDAR, and cloud computing will enhance data accuracy and processing speed.
- Governments will expand the use of aerial mapping for environmental monitoring and disaster management.
- The agriculture sector will adopt drone-based imaging for crop analysis and resource optimization.
- Integration of 3D modeling and digital twins will strengthen planning and design applications.
- Growing investments in renewable energy and smart cities will fuel aerial survey demand.
- Partnerships between technology firms and service providers will improve operational efficiency.
- Regulatory harmonization across countries will create new growth opportunities for global players.
- The emergence of low-cost drone technologies will make aerial survey services more accessible worldwide.


