Market Overview
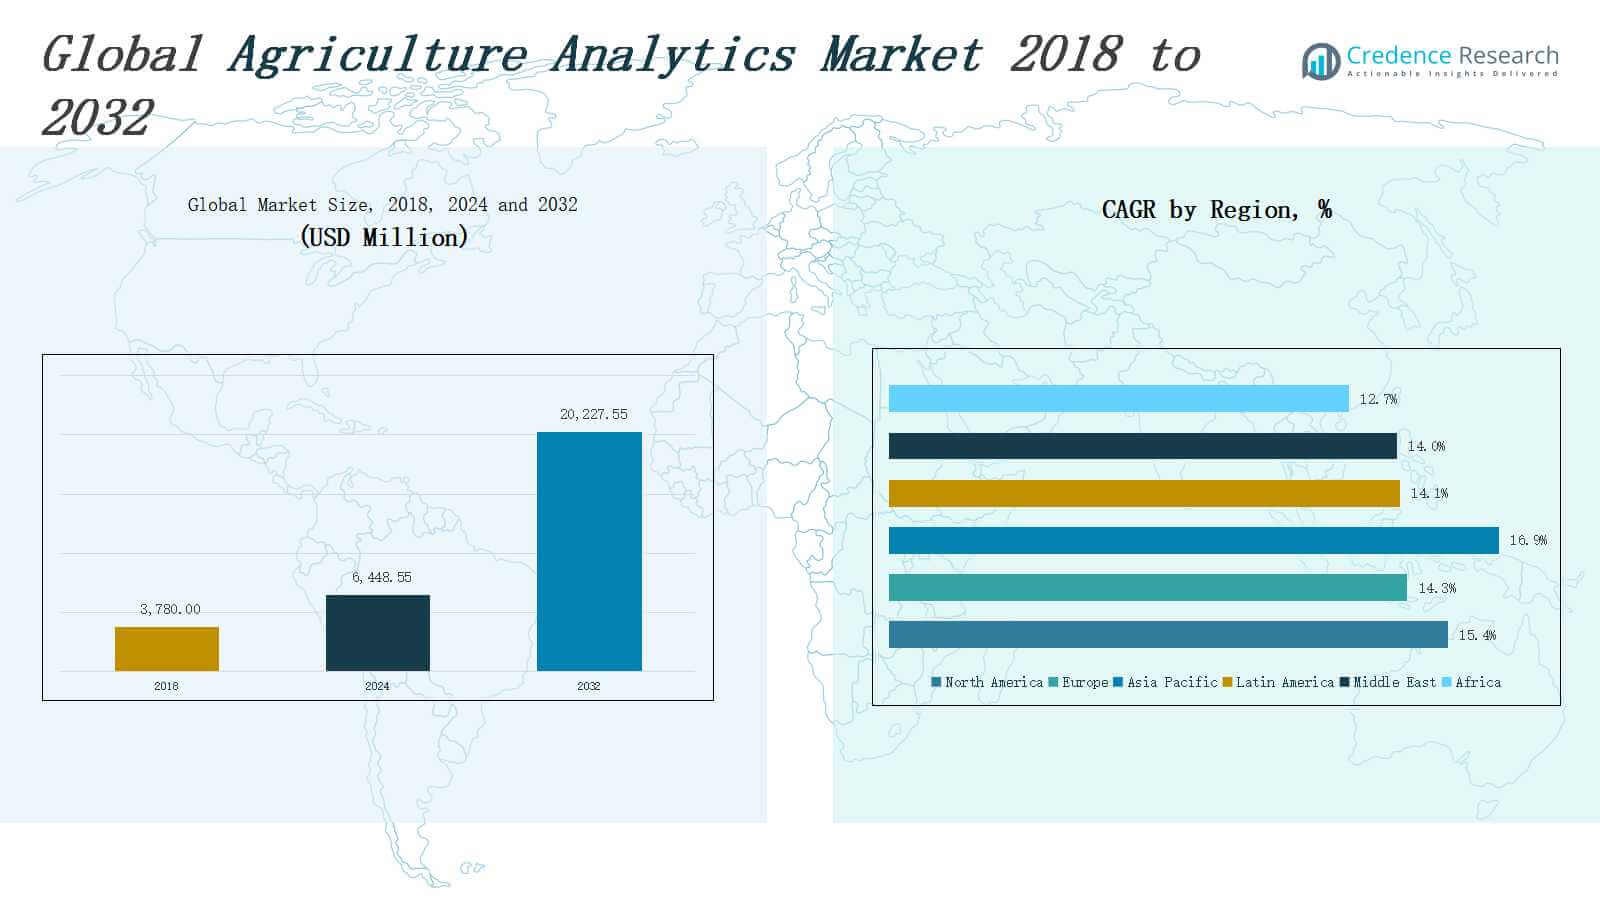
The Agriculture Analytics Market size was valued at USD 3,780.00million in 2018 to USD 6,448.55 million in 2024 and is anticipated to reach USD 20,227.55 million by 2032, at a CAGR of 15.44 % during the forecast period.
| REPORT ATTRIBUTE |
DETAILS |
| Historical Period |
2020-2023 |
| Base Year |
2024 |
| Forecast Period |
2025-2032 |
| Agriculture Analytics Market Size 2024 |
USD 6,448.55 Million |
| Agriculture Analytics Market, CAGR |
15.44 % |
| Agriculture Analytics Market Size 2032 |
USD 20,227.55 Million |
The Agriculture Analytics Market is experiencing strong growth driven by the increasing need for data-driven decision-making in farming practices. Rising global food demand, coupled with shrinking arable land and unpredictable climate conditions, is compelling farmers and agribusinesses to adopt advanced analytics for optimizing crop yield, resource use, and risk management. Precision farming, enabled by IoT devices, drones, satellite imagery, and AI-powered platforms, is enhancing real-time insights into soil health, weather patterns, and pest infestations. Governments and agricultural agencies are promoting smart farming technologies through subsidies and digital infrastructure investments, accelerating market adoption. Cloud-based analytics tools offer scalability and ease of integration with farm management systems, attracting both small-scale and large-scale producers. Furthermore, advancements in machine learning and predictive modeling are improving forecasting accuracy for yield estimation and supply chain planning. The market is witnessing a shift toward sustainable practices through analytics-driven water conservation, fertilizer optimization, and carbon tracking, aligning agricultural productivity with environmental stewardship.
The Agriculture Analytics Market spans six key regions: North America, Europe, Asia Pacific, Latin America, the Middle East, and Africa. North America leads in adoption, driven by advanced digital infrastructure and major players like IBM Corporation and Trimble Inc. Europe follows with strong regulatory support and sustainability initiatives. Asia Pacific is the fastest-growing region, supported by government-backed digital farming programs across China, India, and Japan. Latin America, particularly Brazil and Argentina, is adopting analytics for large-scale commercial farming. The Middle East focuses on smart irrigation and controlled-environment agriculture, with Israel as a regional leader. Africa is emerging through mobile-based advisory services and donor-supported digital agriculture projects. Key players in the market include SAP SE, Oracle Corporation, Wipro, Iteris, Taranis, PrecisionHawk, Xylem Inc., Conservis Corporation, Geosys Inc., and Gro Intelligence, all contributing to innovation, regional expansion, and tailored analytics solutions across diverse agricultural landscapes.
Access crucial information at unmatched prices!
Request your sample report today & start making informed decisions powered by Credence Research Inc.!
Download Sample
Market Insights
- The Agriculture Analytics Market was valued at USD 3,780.00 million in 2018 and is projected to reach USD 20,227.55 million by 2032, growing at a CAGR of 15.44%.
- Rising global food demand, limited arable land, and climate unpredictability are pushing farmers to adopt analytics for yield optimization and resource efficiency.
- Precision agriculture using IoT, drones, satellite imagery, and AI is enabling real-time monitoring of soil health, weather, and pest conditions.
- Government support through subsidies, digital infrastructure, and rural development programs is accelerating analytics adoption across both developed and developing economies.
- High initial costs, infrastructure gaps, and data privacy concerns continue to challenge adoption, especially among smallholder farmers in emerging regions.
- North America dominates the market with advanced infrastructure and key players like IBM and Trimble, while Asia Pacific is the fastest-growing region due to rapid digitization.
- Leading players include SAP SE, Oracle, Wipro, Iteris, Taranis, PrecisionHawk, Xylem Inc., Conservis, Geosys, and Gro Intelligence, contributing to innovation and global expansion.
 Market Drivers
Growing Demand for Precision Agriculture Solutions
The Agriculture Analytics Market is gaining traction due to the increasing adoption of precision agriculture techniques. Farmers and agribusinesses are leveraging data analytics to monitor crop health, optimize irrigation, and reduce resource wastage. It enables real-time decision-making based on soil conditions, weather data, and plant growth patterns. Rising input costs and demand for higher yields are driving the need for accurate insights. Integration of sensors, GPS, and drones enhances data accuracy. It supports sustainable and profitable farming practices.
- For instance, John Deere’s See & Spray Technology uses advanced cameras and machine learning to identify weeds and spray herbicide only where needed, reducing herbicide use by up to 77%.
Government Support and Policy Initiatives
The Agriculture Analytics Market benefits from strong governmental support and favorable policy frameworks aimed at promoting smart agriculture. Many governments are investing in digital agriculture programs and offering subsidies for advanced technologies. It helps small and medium-sized farmers adopt analytics platforms. National programs for food security and rural development are accelerating adoption. Regulatory emphasis on sustainable resource use increases demand for monitoring tools. These initiatives create a stable foundation for analytics expansion in agriculture.
- For instance, in April 2024, the US Department of Agriculture (USDA) committed $1.5 billion through the Regional Conservation Partnership Program to support climate-focused conservation and technology adoption, directly funding analytics-driven solutions for resource management and sustainability.
Technological Advancements in IoT and AI
Rapid advancements in IoT, artificial intelligence, and machine learning are accelerating the evolution of the Agriculture Analytics Market. Smart sensors, satellite imaging, and AI algorithms collect and process vast volumes of agricultural data. It improves forecasting for crop yields, pest risks, and market pricing. Analytics platforms are becoming more intuitive and accessible to non-technical users. Cloud computing enhances scalability and collaboration. These innovations enable farms to optimize operations and reduce environmental impact effectively.
Rising Global Food Demand and Climate Variability
The Agriculture Analytics Market is driven by the urgent need to address food security challenges posed by population growth and climate change. Farmers face increasingly unpredictable weather patterns and limited natural resources. Analytics tools help mitigate these risks through predictive modeling and scenario analysis. It allows better planning of planting cycles and resource allocation. Growing pressure on the global food supply chain makes efficiency crucial. Analytics serves as a strategic enabler for resilient agriculture systems.
Market Trends
Adoption of Cloud-Based and Edge Computing Solutions
The Agriculture Analytics Market is witnessing a growing shift toward cloud-based and edge computing platforms that support scalable, real-time analytics. These solutions offer flexibility, faster data processing, and seamless integration with farm management systems. Farmers are increasingly using cloud services to access remote diagnostics, monitor equipment, and track crop conditions from any location. Edge computing improves operational efficiency by processing data directly at the source, such as sensors or drones. It reduces latency and enables faster response. These technologies support precision agriculture by enhancing connectivity and decision-making capabilities in remote or rural areas.
- For instance, Farmonaut Traceability integrates blockchain and satellite data on a cloud platform to provide transparent tracking of produce from farm to shelf, improving food safety and minimizing post-harvest losses.
Integration of Artificial Intelligence and Machine Learning
The Agriculture Analytics Market is evolving with the widespread integration of artificial intelligence and machine learning algorithms. These technologies enable advanced predictive modeling for yield forecasting, pest detection, and disease identification. AI-powered tools analyze vast datasets from soil sensors, weather stations, and satellite imagery to deliver actionable insights. It improves crop management and reduces resource wastage. Machine learning models adapt over time, refining their accuracy based on changing environmental variables. This trend enhances risk management and supports evidence-based farming strategies across large-scale and smallholder farms.
- For instance, Aurea Imaging launched the TMS TreeScout in July 2023, an AI-powered sensor mounted on tractors that uses 3D computer vision to scan trees, map blooms, and assess livestock health, helping farmers enhance revenue and cut operational costs.
Rising Use of Drones, IoT, and Remote Sensing Technologies
The Agriculture Analytics Market continues to expand with the rising deployment of drones, IoT devices, and remote sensing tools. These technologies gather high-resolution, real-time data on soil moisture, plant health, temperature, and nutrient levels. It empowers farmers to monitor field conditions with greater precision and frequency. Drones equipped with multispectral sensors offer aerial views that identify crop stress and variability. IoT-based smart farming solutions automate irrigation and fertilization processes. Remote sensing enables large-scale, cost-efficient monitoring of agricultural productivity across diverse terrains.
Focus on Sustainable and Regenerative Agriculture Practices
The Agriculture Analytics Market is increasingly aligned with sustainability goals through tools that support regenerative agriculture. Farmers are adopting analytics to reduce chemical inputs, conserve water, and monitor carbon footprints. It helps identify environmentally friendly practices while maintaining productivity. Governments and retailers are encouraging climate-smart agriculture with data-backed certifications and reporting systems. Analytics platforms now include modules for biodiversity tracking and soil health assessment. This trend reflects a broader industry commitment to eco-conscious production and long-term agricultural resilience.
Market Challenges Analysis
High Cost of Technology Adoption and Limited Infrastructure
The Agriculture Analytics Market faces a significant challenge due to the high initial cost of technology implementation and the lack of supporting infrastructure in many rural regions. Smallholder farmers often struggle to afford advanced tools such as sensors, drones, and analytics platforms. It limits the scalability and accessibility of these solutions in developing economies. Inadequate internet connectivity and unreliable power supply further hinder the real-time use of data-driven systems. Financial constraints and low digital literacy levels create barriers to widespread adoption. Bridging the digital divide remains a critical hurdle for market expansion.
Data Privacy Concerns and Fragmented Standards
The Agriculture Analytics Market is challenged by growing concerns around data ownership, privacy, and inconsistent data standards. Farmers are increasingly cautious about sharing operational data with third-party analytics providers. It raises trust issues that slow down integration and collaboration. The lack of standardized data formats and protocols creates interoperability issues among devices and platforms. These inconsistencies reduce the effectiveness of analytics and complicate system integration. Ensuring secure data usage and establishing clear governance frameworks is essential for market confidence and long-term growth.
Market Opportunities
Expansion of Digital Agriculture in Emerging Markets
The Agriculture Analytics Market holds strong growth potential in emerging economies where digital agriculture is gaining momentum. Governments are promoting smart farming through subsidies, training programs, and rural connectivity initiatives. It opens opportunities for analytics vendors to introduce affordable, localized solutions tailored to regional farming needs. Rising mobile penetration and improving digital literacy are enabling wider adoption. Agritech startups are entering these markets with scalable models and partnerships that support smallholder integration. Expanding infrastructure and policy support create a favorable environment for long-term market development.
Development of Integrated, User-Friendly Analytics Platforms
The Agriculture Analytics Market is poised to benefit from the development of integrated platforms that simplify data interpretation and decision-making. Farmers require intuitive tools that combine multiple data sources—such as weather, soil, crop, and equipment performance—into a single dashboard. It drives demand for plug-and-play systems that reduce the complexity of implementation. Vendors have an opportunity to differentiate by focusing on usability, automation, and mobile compatibility. Cloud-based solutions that support remote advisory services are also gaining traction. These innovations can increase adoption across various scales of farming operations.
Market Segmentation Analysis:
By Offering
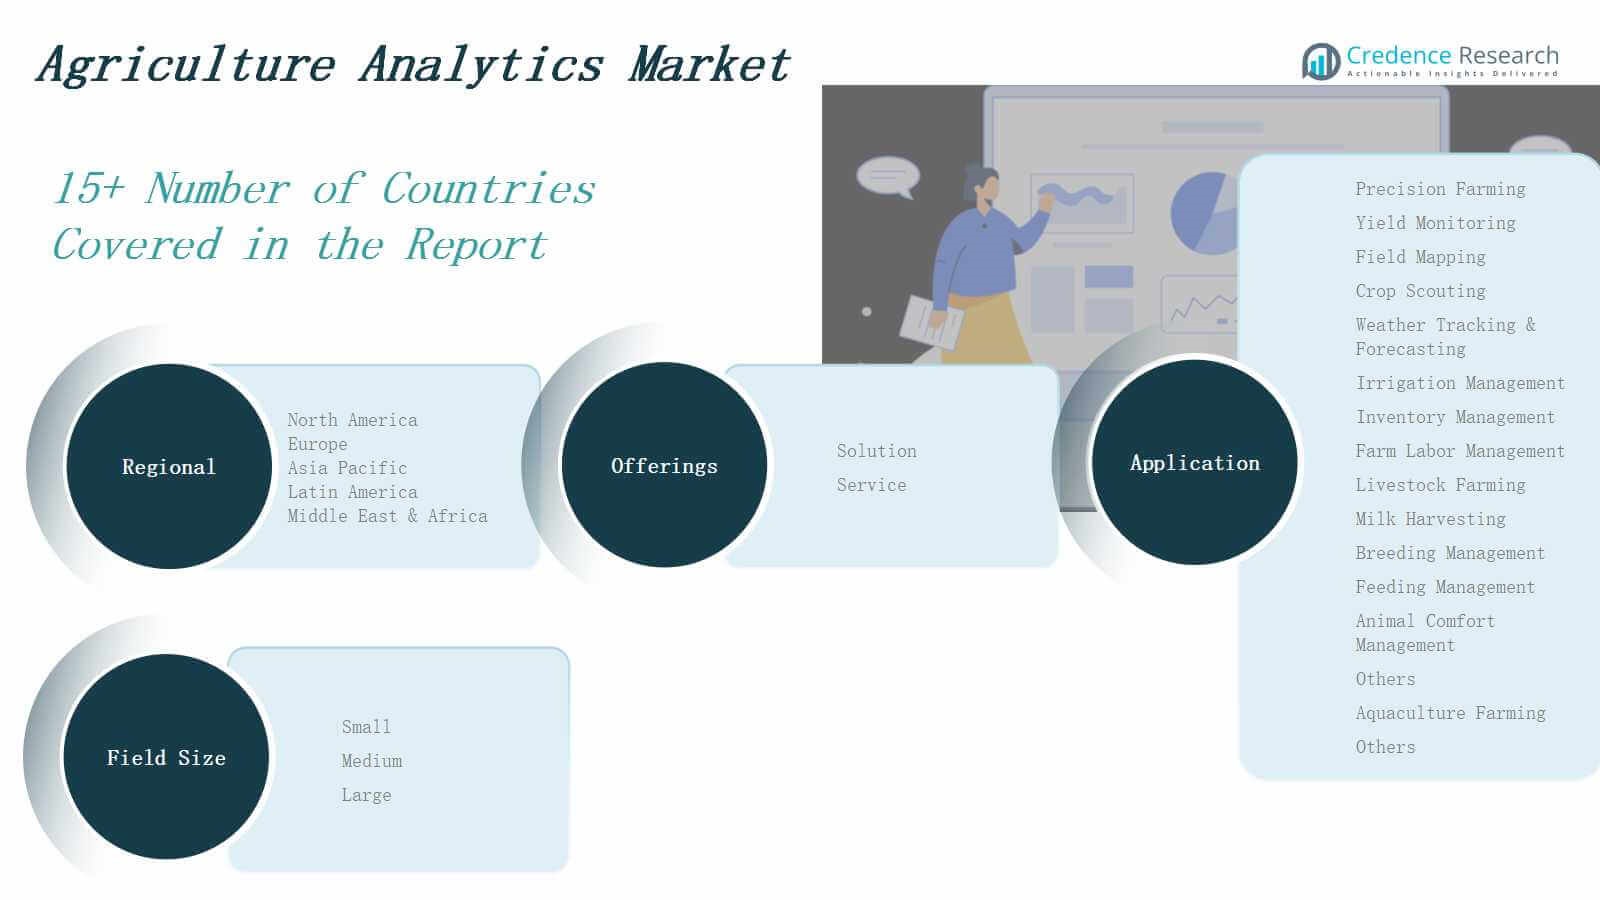
The Agriculture Analytics Market is segmented into solutions and services. Solutions include software platforms that deliver actionable insights for crop, soil, and livestock management, often using real-time data from sensors and drones. Services cover consulting, integration, and support, helping farmers implement and optimize analytics systems. It reflects growing demand for both customizable platforms and expert guidance. Solutions dominate in revenue share due to scalability, while services ensure successful deployment and continuous performance improvement.
- For instance, Trimble Inc. provides cloud-based farm management platforms that integrate real-time data from IoT sensors and drones, enabling predictive analytics for disease detection and irrigation management, with contract values reaching USD 70–80 million.
By Application
The Agriculture Analytics Market spans multiple applications, with precision farming being the most prominent. It includes yield monitoring, field mapping, crop scouting, weather tracking and forecasting, irrigation management, inventory management, and farm labor management. These tools help improve productivity and resource efficiency. In livestock farming, analytics supports milk harvesting, breeding, feeding, and animal comfort management. Aquaculture farming and other segments also use analytics for operational control and sustainability. It enables data-driven decision-making across the agricultural value chain.
- For instance, an Iowa corn farmer used EOSDA Crop Monitoring’s satellite-based yield mapping to identify low-performing zones and applied variable-rate nitrogen, resulting in improved overall yield and more efficient fertilizer use.
By Field Size
Based on field size, the Agriculture Analytics Market is divided into small, medium, and large farms. Large farms lead adoption due to greater resources and capacity to invest in technology. Medium farms are expanding usage rapidly through accessible platforms and government support. Small farms face challenges but represent high growth potential, especially in emerging markets. It caters to diverse needs by offering scalable and adaptable analytics tools suited to different operational scales.
Segments:
Based on Offering
Based on Application
- Precision Farming
- Yield Monitoring
- Field Mapping
- Crop Scouting
- Weather Tracking & Forecasting
- Irrigation Management
- Inventory Management
- Farm Labor Management
- Livestock Farming
- Milk Harvesting
- Breeding Management
- Feeding Management
- Animal Comfort Management
- Others
- Aquaculture Farming
- Others
Based on Field Size
Based on Region
- North America
- Europe
- Germany
- France
- U.K.
- Italy
- Spain
- Rest of Europe
- Asia Pacific
- China
- Japan
- India
- South Korea
- South-east Asia
- Rest of Asia Pacific
- Latin America
- Brazil
- Argentina
- Rest of Latin America
- Middle East & Africa
- GCC Countries
- South Africa
- Rest of the Middle East and Africa
Regional Analysis
North America
The North America Agriculture Analytics Market size was valued at USD 1,705.54 million in 2018 to USD 2,881.17 million in 2024 and is anticipated to reach USD 9,027.59 million by 2032, at a CAGR of 15.4% during the forecast period. The region holds the largest market share due to the early adoption of precision agriculture and high digital infrastructure. It benefits from strong government support, established agritech ecosystems, and significant investments in AI and IoT integration. The U.S. dominates with widespread use of advanced analytics platforms in both crop and livestock farming. Key market players and research institutions actively collaborate on innovation. The region continues to drive global leadership in smart farming practices.
Europe
The Europe Agriculture Analytics Market size was valued at USD 735.21 million in 2018 to USD 1,188.29 million in 2024 and is anticipated to reach USD 3,443.79 million by 2032, at a CAGR of 14.3% during the forecast period. The market benefits from strong regulatory frameworks that promote sustainable agriculture and climate-smart practices. It shows steady adoption of analytics in yield monitoring, weather forecasting, and resource optimization. Countries such as Germany, France, and the Netherlands lead in adoption due to supportive government initiatives and high farming mechanization. The European Union’s Common Agricultural Policy enhances funding and data-sharing frameworks. It drives innovation aligned with environmental and food security goals.
Asia Pacific
The Asia Pacific Agriculture Analytics Market size was valued at USD 921.56 million in 2018 to USD 1,642.10 million in 2024 and is anticipated to reach USD 5,685.98 million by 2032, at a CAGR of 16.9% during the forecast period. Rapid population growth and food demand are pushing countries to adopt smart farming solutions. It sees strong growth across China, India, Japan, and Southeast Asia, where government digital agriculture missions and agritech startups are expanding. Rising smartphone penetration and cloud services enable broader farmer participation. The region is also witnessing integration of low-cost analytics tools tailored for small and medium-sized farms. It presents a high-growth opportunity across diverse agricultural landscapes.
Latin America
The Latin America Agriculture Analytics Market size was valued at USD 192.78 million in 2018 to USD 324.94 million in 2024 and is anticipated to reach USD 927.84 million by 2032, at a CAGR of 14.1% during the forecast period. Brazil and Argentina are the major contributors due to their large-scale commercial farms and expanding agribusiness investments. It is adopting analytics in crop management, climate forecasting, and supply chain optimization. Regional agritech hubs and partnerships with international players support innovation. Connectivity and infrastructure limitations remain challenges, but improving digital access is driving progress. The market is growing steadily with increased interest in yield efficiency and export competitiveness.
Middle East
The Middle East Agriculture Analytics Market size was valued at USD 148.18 million in 2018 to USD 237.26 million in 2024 and is anticipated to reach USD 673.69 million by 2032, at a CAGR of 14.0% during the forecast period. Water scarcity and climate stress drive the demand for smart farming tools and data-based irrigation systems. It is increasingly applying analytics in greenhouse farming and controlled-environment agriculture. Countries like Israel and the UAE lead adoption with advanced agri-tech ecosystems and government support. Analytics enables optimal resource use and productivity in arid conditions. Regional initiatives in food security and sustainability accelerate the shift toward precision agriculture.
Africa
The Africa Agriculture Analytics Market size was valued at USD 76.73 million in 2018 to USD 174.78 million in 2024 and is anticipated to reach USD 468.66 million by 2032, at a CAGR of 12.7% during the forecast period. The market is in its early stages but presents substantial long-term potential. It is gaining traction through public-private partnerships, donor-funded projects, and mobile-based advisory services. Countries like Kenya, Nigeria, and South Africa are investing in digital agriculture platforms. Limited access to infrastructure and capital constrains adoption, especially in rural areas. Targeted support and affordable analytics tools are essential to unlock growth across the region.
Shape Your Report to Specific Countries or Regions & Enjoy 30% Off!
Key Player Analysis
- Trimble Inc.
- IBM Corporation
- Wipro
- SAP SE
- Iteris, Inc.
- Taranis
- Oracle Corporation
- Conservis Corporation
- Geosys Inc.
- Xylem Inc.
- PrecisionHawk
- Gro Intelligence
Competitive Analysis
The Agriculture Analytics Market features a competitive landscape marked by innovation, strategic partnerships, and expanding product portfolios. Key players such as IBM Corporation, Trimble Inc., SAP SE, and Oracle Corporation are investing in AI, IoT, and machine learning to enhance real-time data analytics for precision farming. It reflects intense competition among established tech firms and emerging agritech startups targeting scalable, cloud-based platforms. Companies are focusing on integrating satellite imaging, weather modeling, and supply chain optimization tools into unified solutions. Strategic acquisitions and collaborations with agricultural research institutions are strengthening market positions. Vendors are also tailoring offerings for specific regions and crop types to improve relevance and adoption. The Agriculture Analytics Market encourages continuous innovation, pushing firms to differentiate through advanced features, ease of use, and end-to-end integration. Competitive dynamics are also shaped by efforts to serve smallholder farmers in developing regions through affordable, mobile-compatible analytics platforms.
Recent Developments
- In February 2025, CoStar Group acquired Ag‑Analytics to enhance its agricultural land analytics capabilities by integrating the AcreValue platform into its Land.com network.
- In March 2025, Agmatix partnered with BASF to launch an AI-powered solution for detecting and predicting soybean cyst nematodes, improving pest management analytics.
- In December 2024, xFarm Technologies partnered with Syngenta France to enhance the Quali’Cible tool using geospatial AI, improving crop monitoring and precision agriculture in France.
- In December 2024, ADAMA launched Gilboa™ fungicide, introducing a new mode of action to tackle resistance issues in cereals and oilseed rape.
Market Concentration & Characteristics
The Agriculture Analytics Market exhibits moderate to high market concentration, with a mix of global technology leaders and specialized agritech firms driving innovation. It is characterized by strong investment in AI, IoT, and cloud-based analytics platforms tailored for precision farming, livestock monitoring, and resource management. The market favors vendors that offer scalable, user-friendly solutions capable of integrating diverse data sources such as satellite imagery, soil sensors, and weather forecasts. Strategic collaborations between technology providers, agricultural cooperatives, and research institutions strengthen the competitive landscape. The market is shifting toward platform-based ecosystems that deliver real-time insights and automation. Vendors are focusing on regional customization, mobile accessibility, and affordability to reach small and medium-sized farms, particularly in emerging markets. The Agriculture Analytics Market rewards players with deep technical expertise, strong data integration capabilities, and the ability to demonstrate tangible benefits in yield improvement, cost savings, and environmental sustainability across varied agricultural conditions.
Top of Form
Report Coverage
The research report offers an in-depth analysis based on Offering, Application, Field Size and Region. It details leading market players, providing an overview of their business, product offerings, investments, revenue streams, and key applications. Additionally, the report includes insights into the competitive environment, SWOT analysis, current market trends, as well as the primary drivers and constraints. Furthermore, it discusses various factors that have driven market expansion in recent years. The report also explores market dynamics, regulatory scenarios, and technological advancements that are shaping the industry. It assesses the impact of external factors and global economic changes on market growth. Lastly, it provides strategic recommendations for new entrants and established companies to navigate the complexities of the market.
Future Outlook
- Demand for real-time, AI-powered analytics tools will increase to support precision farming across varied climates and crop types.
- Integration of IoT, drones, and satellite data will expand, enabling more accurate monitoring and forecasting.
- Governments will continue funding digital agriculture programs, promoting wider adoption among small and medium-sized farmers.
- Cloud-based platforms will dominate due to their scalability, accessibility, and ease of integration with farm management systems.
- Adoption will grow rapidly in emerging markets, supported by mobile access, low-cost solutions, and rural connectivity improvements.
- Analytics platforms will evolve to include carbon tracking and sustainability metrics aligned with global climate goals.
- Companies will focus on developing unified platforms that combine crop, livestock, and aquaculture data.
- Data privacy, ownership rights, and standardization will become key regulatory focus areas across regions.
- Strategic partnerships between agritech firms and research institutions will drive innovation and regional customization.
- Predictive analytics will play a central role in managing risks related to weather, pests, and market volatility.


