| REPORT ATTRIBUTE |
DETAILS |
| Historical Period |
2020-2023 |
| Base Year |
2024 |
| Forecast Period |
2025-2032 |
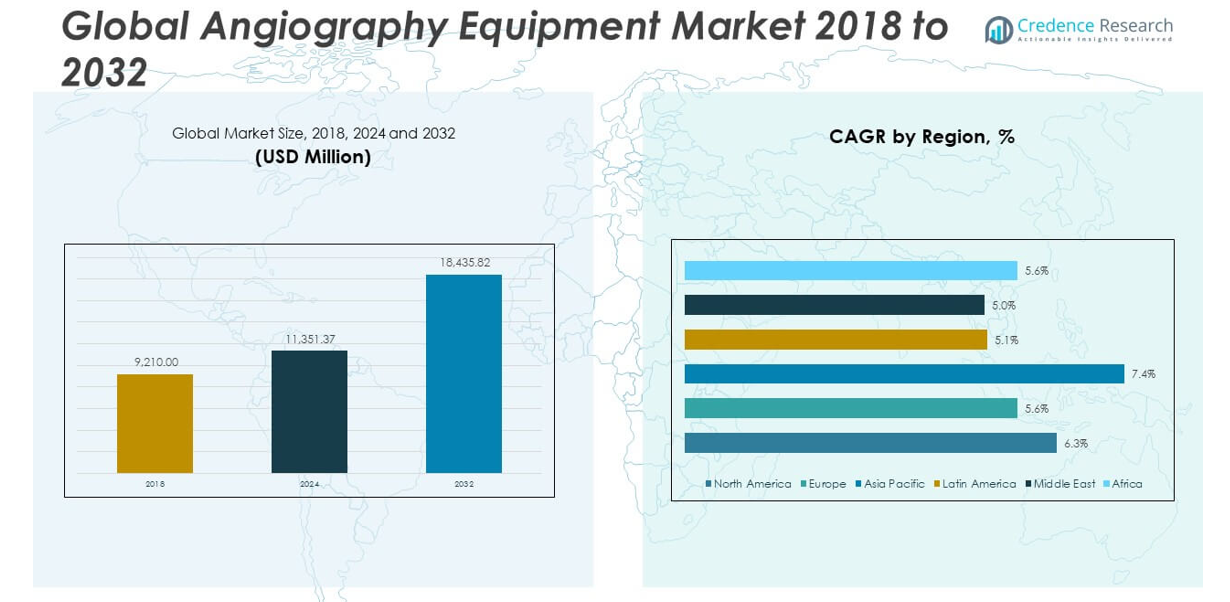
| Angiography Equipment Market Size 2024 |
USD 11,351.37 million |
| Angiography Equipment Market, CAGR |
6.28% |
| Angiography Equipment Market Size 2032 |
USD 18,435.82 million |
Market Overview:
The Angiography Equipment Market size was valued at USD 9,210.00 million in 2018 to USD 11,351.37 million in 2024 and is anticipated to reach USD 18,435.82 million by 2032, at a CAGR of 6.28% during the forecast period.
The angiography equipment market is witnessing strong growth due to the rising global burden of cardiovascular diseases (CVD), which remains the leading cause of death worldwide. This surge in CVD cases, including coronary artery disease, stroke, and peripheral vascular disorders, is driving demand for precise and early diagnostic imaging. Alongside this, a growing elderly population significantly contributes to market expansion, as individuals aged 60 and above are more susceptible to vascular complications. Technological advancements in imaging—such as high-resolution digital angiography systems, hybrid imaging modalities, and AI-based diagnostics—are enhancing diagnostic accuracy, safety, and workflow efficiency, attracting more healthcare providers to upgrade equipment. The market is also benefiting from the global shift toward minimally invasive procedures, which require advanced catheter-based imaging systems. Furthermore, increasing investments in healthcare infrastructure, especially in developing regions, and the expansion of reimbursement policies are accelerating the adoption of state-of-the-art angiography systems across hospitals and diagnostic centers.
North America holds the largest share of the angiography equipment market, driven by a high prevalence of cardiovascular conditions, advanced healthcare infrastructure, and the early adoption of innovative imaging technologies. The U.S. dominates the regional market due to strong public and private healthcare spending, the presence of global manufacturers, and increasing demand for minimally invasive procedures. Europe follows as the second-largest market, with Germany, the U.K., and France at the forefront due to favorable reimbursement systems, research funding, and widespread deployment of hybrid operating rooms. Asia-Pacific is the fastest-growing regional segment, bolstered by rising healthcare investments, government initiatives to improve diagnostic services, and a large patient pool with unmet medical needs in countries like China, India, and Japan. Meanwhile, Latin America and the Middle East & Africa exhibit steady growth, primarily due to expanding hospital infrastructure and improving access to diagnostic imaging services, although market penetration remains lower compared to developed regions.
Market Insights:
- The Angiography Equipment Market was valued at USD 11,351.37 million in 2024 and is projected to reach USD 18,435.82 million by 2032, growing at a CAGR of 6.28%, driven by increasing global demand for early cardiovascular diagnosis.
- Cardiovascular diseases such as coronary artery disease, stroke, and peripheral vascular disorders continue to fuel demand for angiographic imaging systems due to their role in timely and accurate intervention planning.
- An expanding elderly population—more vulnerable to vascular complications—is accelerating the uptake of minimally invasive diagnostic procedures, reinforcing the need for advanced angiography equipment.
- Technological innovations like AI-powered image enhancement, flat-panel detectors, and 3D imaging are improving diagnostic precision, operational efficiency, and safety, prompting hospitals to upgrade their systems.
- Emerging economies are experiencing higher adoption rates supported by government investments, growing healthcare infrastructure, and improving reimbursement models that favor advanced imaging systems.
- Challenges include high capital costs and a shortage of skilled operators, which limit system adoption in smaller or rural facilities and highlight the need for affordable solutions and robust training programs.
- Regionally, North America leads the market with strong infrastructure and early tech adoption, followed by Europe, while Asia-Pacific remains the fastest-growing region due to rising healthcare access and patient volumes.
Access crucial information at unmatched prices!
Request your sample report today & start making informed decisions powered by Credence Research Inc.!
Download Sample
Market Drivers:
Increasing Global Burden of Cardiovascular Diseases Necessitates Advanced Diagnostic Tools
The rising prevalence of cardiovascular diseases (CVD) remains a primary driver for the Angiography Equipment Market. Coronary artery disease, peripheral vascular disorders, and stroke are claiming millions of lives each year, prompting urgent demand for early and accurate diagnosis. Angiography systems provide precise visualization of blood vessels, making them essential for identifying blockages and planning interventions. The global surge in lifestyle-related conditions such as obesity, hypertension, and diabetes is further elevating the risk of vascular diseases. It is encouraging governments and healthcare providers to invest in diagnostic imaging infrastructure. The Angiography Equipment Market continues to benefit from the need to address these public health challenges with timely clinical decision-making.
- For example, Siemens Healthineers ARTIS icono biplane angiography system, introduced in 2024. This system features a rapid 3D imaging capability with a rotation speed of up to 95°/s, enabling syngo DynaCT images to be acquired in just 5 seconds, significantly reducing motion artifacts and contrast media usage. The system also offers a repositioning accuracy of better than 0.5 mm, which is critical for precise interventions.
Growing Geriatric Population Fuels Demand for Minimally Invasive Imaging
The expanding elderly population worldwide significantly contributes to the rising demand for angiographic procedures. People aged 60 and above are more prone to vascular complications, making early detection critical. Minimally invasive angiographic techniques offer reduced recovery times and lower risk, which are particularly beneficial for older patients. Healthcare systems in both developed and developing economies are adapting to aging demographics by expanding access to interventional radiology services. The Angiography Equipment Market supports these systems by providing imaging platforms that align with the diagnostic needs of elderly patients. It plays a critical role in improving outcomes through precision imaging and less invasive care options.
- For example, Canon Medical’s Alphenix Sky 12 HDinterventional system, launched in September 2023, exemplifies innovation for elderly patient care. It incorporates the proprietary HD 76 Hi-Def detector, the world’s first true high-definition detector, which provides more than twice the spatial resolution of standard detectors.
Technological Advancements Drive Clinical Efficiency and Imaging Accuracy
Rapid innovation in imaging technologies is reshaping the Angiography Equipment Market. Integration of flat-panel detectors, AI-powered image enhancement, real-time 3D imaging, and hybrid operating rooms are transforming angiographic procedures. These advancements enable faster diagnostics, reduced radiation exposure, and improved workflow efficiency for clinical teams. Hospitals are upgrading their systems to meet rising procedural volumes while ensuring compliance with regulatory standards. It is accelerating product development cycles and pushing vendors to deliver smarter, integrated solutions. The demand for high-performance, scalable systems is growing as healthcare institutions aim to enhance clinical accuracy and reduce patient risk.
Expanding Healthcare Infrastructure and Supportive Government Initiatives
Investments in healthcare infrastructure, especially in emerging economies, are propelling market growth. Governments are funding public hospitals and diagnostic centers to bridge gaps in access to advanced imaging. Reimbursement frameworks are evolving to support minimally invasive diagnostics, which strengthens the adoption of angiography systems. The Angiography Equipment Market is also gaining traction from private sector involvement in modernizing healthcare facilities. Partnerships between manufacturers and healthcare providers are ensuring equipment availability in underserved regions. It is helping to democratize access to diagnostic care and improve population health management globally.
Market Trends:
Integration of Artificial Intelligence Enhances Image Interpretation and Workflow Automation
Artificial intelligence (AI) is emerging as a key trend in the Angiography Equipment Market, reshaping how clinicians interpret complex vascular images. AI-powered platforms now support automatic detection of vascular anomalies, streamline image reconstruction, and reduce operator dependence. These solutions assist radiologists by enhancing diagnostic precision and enabling real-time image analysis during procedures. AI algorithms also help predict patient outcomes and support personalized treatment planning, improving overall clinical efficiency. It enables faster decision-making while maintaining high diagnostic accuracy in high-pressure clinical environments. The Angiography Equipment Market is responding with AI-integrated systems that combine image acquisition, processing, and analytics in a single platform.
- For example, the AI-ENCODE study at Mayo Clinic, leveraging a dataset of over 20,000 angiograms, validated AI algorithms capable of automatically extracting left ventricular ejection fraction, filling pressures, right ventricular dysfunction, and cardiac index from routine angiograms, achieving area under the receiver operating curve (AUC) values of 0.87, 0.87, 0.80, and 0.82, respectively—metrics that closely match gold-standard echocardiography.
Rising Adoption of Hybrid Operating Rooms for Interventional and Surgical Flexibility
Hospitals are increasingly investing in hybrid operating rooms (ORs), where diagnostic imaging and surgical procedures occur simultaneously. This trend is creating demand for angiography systems that seamlessly integrate with surgical infrastructure. In a hybrid OR, clinicians can perform real-time image-guided procedures without patient transfer, improving safety and outcomes. The Angiography Equipment Market benefits from this shift by offering ceiling-mounted or floor-mounted systems with high maneuverability and 3D visualization. It supports multidisciplinary care teams in performing complex cardiovascular or neurovascular interventions with greater accuracy. The expansion of hybrid ORs underscores the market’s evolution toward multifunctional, space-efficient imaging environments.
- For example, GE Healthcare’s Discovery IGS 730, when integrated with the Getinge MAGNUS table, provides full synchronization between imaging and patient positioning, supporting complex cardiovascular and neurovascular procedures without patient transfer.
Shift Toward Portable and Compact Imaging Systems in Ambulatory Settings
Healthcare providers are increasingly adopting compact and mobile angiography systems that enable diagnostics outside traditional hospital settings. This trend is gaining traction in ambulatory surgical centers, outpatient clinics, and mobile imaging units. The Angiography Equipment Market is witnessing growing demand for lightweight systems with high image resolution and wireless connectivity. These systems provide flexibility in deployment while maintaining core imaging capabilities required for vascular assessments. It aligns with the broader healthcare trend toward decentralization and patient-centric care. Manufacturers are launching portable C-arm and mini-angiography units tailored for quick setup, reduced footprint, and point-of-care imaging.
Emphasis on Low-Dose Imaging to Improve Patient and Operator Safety
Radiation safety is a growing concern across interventional radiology, driving interest in low-dose imaging technologies. Manufacturers are developing systems that reduce radiation exposure while preserving image clarity, especially during lengthy or repeated procedures. The Angiography Equipment Market is responding by integrating advanced dose-reduction software, optimized X-ray beam settings, and real-time monitoring systems. It supports hospitals in complying with international safety standards and minimizing long-term health risks for both patients and clinical staff. Demand for low-dose solutions is particularly strong in pediatric and neurovascular applications, where sensitivity to radiation is higher. This trend highlights the market’s focus on combining safety with technological performance.
Market Challenges Analysis:
High Capital Investment Requirements Limit Adoption Across Resource-Constrained Settings
The high upfront costs associated with angiography systems remain a major challenge for hospitals and diagnostic centers, particularly in developing regions. These systems often require significant capital expenditure not only for procurement but also for installation, maintenance, and operator training. Smaller healthcare facilities and rural providers struggle to justify such investments due to limited patient volumes and restricted budgets. The Angiography Equipment Market faces slower penetration in these areas where funding constraints hinder modernization. It must also address the lack of financial support mechanisms, such as leasing models or government subsidies, which could facilitate broader adoption. Market players must balance innovation with affordability to reach underserved regions.
Shortage of Skilled Operators and Technical Complexity Hinders Optimal Utilization
Operating advanced angiography equipment demands highly trained radiologists, interventional specialists, and technicians. Many healthcare facilities experience a shortage of skilled professionals who can handle complex imaging systems and interpret results with accuracy. The steep learning curve and constant updates in system software and protocols add to the operational burden. The Angiography Equipment Market must overcome these barriers through better training programs and simplified user interfaces. It also faces resistance in regions where professional certification and continuous education in interventional imaging are lacking. Ensuring consistent performance and safety under varying user skill levels remains a key operational hurdle for the market.
Market Opportunities:
Expansion of Healthcare Access in Emerging Economies Unlocks New Growth Potential
The rapid development of healthcare infrastructure in emerging economies presents a strong opportunity for the Angiography Equipment Market. Governments in countries such as India, China, Brazil, and Indonesia are increasing investments in diagnostic imaging and interventional radiology services. Rising public awareness of cardiovascular health and growing demand for minimally invasive procedures support this trend. The Angiography Equipment Market can expand its footprint by offering cost-effective, scalable solutions tailored to mid-tier hospitals and regional diagnostic centers. It can also benefit from public-private partnerships that aim to enhance diagnostic capabilities in underserved regions. The widening healthcare coverage and increased medical insurance penetration further strengthen market prospects.
Technological Innovation in AI and Remote Imaging Enhances Market Reach
Emerging advancements in artificial intelligence and remote imaging workflows open up new applications for angiography systems. AI-enabled software can improve diagnostic accuracy, automate workflows, and support real-time decision-making during image-guided procedures. The Angiography Equipment Market can tap into this demand by developing smart platforms that integrate seamlessly with telehealth and cloud-based systems. It also has the opportunity to address remote and rural healthcare needs through portable, mobile-based solutions. These innovations enable providers to deliver high-quality vascular diagnostics across geographically dispersed populations. The shift toward digital ecosystems and connected healthcare expands the long-term value of angiography solutions.
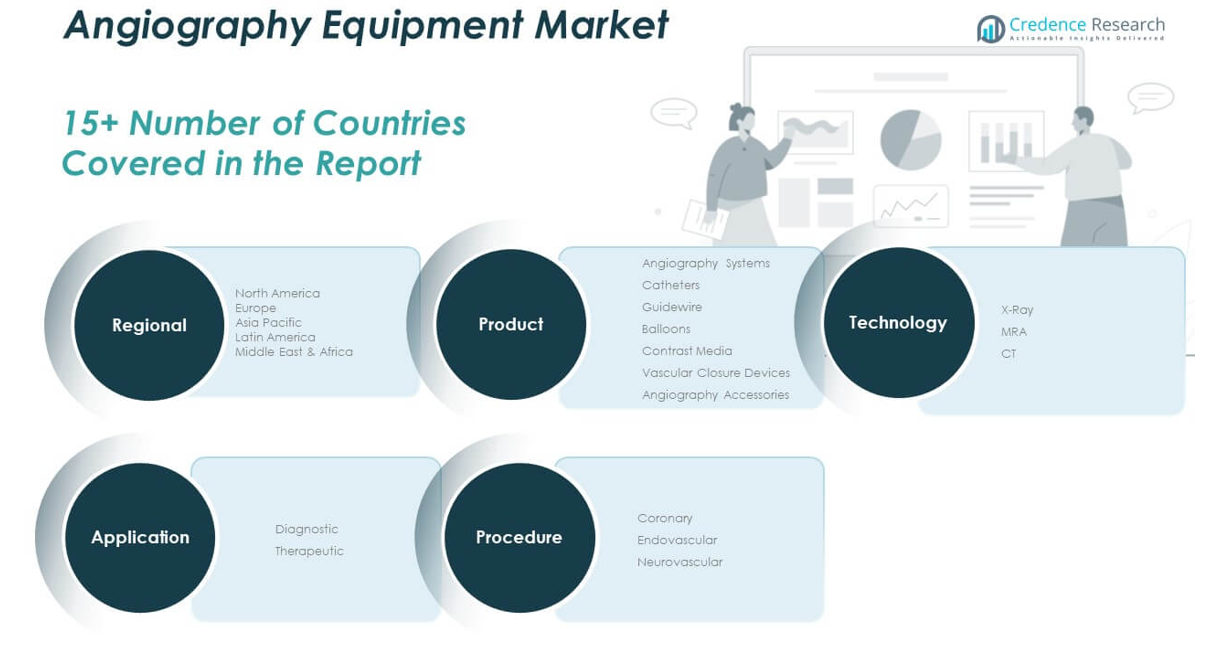
Market Segmentation Analysis:
The Angiography Equipment Market is segmented by product, technology, application, and procedure, reflecting its wide range of clinical uses and technological variations.
By product, angiography systems hold the largest revenue share due to their central role in imaging procedures. Catheters and guidewires follow closely, driven by the increasing volume of minimally invasive interventions. Contrast media and vascular closure devices are essential support tools, while angiography accessories contribute to procedural efficiency and imaging quality.
- For example, for minimally invasive interventions, Boston Scientific’s guidewires and cathetersare widely adopted. Bracco Imaging’s iodinated contrast agents are standard in enhancing vessel visualization, while Abbott’s Perclose ProGlide system is a recognized vascular closure device for post-procedure hemostasis.
By technology, X-ray-based systems dominate the market owing to their reliability, cost-effectiveness, and widespread use in real-time vascular imaging. MRI and CT segments are growing steadily, particularly in complex neurovascular and hybrid imaging applications where detailed anatomical visualization is required.
By application, diagnostic angiography leads the segment due to its critical role in detecting cardiovascular abnormalities. Therapeutic applications are expanding with the rise in interventional procedures.
By procedure, coronary angiography accounts for the highest share, followed by endovascular and neurovascular procedures, driven by increased incidence of heart disease and stroke. The Angiography Equipment Market is evolving with demand for precision imaging across multiple specialties.
- For example, GE Healthcare’s Innova IGS 5 systemis widely used for coronary angiography, the most prevalent angiographic procedure. For endovascular interventions, the Siemens Healthineers ARTIS pheno system is a leading choice due to its precision and flexibility.
Segmentation:
By Product:
- Angiography Systems
- Catheters
- Guidewire
- Balloons
- Contrast Media
- Vascular Closure Devices
- Angiography Accessories
By Technology:
By Application:
By Procedure:
- Coronary
- Endovascular
- Neurovascular
By Region:
- North America
- Europe
- Germany
- France
- U.K.
- Italy
- Spain
- Rest of Europe
- Asia Pacific
- China
- Japan
- India
- South Korea
- South-east Asia
- Rest of Asia Pacific
- Latin America
- Brazil
- Argentina
- Rest of Latin America
- Middle East & Africa
- GCC Countries
- South Africa
- Rest of the Middle East and Africa
Regional Analysis:
The North America Angiography Equipment Market size was valued at USD 3,177.45 million in 2018 to USD 3,866.21 million in 2024 and is anticipated to reach USD 6,256.93 million by 2032, at a CAGR of 6.3% during the forecast period. North America holds the largest share of the global Angiography Equipment Market, accounting for nearly 33% of the total market in 2024. This dominance is driven by the region’s advanced healthcare infrastructure, high healthcare expenditure, and early adoption of innovative imaging technologies. The United States leads the region with a strong demand for minimally invasive cardiovascular procedures and hybrid operating rooms. Presence of key players such as GE Healthcare, Philips, and Siemens supports technological upgrades and clinical training across institutions. It benefits from robust reimbursement policies and increasing focus on preventative diagnostics. The market continues to expand with the growing elderly population and rising procedural volumes in outpatient settings.
The Europe Angiography Equipment Market size was valued at USD 2,643.27 million in 2018 to USD 3,141.75 million in 2024 and is anticipated to reach USD 4,844.06 million by 2032, at a CAGR of 5.6% during the forecast period. Europe holds the second-largest share of the Angiography Equipment Market, contributing around 27% in 2024. Countries such as Germany, the U.K., and France are leading adopters of advanced interventional imaging technologies due to strong clinical research networks and government funding. Growing demand for hybrid ORs and AI-assisted diagnostic systems is influencing hospital procurement strategies. The region benefits from structured reimbursement frameworks and stringent quality regulations that promote the use of high-end imaging systems. It also sees increasing use of angiography in oncology and neurology applications. The rising geriatric population and healthcare digitization initiatives continue to shape market dynamics.
The Asia Pacific Angiography Equipment Market size was valued at USD 2,357.76 million in 2018 to USD 3,029.07 million in 2024 and is anticipated to reach USD 5,363.18 million by 2032, at a CAGR of 7.4% during the forecast period. Asia Pacific is the fastest-growing regional segment in the Angiography Equipment Market, capturing 26% share in 2024. Rapid urbanization, growing awareness of cardiovascular health, and expansion of medical tourism are fueling market demand. China, India, Japan, and South Korea are investing heavily in healthcare infrastructure and imaging modernization. It benefits from a rising middle-class population seeking advanced diagnostics and minimally invasive procedures. Private and public hospitals are increasing procurement of portable and AI-enabled angiography systems. The region’s favorable demographic trends and improving insurance coverage further boost adoption.
The Latin America Angiography Equipment Market size was valued at USD 482.60 million in 2018 to USD 587.89 million in 2024 and is anticipated to reach USD 871.46 million by 2032, at a CAGR of 5.1% during the forecast period. Latin America represents a smaller but steadily expanding share of the Angiography Equipment Market, holding 5% in 2024. Brazil and Mexico are the primary contributors, supported by rising government investment in tertiary care facilities. Increasing incidence of lifestyle-related diseases is prompting greater demand for diagnostic imaging. The region faces challenges such as equipment affordability and uneven access to trained specialists. It is slowly adopting newer systems through public-private partnerships and international funding. Market players see opportunities in mid-sized hospitals seeking cost-effective digital angiography systems.
The Middle East Angiography Equipment Market size was valued at USD 377.61 million in 2018 to USD 438.09 million in 2024 and is anticipated to reach USD 647.20 million by 2032, at a CAGR of 5.0% during the forecast period. The Middle East accounts for nearly 4% of the Angiography Equipment Market and shows consistent demand growth driven by increasing cases of cardiovascular disease. Countries like Saudi Arabia and the UAE are expanding their diagnostic imaging capabilities within public hospitals. It benefits from government-backed initiatives to modernize healthcare services and attract medical tourism. Integration of high-end imaging systems into cardiology and interventional radiology departments is accelerating. Private healthcare providers are key buyers of premium angiography units with digital integration. The market still faces challenges related to equipment maintenance and workforce training.
The Africa Angiography Equipment Market size was valued at USD 171.31 million in 2018 to USD 288.37 million in 2024 and is anticipated to reach USD 452.99 million by 2032, at a CAGR of 5.6% during the forecast period. Africa holds the smallest share in the global Angiography Equipment Market, representing 2% in 2024. However, demand is rising steadily due to increasing investment in diagnostic healthcare and the rising burden of cardiovascular diseases. South Africa, Egypt, and Nigeria are emerging as focus countries for market entry. It faces constraints in terms of infrastructure, affordability, and skilled personnel. Non-governmental health initiatives and donor-funded programs are helping to improve equipment access. The market offers untapped potential for compact and mobile systems tailored for urban and rural deployments.
Shape Your Report to Specific Countries or Regions & Enjoy 30% Off!
Key Player Analysis:
- Medtronic plc
- Boston Scientific Corporation
- AngioDynamics, Inc.
- Abbott
- MicroPort Scientific Corporation
- Braun SE
- Koninklijke Philips N.V.
- GE Healthcare
- Cardinal Health
- Siemens Healthineers AG
- Shimadzu Corporation
Competitive Analysis:
The Angiography Equipment Market is highly competitive, driven by rapid technological advancements and the growing demand for minimally invasive diagnostics. Key players include GE HealthCare, Siemens Healthineers, Philips Healthcare, Canon Medical Systems, and Shimadzu Corporation. These companies focus on product innovation, AI integration, and workflow automation to strengthen their market position. It features a mix of global giants and regional players competing on technology, pricing, and service offerings. Strategic partnerships with hospitals, along with investments in R&D and hybrid imaging platforms, continue to shape competitive dynamics. Emerging companies are entering the market with portable and low-cost systems targeting underserved regions. Competitive advantage in the Angiography Equipment Market increasingly depends on the ability to offer integrated, scalable solutions that enhance procedural efficiency while ensuring patient safety. Companies that align their offerings with evolving clinical needs and regulatory standards are better positioned to capture long-term market share.
Recent Developments:
- In July 2025, Medtronic and Philips announced an expanded multi-year strategic partnership to integrate Medtronic’s next-generation technologies into Philips’ patient monitoring solutions. This collaboration aims to provide healthcare providers with streamlined, comprehensive monitoring systems that incorporate Medtronic’s Nellcor™ pulse oximetry, Microstream™ capnography, and BIS™ brain monitoring technologies.
- In June 2025, GE HealthCare introduced new AI-powered molecular cardiac imaging solutions at the Society of Nuclear Medicine and Molecular Imaging (SNMMI) conference. The suite includes advanced PET/CT and SPECT/CT modalities, featuring Flurpiridaz F‑18 (Flyrcado) tracer for precise myocardial perfusion imaging. GE’s enhancements aim to improve early detection and personalized treatment in cardiology, elevating the clinical capabilities of angiographic diagnostics
- In January 2025, Boston Scientific announced a definitive agreement to acquire Bolt Medical, a developer of an intravascular lithotripsy (IVL) laser-based platform for coronary and peripheral artery disease. The transaction, valued at up to $664 million, is expected to close in the first half of 2025 and will add investigational IVL technology to Boston Scientific’s cardiovascular offerings.
Market Concentration & Characteristics:
The Angiography Equipment Market exhibits moderate to high market concentration, with a few dominant players controlling a significant share of global revenue. It is characterized by continuous innovation, regulatory compliance, and a strong emphasis on clinical efficiency and safety. Leading companies prioritize integrated imaging platforms, AI-enabled diagnostics, and hybrid system capabilities to differentiate their offerings. The market favors vendors with global distribution networks, technical service support, and strong brand recognition. Product lifecycle management and software-driven upgrades are critical for maintaining competitiveness. It also features moderate entry barriers due to high capital requirements, certification processes, and the need for specialized expertise in interventional imaging.
Report Coverage:
The research report offers an in-depth analysis based on product, technology, application, and procedure. It details leading market players, providing an overview of their business, product offerings, investments, revenue streams, and key applications. Additionally, the report includes insights into the competitive environment, SWOT analysis, current market trends, as well as the primary drivers and constraints. Furthermore, it discusses various factors that have driven market expansion in recent years. The report also explores market dynamics, regulatory scenarios, and technological advancements that are shaping the industry. It assesses the impact of external factors and global economic changes on market growth. Lastly, it provides strategic recommendations for new entrants and established companies to navigate the complexities of the market.
Future Outlook:
- Demand for AI-integrated angiography systems will grow to support faster diagnostics and real-time clinical decision-making.
- Portable and compact imaging solutions will gain traction in ambulatory and rural healthcare settings.
- Hybrid operating rooms will become a standard in tertiary care centers, driving multi-functional imaging system adoption.
- Emerging economies will offer strong growth potential due to healthcare infrastructure expansion and rising procedural volumes.
- Focus on radiation dose reduction technologies will intensify, enhancing patient and operator safety.
- Public-private partnerships will facilitate access to advanced imaging systems in underdeveloped regions.
- Cloud-based imaging and remote diagnostics will create new value streams for service providers.
- Regulatory alignment across regions will streamline product approvals and market entry for manufacturers.
- Vendor competition will shift toward offering scalable, software-driven imaging platforms.
- Increased prevalence of neurovascular and oncology interventions will expand application scope beyond cardiology.


