Market Overview:
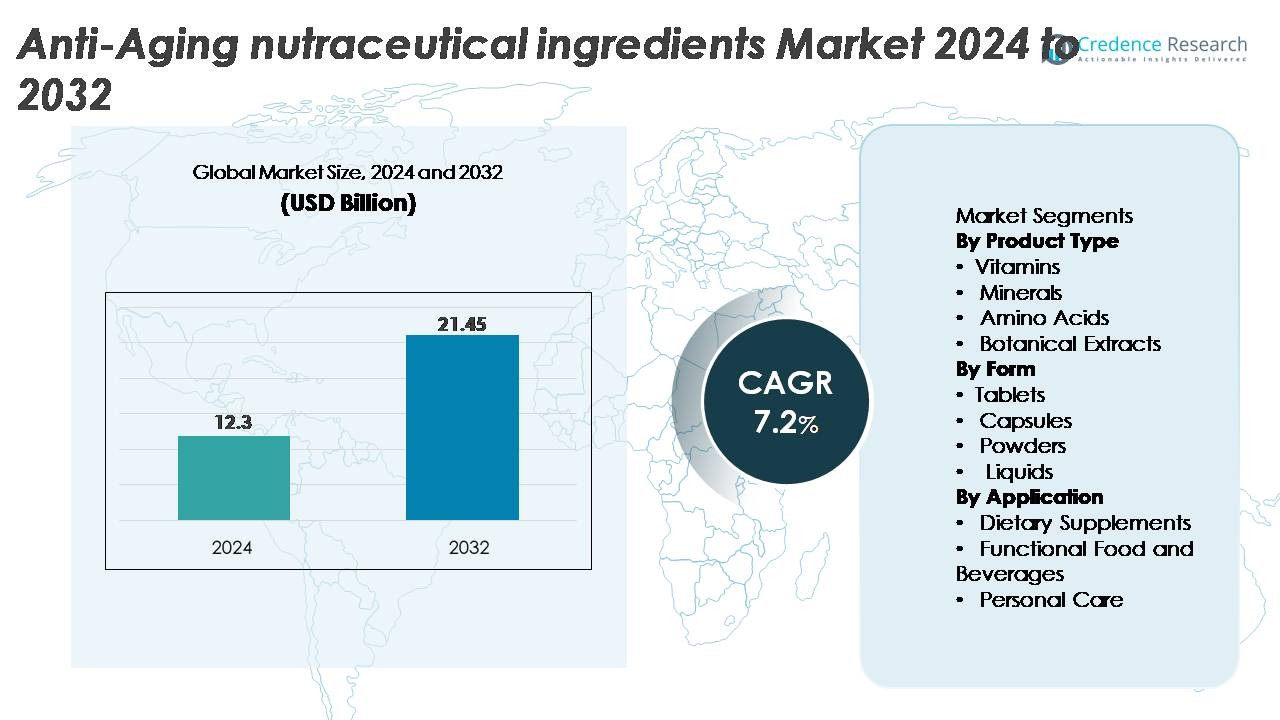
The global anti-aging nutraceutical ingredients market was valued at USD 12.3 billion in 2024 and is projected to reach USD 21.45 billion by 2032, reflecting a CAGR of 7.2% over the forecast period.
| REPORT ATTRIBUTE |
DETAILS |
| Historical Period |
2020-2023 |
| Base Year |
2024 |
| Forecast Period |
2025-2032 |
| Anti-Aging Nutraceutical Ingredients Market Size 2024 |
USD 12.3 Billion |
| Anti-Aging Nutraceutical Ingredients Market, CAGR |
7.2% |
| Anti-Aging Nutraceutical Ingredients Market Size 2032 |
USD 21.45 Billion |
The anti-aging nutraceutical ingredients market is led by major global players such as Glanbia PLC, Pfizer Inc., BASF SE, GNC Holdings, Herbalife Nutrition Ltd., Amway Corporation, Cargill Incorporated, Nestlé S.A., Koninklijke DSM N.V., and The Nature’s Bounty Co. These companies strengthen market competitiveness through advanced ingredient development, clinical validation, and large-scale distribution across supplements, functional foods, and nutricosmetics. North America remains the leading region with a 40% market share, driven by strong consumer adoption of preventive wellness and high purchasing power. Europe follows with 35%, supported by demand for clean-label and scientifically backed ingredients, while Asia-Pacific holds 18%, fueled by rapid expansion of beauty-from-within and collagen-based nutrition.
Access crucial information at unmatched prices!
Request your sample report today & start making informed decisions powered by Credence Research Inc.!
Download Sample
Market Insights
- The anti-aging nutraceutical ingredients market was valued at USD 12.3 billion in 2024 and is projected to reach USD 21.45 billion by 2032, registering a 7.2% CAGR during the forecast period.
- Demand is strongly driven by rising preventive health awareness, increased consumption of vitamins and botanical antioxidants, and growing adoption of nutricosmetics targeting skin elasticity, cellular repair, and overall longevity.
- Key trends include the shift toward clean-label, plant-based, and clinically validated ingredients, alongside advancements in bioavailability technologies and expanding integration of anti-aging actives in functional foods and beverages.
- The competitive landscape features major players such as Glanbia PLC, BASF SE, Pfizer Inc., and DSM, focusing on product innovation, sustainable sourcing, and expansion into high-growth segments like collagen boosters and probiotics.
- Regionally, North America holds 40%, Europe 35%, and Asia-Pacific 18% of the market, while by product type, vitamins lead with 35% share, and by application, dietary supplements dominate with 48%.
Market Segmentation Analysis:
By Product Type:
Vitamins hold the dominant share of the anti-aging nutraceutical ingredients market, accounting for roughly 35% due to their strong clinical validation, high bioavailability, and broad use across supplements and fortified foods. Vitamins C, E, A, and D lead demand as they support collagen synthesis, antioxidant activity, and cellular repair key mechanisms in aging management. Minerals and amino acids continue to expand as consumers prioritize metabolic balance and collagen-building formulations, while botanical extracts gain traction for their natural anti-inflammatory and antioxidant profiles. The rising preference for clean-label, evidence-backed ingredients further strengthens vitamin-led product adoption.
- For instance, DSM-Firmenich produces its Quali-C® vitamin C at a dedicated facility in Dalry, Scotland, with an annual output of roughly 10,000 metric tons, ensuring pharmaceutical-grade purity that enhances absorption and stability in anti-aging formulations.
By Form:
Tablets dominate the market with an estimated 40% share, driven by their convenience, dosage precision, long shelf life, and low cost of manufacturing. They remain the preferred option for multivitamins, antioxidants, and anti-aging complexes. Capsules follow closely, supported by higher consumer acceptance for premium formulations, odor masking, and ingredient protection. Powders register growing demand among consumers seeking customizable intake formats, especially for collagen, protein blends, and botanical extracts. Liquids gain traction in fast-absorption products and functional beverages. Advances in encapsulation, controlled-release systems, and flavor masking continue to support overall segment growth.
- For instance, Lonza’s Capsugel® technologies enable precise encapsulation with its Vcaps® Plus capsules engineered with a moisture content of 4–6%, allowing stable delivery of sensitive bioactives such as vitamins, peptides, and botanical antioxidants. Advances in encapsulation, controlled-release systems, and flavor masking continue to support overall segment growth.
By Application:
Dietary supplements account for the largest share, representing 48% of the anti-aging nutraceutical ingredients market, driven by rising consumer focus on preventive health, longevity, and clinically validated nutrition. Supplements offer targeted benefits for skin elasticity, energy, cognitive function, and oxidative stress reduction, supporting their expanding market penetration. Functional food and beverages steadily grow as brands incorporate vitamins, probiotics, botanical antioxidants, and collagen boosters into daily consumption formats. The personal care segment gains momentum through “beauty-from-within” solutions, where ingestible nutricosmetics complement topical products to enhance hydration, elasticity, and wrinkle reduction.
KEY GROWTH DRIVERS:
Rising Focus on Preventive Health and Longevity Nutrition
The global shift toward preventive health has become a major catalyst for the anti-aging nutraceutical ingredients market. Consumers increasingly seek proactive approaches to maintain vitality, delay age-related degeneration, and enhance long-term wellness. This behavior accelerates demand for vitamins, minerals, antioxidants, peptides, and botanical extracts known for supporting skin integrity, cellular repair, and metabolic balance. Growing awareness about inflammation, oxidative stress, and nutritional deficiencies further promotes regular supplementation across all age groups. Additionally, the expansion of digital health literacy and widespread adoption of self-care routines strengthen consumer reliance on science-backed nutraceutical solutions. As longevity-focused lifestyles gain traction worldwide, brands are responding with clinically substantiated, bioavailable, and multifunctional formulations that address immunity, skin health, cognitive function, and metabolic vitality, solidifying preventive nutrition as a primary growth driver.
- For instance, Nestlé Health Science’s Celltrient™ Cellular Energyformulation utilizes Tru Niagen® (nicotinamide riboside) per serving, a patented NAD⁺ precursor clinically shown to increase cellular NAD⁺ levels. A typical daily dose of 300 mg is shown to increase NAD⁺ levels by over 50% within two weeks, directly supporting cellular energy production and healthy-aging pathways.
Expansion of Nutricosmetics and Beauty-from-Within Solutions
Nutricosmetics have emerged as a high-impact driver as consumers embrace ingestible beauty products to complement topical skincare routines. These formulations deliver targeted benefits such as improved collagen production, enhanced hydration, reduced wrinkles, and improved elasticity outcomes difficult to achieve from topical applications alone. The demand is largely fueled by innovations in bioactive peptides, hyaluronic acid, ceramides, probiotics, and antioxidant-rich botanical extracts. Younger consumers increasingly view ingestible beauty as a daily wellness ritual, while older consumers seek clinically validated anti-aging solutions with measurable results. Social media influence, beauty supplement endorsements, and widespread availability through e-commerce platforms further amplify adoption. As scientific studies continue to validate the efficacy of ingestible ingredients in supporting skin and hair health, beauty-from-within products are becoming a core pillar of anti-aging strategies, significantly expanding market penetration across demographics.
- For instance, Gelita’s VERISOL® collagen peptides have demonstrated significant efficacy, with a clinical study showing a 20% reduction in eye-wrinkle volume after 8 weeks of daily 2.5-gram supplementation, along with measurable improvements in skin elasticity.
Rising Scientific Advancements Enhancing Ingredient Efficacy and Bioavailability
Continuous innovation in ingredient engineering, extraction technologies, and delivery systems is fueling strong market growth. Enhanced bioavailability techniques such as microencapsulation, liposomal delivery, and nanoemulsion significantly improve absorption of vitamins, antioxidants, and botanicals, enabling more potent and faster-acting formulations. Advances in fermentation technology and precision extraction yield highly concentrated amino acids, peptides, and plant-derived compounds with superior functional benefits. Similarly, improved stability technologies extend shelf life and preserve ingredient potency, particularly in sensitive compounds like vitamin C and polyphenols. These developments allow manufacturers to launch differentiated, premium products that offer tangible anti-aging outcomes. The availability of clinically supported, technologically advanced ingredients strengthens consumer trust, encourages repeat purchases, and drives collaboration between nutraceutical companies, cosmetic brands, and biotech innovators, collectively advancing market growth.
KEY TRENDS & OPPORTUNITIES:
Growing Adoption of Personalized Nutrition and DNA-Based Anti-Aging Solutions
Personalized nutrition is transforming the anti-aging nutraceutical industry as consumers increasingly seek tailor-made solutions aligned with their genetics, lifestyle patterns, microbiome profiles, and metabolic needs. The rise of at-home testing kits for DNA, gut microbiota, oxidative stress markers, and nutrient deficiencies enables hyper-targeted supplement recommendations. This trend creates new opportunities for companies offering personalized vitamin packs, peptide blends, amino acid formulations, and botanical combinations optimized for age-related health conditions. AI-driven nutrition platforms further support demand by providing real-time dietary insights and predictive recommendations. As consumers gravitate toward precision wellness, brands focusing on individualized anti-aging programs can deliver superior efficacy, enhance customer loyalty, and command premium pricing. This shift positions personalized anti-aging nutrition as one of the most strategically important growth frontiers.
- For instance, 23andMe’s genomic testing platform analyzes over 600,000 specific genetic markers, which contributes to a massive internal database of genetic and self-reported health data used for large-scale biopharmaceutical research collaborations.
Expansion of Clean-Label, Plant-Based, and Sustainable Ingredient Preferences
Increasing consumer scrutiny over ingredient sourcing, purity, and environmental impact is driving strong opportunities for clean-label and plant-derived anti-aging nutraceuticals. Botanical extracts, phytoceramides, plant-based collagen boosters, and antioxidant-rich superfoods are experiencing rapid adoption, fueled by rising preference for natural, minimally processed, and sustainably produced ingredients. Companies are innovating with eco-friendly extraction methods, organic-certified inputs, and traceable supply chains to appeal to environmentally conscious consumers. Additionally, plant-based alternatives to marine or animal collagen are gaining popularity among vegan and flexitarian users. The clean-label movement also accelerates the removal of artificial colors, preservatives, and fillers from formulations. This trend creates significant opportunities for brands developing transparent, sustainable, and ethically sourced anti-aging nutraceutical solutions.
- For instance, Cargill’s plant-based EpiCor® postbiotic is produced through a 24-hour natural fermentation process using Saccharomyces cerevisiae, yielding a nutrient-dense matrix of metabolites that has been clinically shown to modulate immune and gut health key contributors to healthy aging.
Integration of Nutraceuticals into Functional Foods and Everyday Beverages
The incorporation of anti-aging ingredients into functional foods and beverages presents a major growth opportunity as consumers increasingly prefer wellness benefits from daily consumption formats. Collagen-enriched drinks, vitamin-infused waters, antioxidant smoothies, probiotic yogurts, and nutrient-dense snacks enable effortless integration of anti-aging support into routine diets. Advances in flavor masking, solubility enhancement, and heat-stable ingredient technologies facilitate the seamless addition of vitamins, peptides, and botanicals into food matrices without compromising taste or functionality. This shift aligns with busy lifestyles and growing interest in convenient, on-the-go nutrition. As functional food brands collaborate with nutraceutical manufacturers, the market stands to benefit from new product categories addressing aging-related concerns through accessible, enjoyable formats.
KEY CHALLENGES:
Regulatory Complexity and Ingredient Compliance Across Global Markets
The anti-aging nutraceutical ingredients market faces considerable regulatory challenges due to varying global frameworks governing safety claims, permissible ingredient levels, labeling requirements, and substantiation standards. Regions such as the EU, U.S., and Asia-Pacific maintain strict, often inconsistent rules on botanical extracts, peptides, probiotics, and functional claims related to aging, collagen support, and cellular health. Manufacturers must navigate extensive documentation, clinical evidence expectations, and evolving compliance protocols, which increase cost and delay product launches. Additionally, restrictions on emerging ingredients or novel delivery technologies can limit innovation and market entry. Ensuring regulatory alignment while maintaining product differentiation remains a persistent challenge for both large players and new entrants.
Rising Consumer Skepticism Toward Efficacy and Quality of Anti-Aging Claims
Despite growing market demand, consumer skepticism remains a significant challenge due to concerns about unrealistic claims, inconsistent product quality, and lack of standardized testing. Many consumers struggle to distinguish between clinically validated ingredients and formulations offering limited efficacy, leading to distrust in anti-aging supplements as a category. Variability in ingredient purity, bioavailability, and sourcing further complicates purchasing decisions. Counterfeit and low-quality products sold online also undermine market credibility. To address this, manufacturers must invest in transparent clinical evidence, third-party certifications, and clear communication of functional benefits. Overcoming skepticism is crucial for sustaining brand trust and long-term market growth.
Regional Analysis:
North America — 40%
North America holds 40% of the anti-aging nutraceutical ingredients market due to strong awareness, preventive-health habits, and wide access to premium supplements. The U.S. leads usage because of its advanced nutraceutical ecosystem and growing demand for personalized nutrition. A large aging population, high online supplement sales, and strong interest in beauty-from-within products help the region maintain its dominant share.
Europe — 35%
Europe accounts for 35%, supported by high consumption of clean-label nutraceuticals such as botanicals, probiotics, and collagen boosters. Strict EU regulations promote trust and consistent product quality. Aging demographics and strong interest in preventive wellness across Germany, France, Italy, and the U.K. help sustain the region’s significant market share.
Asia-Pacific — 18%
Asia-Pacific holds 18% and remains the fastest-growing region, driven by rising incomes, urbanization, and strong beauty cultures in Japan, China, South Korea, and India. Demand for collagen, probiotics, herbal extracts, and functional beverages continues to accelerate. Expanding e-commerce and strong innovation momentum support rapid adoption.
Latin America — 5%
Latin America captures 5%, driven by increasing focus on wellness, skin health, and antioxidant-rich supplements. Brazil, Mexico, and Argentina show rising interest in vitamins, botanicals, and probiotics. Wider retail access and growing awareness of nutricosmetics support stable market uptake.
Middle East & Africa — 2%
Middle East & Africa represents 2%, with GCC countries leading due to higher purchasing power and rising interest in premium collagen boosters and vitamins. Growth is supported by increasing health awareness and expanding online retail, despite regulatory differences and limited local production.
Market Segmentations:
By Product Type
- Vitamins
- Minerals
- Amino Acids
- Botanical Extracts
By Form
- Tablets
- Capsules
- Powders
- Liquids
By Application
- Dietary Supplements
- Functional Food and Beverages
- Personal Care
By Geography
- North America
- Europe
- Germany
- France
- U.K.
- Italy
- Spain
- Rest of Europe
- Asia Pacific
- China
- Japan
- India
- South Korea
- South-east Asia
- Rest of Asia Pacific
- Latin America
- Brazil
- Argentina
- Rest of Latin America
- Middle East & Africa
- GCC Countries
- South Africa
- Rest of the Middle East and Africa
Competitive Landscape:
The competitive landscape of the anti-aging nutraceutical ingredients market is characterized by a mix of global nutrition leaders, specialized supplement manufacturers, and vertically integrated wellness brands competing on innovation, clinical validation, and ingredient purity. Major players such as Glanbia PLC, Pfizer Inc., BASF SE, GNC Holdings, Herbalife Nutrition, Amway Corporation, Koninklijke DSM N.V., Nestlé S.A., Cargill Incorporated, and The Nature’s Bounty Co. focus on expanding portfolios of vitamins, amino acids, botanical extracts, collagen enhancers, and antioxidant complexes designed for healthy aging and skin vitality. Companies increasingly invest in advanced bioavailability technologies, clean-label formulations, and sustainable sourcing to differentiate their offerings. Strategic activities including mergers, ingredient innovation, R&D partnerships, and expansion into nutricosmetics further intensify competition. Additionally, strong global distribution networks and rising digital penetration enable brands to scale rapidly across North America, Europe, and Asia-Pacific. As consumer demand for clinically supported, holistic anti-aging solutions accelerates, competition continues to shift toward premium, science-backed formulations.
Shape Your Report to Specific Countries or Regions & Enjoy 30% Off!
Key Player Analysis:
Recent Developments:
- In November 2025, Pfizer introduced a new line of preventive wellness supplements aimed at boosting immunity and overall health, aligning its consumer portfolio more closely with longevity and proactive, healthy-aging nutrition trends.
- In July 2025, Herbalife expanded its beauty-from-within range by launching Herbalife SKIN® Collagen Beauty Booster Unflavored, a collagen-based dietary supplement formulated to nourish skin from within and support elasticity and a youthful appearance.
- In December 2024, Glanbia plc launched a new collagen-based joint health supplement designed to support joint function and mobility, reinforcing its positioning in healthy-aging nutrition and collagen bioactives for long-term musculoskeletal health.
Report Coverage:
The research report offers an in-depth analysis based on Product type, Form, Application and Geography. It details leading market players, providing an overview of their business, product offerings, investments, revenue streams, and key applications. Additionally, the report includes insights into the competitive environment, SWOT analysis, current market trends, as well as the primary drivers and constraints. Furthermore, it discusses various factors that have driven market expansion in recent years. The report also explores market dynamics, regulatory scenarios, and technological advancements that are shaping the industry. It assesses the impact of external factors and global economic changes on market growth. Lastly, it provides strategic recommendations for new entrants and established companies to navigate the complexities of the market.
Future Outlook:
- The market will experience strong growth as consumers increasingly prioritize preventive aging and holistic wellness solutions.
- Demand for clinically validated vitamins, peptides, probiotics, and botanical antioxidants will intensify across supplements and functional foods.
- Nutricosmetics and beauty-from-within products will expand rapidly as younger consumers adopt ingestible beauty routines.
- Personalized nutrition and DNA-based anti-aging formulations will gain traction through digital wellness platforms.
- Advanced delivery technologies such as liposomal, nanoemulsion, and microencapsulation systems will enhance ingredient absorption and efficacy.
- Clean-label, plant-based, and sustainably sourced ingredients will dominate new product development pipelines.
- Functional beverages fortified with collagen, antioxidants, and amino acids will see accelerated adoption.
- Strategic partnerships between nutraceutical manufacturers, biotech firms, and cosmetic brands will reshape innovation cycles.
- Regulatory harmonization and greater emphasis on scientific substantiation will improve product credibility and consumer trust.
- Asia-Pacific will emerge as a major growth engine as urbanization, beauty culture, and consumer spending continue to expand.


