CHAPTER NO. 1 : INTRODUCTION 23
1.1.1. Report Description 23
Purpose of the Report 23
USP & Key Offerings 23
1.1.2. Key Benefits for Stakeholders 23
1.1.3. Target Audience 24
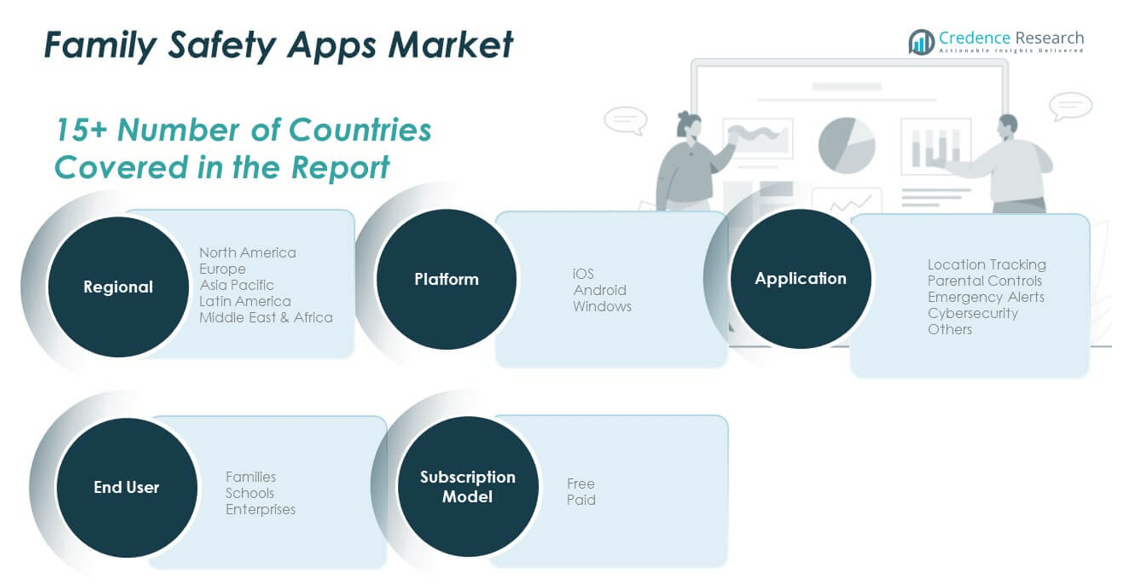
1.1.4. Report Scope 24
1.1.5. Regional Scope 25
CHAPTER NO. 2 : EXECUTIVE SUMMARY 26
2.1. Family Safety Apps Market Snapshot 26
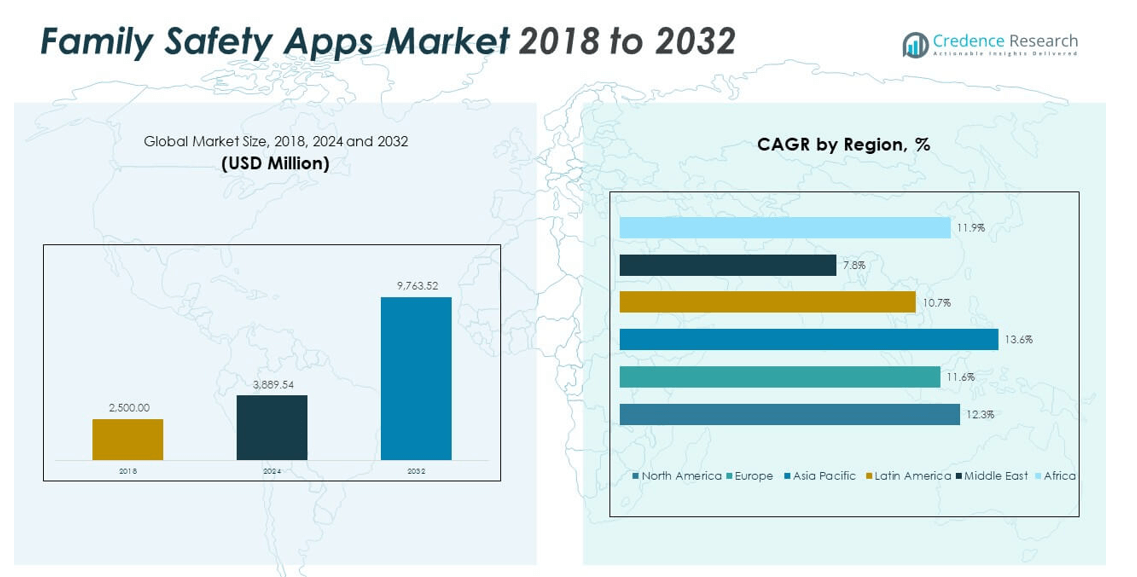
2.1.1. Global Family Safety Apps Market, 2020 – 2033 (USD Million) 27
2.2. Insights from Primary Respondents 28
CHAPTER NO. 3 : GEOPOLITICAL CRISIS IMPACT ANALYSIS 28
3.1. Russia-Ukraine and Israel-Palestine War Impacts 28
CHAPTER NO. 4 : FAMILY SAFETY APPS MARKET – INDUSTRY ANALYSIS 29
4.1. Introduction 29
4.2. Market Drivers 30
4.2.1. Technological Advancements 30
4.2.2. Driving Factor 2 Analysis 31
4.3. Market Restraints 32
4.3.1. Sustainability Challenges 32
4.4. Market Opportunities 33
4.4.1. Market Opportunity Analysis 33
4.5. Porter’s Five Forces Analysis 34
4.6. Value Chain Analysis 35
4.7. Buying Criteria 36
CHAPTER NO. 5 : ANALYSIS COMPETITIVE LANDSCAPE 37
5.1. Company Market Share Analysis – 2024 37
5.1.1. Global Family Safety Apps Market: Company Market Share, by Revenue, 2024 37
5.1.2. Global Family Safety Apps Market: Top 6 Company Market Share, by Revenue, 2024 38
5.1.3. Global Family Safety Apps Market: Top 3 Company Market Share, by Revenue, 2024 38
5.2. Global Family Safety Apps Market Company Revenue Market Share, 2023 39
5.3. Company Assessment Metrics, 2024 40
5.3.1. Stars 40
5.3.2. Emerging Leaders 40
5.3.3. Pervasive Players 40
5.3.4. Participants 40
5.4. Start-ups /SMEs Assessment Metrics, 2024 40
5.4.1. Progressive Companies 40
5.4.2. Responsive Companies 40
5.4.3. Dynamic Companies 40
5.4.4. Starting Blocks 40
5.5. Strategic Developments 41
5.5.1. Acquisitions & Mergers 41
5.5.2. New Product Launch 41
5.5.3. Regional Expansion 41
5.6. Key Players Product Matrix 42
CHAPTER NO. 6 : PESTEL & ADJACENT MARKET ANALYSIS 43
6.1. PESTEL 43
6.1.1. Political Factors 43
6.1.2. Economic Factors 43
6.1.3. Social Factors 43
6.1.4. Technological Factors 43
6.1.5. Environmental Factors 43
6.1.6. Legal Factors 43
6.2. Adjacent Market Analysis 43
CHAPTER NO. 7 : FAMILY SAFETY APPS MARKET – BY PLATFORM SEGMENT ANALYSIS 44
7.1. Family Safety Apps Market Overview, by Platform Segment 44
7.1.1. Family Safety Apps Market Revenue Share, By Platform, 2024 & 2033 44
7.1.2. Family Safety Apps Market Attractiveness Analysis, By Platform 45
7.1.3. Incremental Revenue Growth Opportunity, by Platform, 2026 – 2033 46
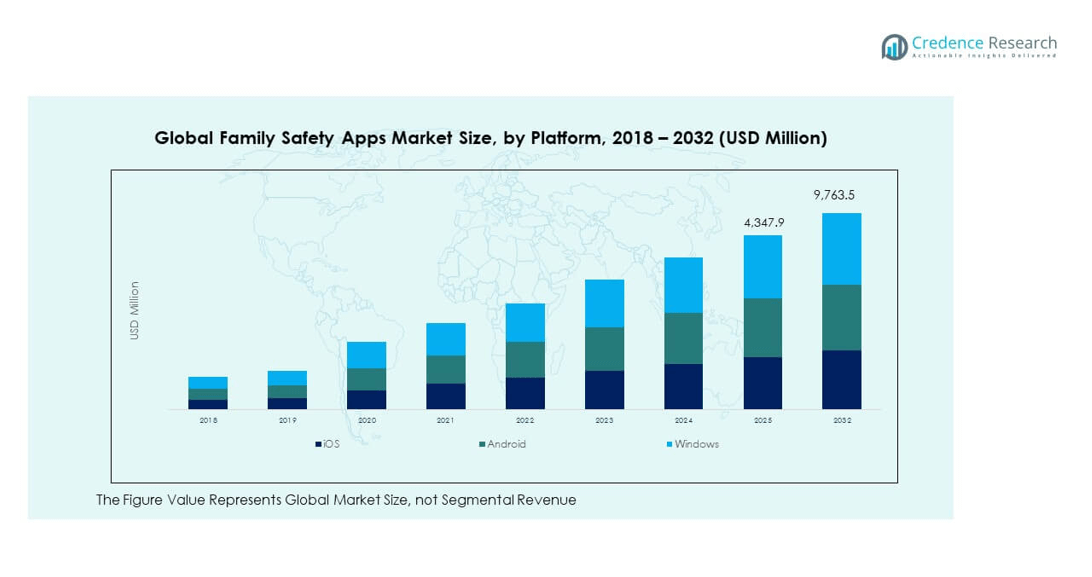
7.1.4. Family Safety Apps Market Revenue, By Platform, 2020, 2024, 2029 & 2033 47
7.2. iOS 48
7.3. Android 49
7.4. Windows 50
CHAPTER NO. 8 : FAMILY SAFETY APPS MARKET – BY APPLICATION SEGMENT ANALYSIS 51
8.1. Family Safety Apps Market Overview, by Application Segment 51
8.1.1. Family Safety Apps Market Revenue Share, By Application, 2024 & 2033 52
8.1.2. Family Safety Apps Market Attractiveness Analysis, By Application 53
8.1.3. Incremental Revenue Growth Opportunity, by Application, 2026 – 2033 54
8.1.4. Family Safety Apps Market Revenue, By Application, 2020, 2024, 2029 & 2033 55
8.2. Location Tracking 56
8.3. Parental Controls 57
8.4. Emergency Alerts 58
8.5. Cybersecurity 59
8.6. Others 60
CHAPTER NO. 9 : FAMILY SAFETY APPS MARKET – BY END-USER SEGMENT ANALYSIS 61
9.1. Family Safety Apps Market Overview, by End-user Segment 61
9.1.1. Family Safety Apps Market Revenue Share, By End-user, 2024 & 2033 62
9.1.2. Family Safety Apps Market Attractiveness Analysis, By End-user 63
9.1.3. Incremental Revenue Growth Opportunity, by End-user, 2026 – 2033 64
9.1.4. Family Safety Apps Market Revenue, By End-user, 2020, 2024, 2029 & 2033 65
9.2. Families 66
9.3. Schools 67
9.4. Enterprises 68
CHAPTER NO. 10 : FAMILY SAFETY APPS MARKET – BY SUBSCRIPTION MODEL SEGMENT ANALYSIS 69
10.1. Family Safety Apps Market Overview, by Subscription Model Segment 69
10.1.1. Family Safety Apps Market Revenue Share, By Subscription Model, 2024 & 2033 70
10.1.2. Family Safety Apps Market Attractiveness Analysis, By Subscription Model 71
10.1.3. Incremental Revenue Growth Opportunity, by Subscription Model, 2026 – 2033 72
10.1.4. Family Safety Apps Market Revenue, By Subscription Model, 2020, 2024, 2029 & 2033 73
10.2. Free 74
10.3. Paid 75
CHAPTER NO. 11 : FAMILY SAFETY APPS MARKET – REGIONAL ANALYSIS 76
11.1. Family Safety Apps Market Overview, by Regional Segments 76
11.2. Region 77
11.2.1. Global Family Safety Apps Market Revenue Share, By Region, 2024 & 2033 77
11.2.2. Family Safety Apps Market Attractiveness Analysis, By Region 78
11.2.3. Incremental Revenue Growth Opportunity, by Region, 2025 – 2033 78
11.2.4. Family Safety Apps Market Revenue, By Region, 2020, 2024, 2029 & 2033 79
CHAPTER NO. 12 : FAMILY SAFETY APPS MARKET – NORTH AMERICA 80
12.1. North America 80
12.1.1. Key Highlights 80
12.1.2. North America Family Safety Apps Market Revenue, By Country, 2020 – 2025 (USD Million) 81
12.1.3. North America Family Safety Apps Market Revenue, By Platform, 2020 – 2025 (USD Million) 82
12.1.4. North America Family Safety Apps Market Revenue, By Application, 2020 – 2025 (USD Million) 83
12.1.5. North America Family Safety Apps Market Revenue, By End-user, 2020 – 2025 (USD Million) 84
12.1.6. North America Family Safety Apps Market Revenue, By Subscription Model, 2020 – 2025 (USD Million) 85
12.2. U.S. 86
12.3. Canada 86
12.4. Mexico 86
CHAPTER NO. 13 : FAMILY SAFETY APPS MARKET – EUROPE 87
13.1. Europe 87
13.1.1. Key Highlights 87
13.1.2. Europe Family Safety Apps Market Revenue, By Country, 2020 – 2025 (USD Million) 88
13.1.3. Europe Family Safety Apps Market Revenue, By Platform, 2020 – 2025 (USD Million) 90
13.1.4. Europe Family Safety Apps Market Revenue, By Application, 2020 – 2025 (USD Million) 91
13.1.5. Europe Family Safety Apps Market Revenue, By End-user, 2020 – 2025 (USD Million) 92
13.1.6. Europe Family Safety Apps Market Revenue, By Subscription Model, 2020 – 2025 (USD Million) 93
13.2. UK 94
13.3. France 94
13.4. Germany 94
13.5. Italy 94
13.6. Spain 94
13.7. Russia 94
13.8. Belgium 94
13.9. Netherland 94
13.10. Austria 94
13.11. Sweden 94
13.12. Poland 94
13.13. Denmark 94
13.14. Switzerland 94
13.15. Rest of Europe 94
CHAPTER NO. 14 : FAMILY SAFETY APPS MARKET – ASIA PACIFIC 95
14.1. Asia Pacific 95
14.1.1. Key Highlights 95
14.1.2. Asia Pacific Family Safety Apps Market Revenue, By Country, 2020 – 2025 (USD Million) 96
14.1.3. Asia Pacific Family Safety Apps Market Revenue, By Platform, 2020 – 2025 (USD Million) 98
14.1.4. Asia Pacific Family Safety Apps Market Revenue, By Application, 2020 – 2025 (USD Million) 99
14.1.5. Asia Pacific Family Safety Apps Market Revenue, By End-user, 2020 – 2025 (USD Million) 100
14.1.6. Asia Pacific Family Safety Apps Market Revenue, By Subscription Model, 2020 – 2025 (USD Million) 101
14.2. China 102
14.3. Japan 102
14.4. South Korea 102
14.5. India 102
14.6. Australia 102
14.7. Thailand 102
14.8. Indonesia 102
14.9. Vietnam 102
14.10. Malaysia 102
14.11. Philippines 102
14.12. Taiwan 102
14.13. Rest of Asia Pacific 102
CHAPTER NO. 15 : FAMILY SAFETY APPS MARKET – LATIN AMERICA 103
15.1. Latin America 103
15.1.1. Key Highlights 103
15.1.2. Latin America Family Safety Apps Market Revenue, By Country, 2020 – 2025 (USD Million) 104
15.1.3. Latin America Family Safety Apps Market Revenue, By Platform, 2020 – 2025 (USD Million) 105
15.1.4. Latin America Family Safety Apps Market Revenue, By Application, 2020 – 2025 (USD Million) 106
15.1.5. Latin America Family Safety Apps Market Revenue, By End-user, 2020 – 2025 (USD Million) 107
15.1.6. Latin America Family Safety Apps Market Revenue, By Subscription Model, 2020 – 2025 (USD Million) 108
15.2. Brazil 109
15.3. Argentina 109
15.4. Peru 109
15.5. Chile 109
15.6. Colombia 109
15.7. Rest of Latin America 109
CHAPTER NO. 16 : FAMILY SAFETY APPS MARKET – MIDDLE EAST 110
16.1. Middle East 110
16.1.1. Key Highlights 110
16.1.2. Middle East Family Safety Apps Market Revenue, By Country, 2020 – 2025 (USD Million) 111
16.1.3. Middle East Family Safety Apps Market Revenue, By Platform, 2020 – 2025 (USD Million) 112
16.1.4. Middle East Family Safety Apps Market Revenue, By Application, 2020 – 2025 (USD Million) 113
16.1.5. Middle East Family Safety Apps Market Revenue, By End-user, 2020 – 2025 (USD Million) 114
16.1.6. Middle East Family Safety Apps Market Revenue, By Subscription Model, 2020 – 2025 (USD Million) 115
16.2. UAE 116
16.3. KSA 116
16.4. Israel 116
16.5. Turkey 116
16.6. Iran 116
16.7. Rest of Middle East 116
CHAPTER NO. 17 : FAMILY SAFETY APPS MARKET – AFRICA 117
17.1. Africa 117
17.1.1. Key Highlights 117
17.1.2. Africa Family Safety Apps Market Revenue, By Country, 2020 – 2025 (USD Million) 118
17.1.3. Africa Family Safety Apps Market Revenue, By Platform, 2020 – 2025 (USD Million) 119
17.1.4. Africa Family Safety Apps Market Revenue, By Application, 2020 – 2025 (USD Million) 120
17.1.5. Africa Family Safety Apps Market Revenue, By End-user, 2020 – 2025 (USD Million) 121
17.1.6. Africa Family Safety Apps Market Revenue, By Subscription Model, 2020 – 2025 (USD Million) 122
17.2. Egypt 123
17.3. Nigeria 123
17.4. Algeria 123
17.5. Morocco 123
17.6. Rest of Africa 123
CHAPTER NO. 18 : COMPANY PROFILES 124
18.1. Life360 124
18.1.1. Company Overview 124
18.1.2. Product Portfolio 124
18.1.3. Financial Overview 124
18.2. Google Family Link 125
18.3. Qustodio 125
18.4. Net Nanny 125
18.5. Norton Family 125
18.6. OurPact 125
18.7. FamilyTime 125
18.8. Screen Time Labs 125
18.9. FamiSafe 125
18.10. Kaspersky Safe Kids 125
18.11. Mobicip 125
18.12. Bark 125
18.13. MMGuardian 125
18.14. ESET Parental Control 125
18.15. Kidslox 125
List of Figures
FIG NO. 1. Global Family Safety Apps Market Volume & Revenue, 2020 – 2033 (USD Million) 27
FIG NO. 2. Porter’s Five Forces Analysis for Global Family Safety Apps Market 34
FIG NO. 3. Value Chain Analysis for Global Family Safety Apps Market 35
FIG NO. 4. Company Share Analysis, 2024 37
FIG NO. 5. Company Share Analysis, 2024 38
FIG NO. 6. Company Share Analysis, 2024 38
FIG NO. 7. Family Safety Apps Market – Company Revenue Market Share, 2023 39
FIG NO. 8. Family Safety Apps Market Revenue Share, By Platform, 2024 & 2033 44
FIG NO. 9. Market Attractiveness Analysis, By Platform 45
FIG NO. 10. Incremental Revenue Growth Opportunity by Platform, 2026 – 2033 46
FIG NO. 11. Family Safety Apps Market Revenue, By Platform, 2020, 2024, 2029 & 2033 47
FIG NO. 12. Global Family Safety Apps Market for iOS, Volume & Revenue (Kilo Tons) (USD Million) 2020 – 2033 48
FIG NO. 13. Global Family Safety Apps Market for Android, Volume & Revenue (Kilo Tons) (USD Million) 2020 – 2033 49
FIG NO. 14. Global Family Safety Apps Market for Windows, Volume & Revenue (Kilo Tons) (USD Million) 2020 – 2033 50
FIG NO. 15. Family Safety Apps Market Revenue Share, By Application, 2024 & 2033 52
FIG NO. 16. Market Attractiveness Analysis, By Application 53
FIG NO. 17. Incremental Revenue Growth Opportunity by Application, 2026 – 2033 54
FIG NO. 18. Family Safety Apps Market Revenue, By Application, 2020, 2024, 2029 & 2033 55
FIG NO. 19. Global Family Safety Apps Market for Location Tracking, Volume & Revenue (Kilo Tons) (USD Million) 2020 – 2033 56
FIG NO. 20. Global Family Safety Apps Market for Parental Controls, Volume & Revenue (Kilo Tons) (USD Million) 2020 – 2033 57
FIG NO. 21. Global Family Safety Apps Market for Emergency Alerts, Volume & Revenue (Kilo Tons) (USD Million) 2020 – 2033 58
FIG NO. 22. Global Family Safety Apps Market for Cybersecurity, Volume & Revenue (Kilo Tons) (USD Million) 2020 – 2033 59
FIG NO. 23. Global Family Safety Apps Market for Others, Volume & Revenue (Kilo Tons) (USD Million) 2020 – 2033 60
FIG NO. 24. Family Safety Apps Market Revenue Share, By End-user, 2024 & 2033 62
FIG NO. 25. Market Attractiveness Analysis, By End-user 63
FIG NO. 26. Incremental Revenue Growth Opportunity by End-user, 2026 – 2033 64
FIG NO. 27. Family Safety Apps Market Revenue, By End-user, 2020, 2024, 2029 & 2033 65
FIG NO. 28. Global Family Safety Apps Market for Families, Volume & Revenue (Kilo Tons) (USD Million) 2020 – 2033 66
FIG NO. 29. Global Family Safety Apps Market for Schools, Volume & Revenue (Kilo Tons) (USD Million) 2020 – 2033 67
FIG NO. 30. Global Family Safety Apps Market for Enterprises, Volume & Revenue (Kilo Tons) (USD Million) 2020 – 2033 68
FIG NO. 31. Family Safety Apps Market Revenue Share, By Subscription Model, 2024 & 2033 70
FIG NO. 32. Market Attractiveness Analysis, By Subscription Model 71
FIG NO. 33. Incremental Revenue Growth Opportunity by Subscription Model, 2026 – 2033 72
FIG NO. 34. Family Safety Apps Market Revenue, By Subscription Model, 2020, 2024, 2029 & 2033 73
FIG NO. 35. Global Family Safety Apps Market for Free, Volume & Revenue (Kilo Tons) (USD Million) 2020 – 2033 74
FIG NO. 36. Global Family Safety Apps Market for Paid, Volume & Revenue (Kilo Tons) (USD Million) 2020 – 2033 75
FIG NO. 37. Global Family Safety Apps Market Revenue Share, By Region, 2024 & 2033 77
FIG NO. 38. Market Attractiveness Analysis, By Region 78
FIG NO. 39. Incremental Revenue Growth Opportunity by Region, 2025 – 2033 78
FIG NO. 40. Family Safety Apps Market Revenue, By Region, 2020, 2024, 2029 & 2033 79
FIG NO. 41. North America Family Safety Apps Market Volume & Revenue, 2020 – 2033 (Kilo Tons) (USD Million) 80
FIG NO. 42. Europe Family Safety Apps Market Volume & Revenue, 2020 – 2033 (Kilo Tons) (USD Million) 87
FIG NO. 43. Asia Pacific Family Safety Apps Market Volume & Revenue, 2020 – 2033 (Kilo Tons) (USD Million) 95
FIG NO. 44. Latin America Family Safety Apps Market Volume & Revenue, 2020 – 2033 (Kilo Tons) (USD Million) 103
FIG NO. 45. Middle East Family Safety Apps Market Volume & Revenue, 2020 – 2033 (Kilo Tons) (USD Million) 110
FIG NO. 46. Africa Family Safety Apps Market Volume & Revenue, 2020 – 2033 (Kilo Tons) (USD Million) 117
List of Tables
TABLE NO. 1. : Global Family Safety Apps Market: Snapshot 26
TABLE NO. 2. : Drivers for the Family Safety Apps Market: Impact Analysis 30
TABLE NO. 3. : Restraints for the Family Safety Apps Market: Impact Analysis 32
TABLE NO. 4. : North America Family Safety Apps Market Revenue, By Country, 2020 – 2025 (USD Million) 81
TABLE NO. 5. : North America Family Safety Apps Market Revenue, By Country, 2026 – 2033 (USD Million) 81
TABLE NO. 6. : North America Family Safety Apps Market Revenue, By Platform, 2020 – 2025 (USD Million) 82
TABLE NO. 7. : North America Family Safety Apps Market Revenue, By Platform, 2026 – 2033 (USD Million) 82
TABLE NO. 8. : North America Family Safety Apps Market Revenue, By Application, 2020 – 2025 (USD Million) 83
TABLE NO. 9. : North America Family Safety Apps Market Revenue, By Application, 2026 – 2033 (USD Million) 83
TABLE NO. 10. : North America Family Safety Apps Market Revenue, By End-user, 2020 – 2025 (USD Million) 84
TABLE NO. 11. : North America Family Safety Apps Market Revenue, By End-user, 2026 – 2033 (USD Million) 84
TABLE NO. 12. : North America Family Safety Apps Market Revenue, By Subscription Model, 2020 – 2025 (USD Million) 85
TABLE NO. 13. : North America Family Safety Apps Market Revenue, By Subscription Model, 2026 – 2033 (USD Million) 85
TABLE NO. 14. : Europe Family Safety Apps Market Revenue, By Country, 2020 – 2025 (USD Million) 88
TABLE NO. 15. : Europe Family Safety Apps Market Revenue, By Country, 2026 – 2033 (USD Million) 89
TABLE NO. 16. : Europe Family Safety Apps Market Revenue, By Platform, 2020 – 2025 (USD Million) 90
TABLE NO. 17. : Europe Family Safety Apps Market Revenue, By Platform, 2026 – 2033 (USD Million) 90
TABLE NO. 18. : Europe Family Safety Apps Market Revenue, By Application, 2020 – 2025 (USD Million) 91
TABLE NO. 19. : Europe Family Safety Apps Market Revenue, By Application, 2026 – 2033 (USD Million) 91
TABLE NO. 20. : Europe Family Safety Apps Market Revenue, By End-user, 2020 – 2025 (USD Million) 92
TABLE NO. 21. : Europe Family Safety Apps Market Revenue, By End-user, 2026 – 2033 (USD Million) 92
TABLE NO. 22. : Europe Family Safety Apps Market Revenue, By Subscription Model, 2020 – 2025 (USD Million) 93
TABLE NO. 23. : Europe Family Safety Apps Market Revenue, By Subscription Model, 2026 – 2033 (USD Million) 93
TABLE NO. 24. : Asia Pacific Family Safety Apps Market Revenue, By Country, 2020 – 2025 (USD Million) 96
TABLE NO. 25. : Asia Pacific Family Safety Apps Market Revenue, By Country, 2026 – 2033 (USD Million) 97
TABLE NO. 26. : Asia Pacific Family Safety Apps Market Revenue, By Platform, 2020 – 2025 (USD Million) 98
TABLE NO. 27. : Asia Pacific Family Safety Apps Market Revenue, By Platform, 2026 – 2033 (USD Million) 98
TABLE NO. 28. : Asia Pacific Family Safety Apps Market Revenue, By Application, 2020 – 2025 (USD Million) 99
TABLE NO. 29. : Asia Pacific Family Safety Apps Market Revenue, By Application, 2026 – 2033 (USD Million) 99
TABLE NO. 30. : Asia Pacific Family Safety Apps Market Revenue, By End-user, 2020 – 2025 (USD Million) 100
TABLE NO. 31. : Asia Pacific Family Safety Apps Market Revenue, By End-user, 2026 – 2033 (USD Million) 100
TABLE NO. 32. : Asia Pacific Family Safety Apps Market Revenue, By Subscription Model, 2020 – 2025 (USD Million) 101
TABLE NO. 33. : Asia Pacific Family Safety Apps Market Revenue, By Subscription Model, 2026 – 2033 (USD Million) 101
TABLE NO. 34. : Latin America Family Safety Apps Market Revenue, By Country, 2020 – 2025 (USD Million) 104
TABLE NO. 35. : Latin America Family Safety Apps Market Revenue, By Country, 2026 – 2033 (USD Million) 104
TABLE NO. 36. : Latin America Family Safety Apps Market Revenue, By Platform, 2020 – 2025 (USD Million) 105
TABLE NO. 37. : Latin America Family Safety Apps Market Revenue, By Platform, 2026 – 2033 (USD Million) 105
TABLE NO. 38. : Latin America Family Safety Apps Market Revenue, By Application, 2020 – 2025 (USD Million) 106
TABLE NO. 39. : Latin America Family Safety Apps Market Revenue, By Application, 2026 – 2033 (USD Million) 106
TABLE NO. 40. : Latin America Family Safety Apps Market Revenue, By End-user, 2020 – 2025 (USD Million) 107
TABLE NO. 41. : Latin America Family Safety Apps Market Revenue, By End-user, 2026 – 2033 (USD Million) 107
TABLE NO. 42. : Latin America Family Safety Apps Market Revenue, By Subscription Model, 2020 – 2025 (USD Million) 108
TABLE NO. 43. : Latin America Family Safety Apps Market Revenue, By Subscription Model, 2026 – 2033 (USD Million) 108
TABLE NO. 44. : Middle East Family Safety Apps Market Revenue, By Country, 2020 – 2025 (USD Million) 111
TABLE NO. 45. : Middle East Family Safety Apps Market Revenue, By Country, 2026 – 2033 (USD Million) 111
TABLE NO. 46. : Middle East Family Safety Apps Market Revenue, By Platform, 2020 – 2025 (USD Million) 112
TABLE NO. 47. : Middle East Family Safety Apps Market Revenue, By Platform, 2026 – 2033 (USD Million) 112
TABLE NO. 48. : Middle East Family Safety Apps Market Revenue, By Application, 2020 – 2025 (USD Million) 113
TABLE NO. 49. : Middle East Family Safety Apps Market Revenue, By Application, 2026 – 2033 (USD Million) 113
TABLE NO. 50. : Middle East Family Safety Apps Market Revenue, By End-user, 2020 – 2025 (USD Million) 114
TABLE NO. 51. : Middle East Family Safety Apps Market Revenue, By End-user, 2026 – 2033 (USD Million) 114
TABLE NO. 52. : Middle East Family Safety Apps Market Revenue, By Subscription Model, 2020 – 2025 (USD Million) 115
TABLE NO. 53. : Middle East Family Safety Apps Market Revenue, By Subscription Model, 2026 – 2033 (USD Million) 115
TABLE NO. 54. : Africa Family Safety Apps Market Revenue, By Country, 2020 – 2025 (USD Million) 118
TABLE NO. 55. : Africa Family Safety Apps Market Revenue, By Country, 2026 – 2033 (USD Million) 118
TABLE NO. 56. : Africa Family Safety Apps Market Revenue, By Platform, 2020 – 2025 (USD Million) 119
TABLE NO. 57. : Africa Family Safety Apps Market Revenue, By Platform, 2026 – 2033 (USD Million) 119
TABLE NO. 58. : Africa Family Safety Apps Market Revenue, By Application, 2020 – 2025 (USD Million) 120
TABLE NO. 59. : Africa Family Safety Apps Market Revenue, By Application, 2026 – 2033 (USD Million) 120
TABLE NO. 60. : Africa Family Safety Apps Market Revenue, By End-user, 2020 – 2025 (USD Million) 121
TABLE NO. 61. : Africa Family Safety Apps Market Revenue, By End-user, 2026 – 2033 (USD Million) 121
TABLE NO. 62. : Africa Family Safety Apps Market Revenue, By Subscription Model, 2020 – 2025 (USD Million) 122
TABLE NO. 63. : Africa Family Safety Apps Market Revenue, By Subscription Model, 2026 – 2033 (USD Million) 122
CHAPTER NO. 1 : INTRODUCTION 23
1.1.1. Report Description 23
Purpose of the Report 23
USP & Key Offerings 23
1.1.2. Key Benefits for Stakeholders 23
1.1.3. Target Audience 24
1.1.4. Report Scope 24
1.1.5. Regional Scope 25
CHAPTER NO. 2 : EXECUTIVE SUMMARY 26
2.1. Family Safety Apps Market Snapshot 26
2.1.1. Global Family Safety Apps Market, 2020 – 2033 (USD Million) 27
2.2. Insights from Primary Respondents 28
CHAPTER NO. 3 : GEOPOLITICAL CRISIS IMPACT ANALYSIS 28
3.1. Russia-Ukraine and Israel-Palestine War Impacts 28
CHAPTER NO. 4 : FAMILY SAFETY APPS MARKET – INDUSTRY ANALYSIS 29
4.1. Introduction 29
4.2. Market Drivers 30
4.2.1. Technological Advancements 30
4.2.2. Driving Factor 2 Analysis 31
4.3. Market Restraints 32
4.3.1. Sustainability Challenges 32
4.4. Market Opportunities 33
4.4.1. Market Opportunity Analysis 33
4.5. Porter’s Five Forces Analysis 34
4.6. Value Chain Analysis 35
4.7. Buying Criteria 36
CHAPTER NO. 5 : ANALYSIS COMPETITIVE LANDSCAPE 37
5.1. Company Market Share Analysis – 2024 37
5.1.1. Global Family Safety Apps Market: Company Market Share, by Revenue, 2024 37
5.1.2. Global Family Safety Apps Market: Top 6 Company Market Share, by Revenue, 2024 38
5.1.3. Global Family Safety Apps Market: Top 3 Company Market Share, by Revenue, 2024 38
5.2. Global Family Safety Apps Market Company Revenue Market Share, 2023 39
5.3. Company Assessment Metrics, 2024 40
5.3.1. Stars 40
5.3.2. Emerging Leaders 40
5.3.3. Pervasive Players 40
5.3.4. Participants 40
5.4. Start-ups /SMEs Assessment Metrics, 2024 40
5.4.1. Progressive Companies 40
5.4.2. Responsive Companies 40
5.4.3. Dynamic Companies 40
5.4.4. Starting Blocks 40
5.5. Strategic Developments 41
5.5.1. Acquisitions & Mergers 41
5.5.2. New Product Launch 41
5.5.3. Regional Expansion 41
5.6. Key Players Product Matrix 42
CHAPTER NO. 6 : PESTEL & ADJACENT MARKET ANALYSIS 43
6.1. PESTEL 43
6.1.1. Political Factors 43
6.1.2. Economic Factors 43
6.1.3. Social Factors 43
6.1.4. Technological Factors 43
6.1.5. Environmental Factors 43
6.1.6. Legal Factors 43
6.2. Adjacent Market Analysis 43
CHAPTER NO. 7 : FAMILY SAFETY APPS MARKET – BY PLATFORM SEGMENT ANALYSIS 44
7.1. Family Safety Apps Market Overview, by Platform Segment 44
7.1.1. Family Safety Apps Market Revenue Share, By Platform, 2024 & 2033 44
7.1.2. Family Safety Apps Market Attractiveness Analysis, By Platform 45
7.1.3. Incremental Revenue Growth Opportunity, by Platform, 2026 – 2033 46
7.1.4. Family Safety Apps Market Revenue, By Platform, 2020, 2024, 2029 & 2033 47
7.2. iOS 48
7.3. Android 49
7.4. Windows 50
CHAPTER NO. 8 : FAMILY SAFETY APPS MARKET – BY APPLICATION SEGMENT ANALYSIS 51
8.1. Family Safety Apps Market Overview, by Application Segment 51
8.1.1. Family Safety Apps Market Revenue Share, By Application, 2024 & 2033 52
8.1.2. Family Safety Apps Market Attractiveness Analysis, By Application 53
8.1.3. Incremental Revenue Growth Opportunity, by Application, 2026 – 2033 54
8.1.4. Family Safety Apps Market Revenue, By Application, 2020, 2024, 2029 & 2033 55
8.2. Location Tracking 56
8.3. Parental Controls 57
8.4. Emergency Alerts 58
8.5. Cybersecurity 59
8.6. Others 60
CHAPTER NO. 9 : FAMILY SAFETY APPS MARKET – BY END-USER SEGMENT ANALYSIS 61
9.1. Family Safety Apps Market Overview, by End-user Segment 61
9.1.1. Family Safety Apps Market Revenue Share, By End-user, 2024 & 2033 62
9.1.2. Family Safety Apps Market Attractiveness Analysis, By End-user 63
9.1.3. Incremental Revenue Growth Opportunity, by End-user, 2026 – 2033 64
9.1.4. Family Safety Apps Market Revenue, By End-user, 2020, 2024, 2029 & 2033 65
9.2. Families 66
9.3. Schools 67
9.4. Enterprises 68
CHAPTER NO. 10 : FAMILY SAFETY APPS MARKET – BY SUBSCRIPTION MODEL SEGMENT ANALYSIS 69
10.1. Family Safety Apps Market Overview, by Subscription Model Segment 69
10.1.1. Family Safety Apps Market Revenue Share, By Subscription Model, 2024 & 2033 70
10.1.2. Family Safety Apps Market Attractiveness Analysis, By Subscription Model 71
10.1.3. Incremental Revenue Growth Opportunity, by Subscription Model, 2026 – 2033 72
10.1.4. Family Safety Apps Market Revenue, By Subscription Model, 2020, 2024, 2029 & 2033 73
10.2. Free 74
10.3. Paid 75
CHAPTER NO. 11 : FAMILY SAFETY APPS MARKET – REGIONAL ANALYSIS 76
11.1. Family Safety Apps Market Overview, by Regional Segments 76
11.2. Region 77
11.2.1. Global Family Safety Apps Market Revenue Share, By Region, 2024 & 2033 77
11.2.2. Family Safety Apps Market Attractiveness Analysis, By Region 78
11.2.3. Incremental Revenue Growth Opportunity, by Region, 2025 – 2033 78
11.2.4. Family Safety Apps Market Revenue, By Region, 2020, 2024, 2029 & 2033 79
CHAPTER NO. 12 : FAMILY SAFETY APPS MARKET – NORTH AMERICA 80
12.1. North America 80
12.1.1. Key Highlights 80
12.1.2. North America Family Safety Apps Market Revenue, By Country, 2020 – 2025 (USD Million) 81
12.1.3. North America Family Safety Apps Market Revenue, By Platform, 2020 – 2025 (USD Million) 82
12.1.4. North America Family Safety Apps Market Revenue, By Application, 2020 – 2025 (USD Million) 83
12.1.5. North America Family Safety Apps Market Revenue, By End-user, 2020 – 2025 (USD Million) 84
12.1.6. North America Family Safety Apps Market Revenue, By Subscription Model, 2020 – 2025 (USD Million) 85
12.2. U.S. 86
12.3. Canada 86
12.4. Mexico 86
CHAPTER NO. 13 : FAMILY SAFETY APPS MARKET – EUROPE 87
13.1. Europe 87
13.1.1. Key Highlights 87
13.1.2. Europe Family Safety Apps Market Revenue, By Country, 2020 – 2025 (USD Million) 88
13.1.3. Europe Family Safety Apps Market Revenue, By Platform, 2020 – 2025 (USD Million) 90
13.1.4. Europe Family Safety Apps Market Revenue, By Application, 2020 – 2025 (USD Million) 91
13.1.5. Europe Family Safety Apps Market Revenue, By End-user, 2020 – 2025 (USD Million) 92
13.1.6. Europe Family Safety Apps Market Revenue, By Subscription Model, 2020 – 2025 (USD Million) 93
13.2. UK 94
13.3. France 94
13.4. Germany 94
13.5. Italy 94
13.6. Spain 94
13.7. Russia 94
13.8. Belgium 94
13.9. Netherland 94
13.10. Austria 94
13.11. Sweden 94
13.12. Poland 94
13.13. Denmark 94
13.14. Switzerland 94
13.15. Rest of Europe 94
CHAPTER NO. 14 : FAMILY SAFETY APPS MARKET – ASIA PACIFIC 95
14.1. Asia Pacific 95
14.1.1. Key Highlights 95
14.1.2. Asia Pacific Family Safety Apps Market Revenue, By Country, 2020 – 2025 (USD Million) 96
14.1.3. Asia Pacific Family Safety Apps Market Revenue, By Platform, 2020 – 2025 (USD Million) 98
14.1.4. Asia Pacific Family Safety Apps Market Revenue, By Application, 2020 – 2025 (USD Million) 99
14.1.5. Asia Pacific Family Safety Apps Market Revenue, By End-user, 2020 – 2025 (USD Million) 100
14.1.6. Asia Pacific Family Safety Apps Market Revenue, By Subscription Model, 2020 – 2025 (USD Million) 101
14.2. China 102
14.3. Japan 102
14.4. South Korea 102
14.5. India 102
14.6. Australia 102
14.7. Thailand 102
14.8. Indonesia 102
14.9. Vietnam 102
14.10. Malaysia 102
14.11. Philippines 102
14.12. Taiwan 102
14.13. Rest of Asia Pacific 102
CHAPTER NO. 15 : FAMILY SAFETY APPS MARKET – LATIN AMERICA 103
15.1. Latin America 103
15.1.1. Key Highlights 103
15.1.2. Latin America Family Safety Apps Market Revenue, By Country, 2020 – 2025 (USD Million) 104
15.1.3. Latin America Family Safety Apps Market Revenue, By Platform, 2020 – 2025 (USD Million) 105
15.1.4. Latin America Family Safety Apps Market Revenue, By Application, 2020 – 2025 (USD Million) 106
15.1.5. Latin America Family Safety Apps Market Revenue, By End-user, 2020 – 2025 (USD Million) 107
15.1.6. Latin America Family Safety Apps Market Revenue, By Subscription Model, 2020 – 2025 (USD Million) 108
15.2. Brazil 109
15.3. Argentina 109
15.4. Peru 109
15.5. Chile 109
15.6. Colombia 109
15.7. Rest of Latin America 109
CHAPTER NO. 16 : FAMILY SAFETY APPS MARKET – MIDDLE EAST 110
16.1. Middle East 110
16.1.1. Key Highlights 110
16.1.2. Middle East Family Safety Apps Market Revenue, By Country, 2020 – 2025 (USD Million) 111
16.1.3. Middle East Family Safety Apps Market Revenue, By Platform, 2020 – 2025 (USD Million) 112
16.1.4. Middle East Family Safety Apps Market Revenue, By Application, 2020 – 2025 (USD Million) 113
16.1.5. Middle East Family Safety Apps Market Revenue, By End-user, 2020 – 2025 (USD Million) 114
16.1.6. Middle East Family Safety Apps Market Revenue, By Subscription Model, 2020 – 2025 (USD Million) 115
16.2. UAE 116
16.3. KSA 116
16.4. Israel 116
16.5. Turkey 116
16.6. Iran 116
16.7. Rest of Middle East 116
CHAPTER NO. 17 : FAMILY SAFETY APPS MARKET – AFRICA 117
17.1. Africa 117
17.1.1. Key Highlights 117
17.1.2. Africa Family Safety Apps Market Revenue, By Country, 2020 – 2025 (USD Million) 118
17.1.3. Africa Family Safety Apps Market Revenue, By Platform, 2020 – 2025 (USD Million) 119
17.1.4. Africa Family Safety Apps Market Revenue, By Application, 2020 – 2025 (USD Million) 120
17.1.5. Africa Family Safety Apps Market Revenue, By End-user, 2020 – 2025 (USD Million) 121
17.1.6. Africa Family Safety Apps Market Revenue, By Subscription Model, 2020 – 2025 (USD Million) 122
17.2. Egypt 123
17.3. Nigeria 123
17.4. Algeria 123
17.5. Morocco 123
17.6. Rest of Africa 123
CHAPTER NO. 18 : COMPANY PROFILES 124
18.1. Life360 124
18.1.1. Company Overview 124
18.1.2. Product Portfolio 124
18.1.3. Financial Overview 124
18.2. Google Family Link 125
18.3. Qustodio 125
18.4. Net Nanny 125
18.5. Norton Family 125
18.6. OurPact 125
18.7. FamilyTime 125
18.8. Screen Time Labs 125
18.9. FamiSafe 125
18.10. Kaspersky Safe Kids 125
18.11. Mobicip 125
18.12. Bark 125
18.13. MMGuardian 125
18.14. ESET Parental Control 125
18.15. Kidslox 125
List of Figures
FIG NO. 1. Global Family Safety Apps Market Volume & Revenue, 2020 – 2033 (USD Million) 27
FIG NO. 2. Porter’s Five Forces Analysis for Global Family Safety Apps Market 34
FIG NO. 3. Value Chain Analysis for Global Family Safety Apps Market 35
FIG NO. 4. Company Share Analysis, 2024 37
FIG NO. 5. Company Share Analysis, 2024 38
FIG NO. 6. Company Share Analysis, 2024 38
FIG NO. 7. Family Safety Apps Market – Company Revenue Market Share, 2023 39
FIG NO. 8. Family Safety Apps Market Revenue Share, By Platform, 2024 & 2033 44
FIG NO. 9. Market Attractiveness Analysis, By Platform 45
FIG NO. 10. Incremental Revenue Growth Opportunity by Platform, 2026 – 2033 46
FIG NO. 11. Family Safety Apps Market Revenue, By Platform, 2020, 2024, 2029 & 2033 47
FIG NO. 12. Global Family Safety Apps Market for iOS, Volume & Revenue (Kilo Tons) (USD Million) 2020 – 2033 48
FIG NO. 13. Global Family Safety Apps Market for Android, Volume & Revenue (Kilo Tons) (USD Million) 2020 – 2033 49
FIG NO. 14. Global Family Safety Apps Market for Windows, Volume & Revenue (Kilo Tons) (USD Million) 2020 – 2033 50
FIG NO. 15. Family Safety Apps Market Revenue Share, By Application, 2024 & 2033 52
FIG NO. 16. Market Attractiveness Analysis, By Application 53
FIG NO. 17. Incremental Revenue Growth Opportunity by Application, 2026 – 2033 54
FIG NO. 18. Family Safety Apps Market Revenue, By Application, 2020, 2024, 2029 & 2033 55
FIG NO. 19. Global Family Safety Apps Market for Location Tracking, Volume & Revenue (Kilo Tons) (USD Million) 2020 – 2033 56
FIG NO. 20. Global Family Safety Apps Market for Parental Controls, Volume & Revenue (Kilo Tons) (USD Million) 2020 – 2033 57
FIG NO. 21. Global Family Safety Apps Market for Emergency Alerts, Volume & Revenue (Kilo Tons) (USD Million) 2020 – 2033 58
FIG NO. 22. Global Family Safety Apps Market for Cybersecurity, Volume & Revenue (Kilo Tons) (USD Million) 2020 – 2033 59
FIG NO. 23. Global Family Safety Apps Market for Others, Volume & Revenue (Kilo Tons) (USD Million) 2020 – 2033 60
FIG NO. 24. Family Safety Apps Market Revenue Share, By End-user, 2024 & 2033 62
FIG NO. 25. Market Attractiveness Analysis, By End-user 63
FIG NO. 26. Incremental Revenue Growth Opportunity by End-user, 2026 – 2033 64
FIG NO. 27. Family Safety Apps Market Revenue, By End-user, 2020, 2024, 2029 & 2033 65
FIG NO. 28. Global Family Safety Apps Market for Families, Volume & Revenue (Kilo Tons) (USD Million) 2020 – 2033 66
FIG NO. 29. Global Family Safety Apps Market for Schools, Volume & Revenue (Kilo Tons) (USD Million) 2020 – 2033 67
FIG NO. 30. Global Family Safety Apps Market for Enterprises, Volume & Revenue (Kilo Tons) (USD Million) 2020 – 2033 68
FIG NO. 31. Family Safety Apps Market Revenue Share, By Subscription Model, 2024 & 2033 70
FIG NO. 32. Market Attractiveness Analysis, By Subscription Model 71
FIG NO. 33. Incremental Revenue Growth Opportunity by Subscription Model, 2026 – 2033 72
FIG NO. 34. Family Safety Apps Market Revenue, By Subscription Model, 2020, 2024, 2029 & 2033 73
FIG NO. 35. Global Family Safety Apps Market for Free, Volume & Revenue (Kilo Tons) (USD Million) 2020 – 2033 74
FIG NO. 36. Global Family Safety Apps Market for Paid, Volume & Revenue (Kilo Tons) (USD Million) 2020 – 2033 75
FIG NO. 37. Global Family Safety Apps Market Revenue Share, By Region, 2024 & 2033 77
FIG NO. 38. Market Attractiveness Analysis, By Region 78
FIG NO. 39. Incremental Revenue Growth Opportunity by Region, 2025 – 2033 78
FIG NO. 40. Family Safety Apps Market Revenue, By Region, 2020, 2024, 2029 & 2033 79
FIG NO. 41. North America Family Safety Apps Market Volume & Revenue, 2020 – 2033 (Kilo Tons) (USD Million) 80
FIG NO. 42. Europe Family Safety Apps Market Volume & Revenue, 2020 – 2033 (Kilo Tons) (USD Million) 87
FIG NO. 43. Asia Pacific Family Safety Apps Market Volume & Revenue, 2020 – 2033 (Kilo Tons) (USD Million) 95
FIG NO. 44. Latin America Family Safety Apps Market Volume & Revenue, 2020 – 2033 (Kilo Tons) (USD Million) 103
FIG NO. 45. Middle East Family Safety Apps Market Volume & Revenue, 2020 – 2033 (Kilo Tons) (USD Million) 110
FIG NO. 46. Africa Family Safety Apps Market Volume & Revenue, 2020 – 2033 (Kilo Tons) (USD Million) 117
List of Tables
TABLE NO. 1. : Global Family Safety Apps Market: Snapshot 26
TABLE NO. 2. : Drivers for the Family Safety Apps Market: Impact Analysis 30
TABLE NO. 3. : Restraints for the Family Safety Apps Market: Impact Analysis 32
TABLE NO. 4. : North America Family Safety Apps Market Revenue, By Country, 2020 – 2025 (USD Million) 81
TABLE NO. 5. : North America Family Safety Apps Market Revenue, By Country, 2026 – 2033 (USD Million) 81
TABLE NO. 6. : North America Family Safety Apps Market Revenue, By Platform, 2020 – 2025 (USD Million) 82
TABLE NO. 7. : North America Family Safety Apps Market Revenue, By Platform, 2026 – 2033 (USD Million) 82
TABLE NO. 8. : North America Family Safety Apps Market Revenue, By Application, 2020 – 2025 (USD Million) 83
TABLE NO. 9. : North America Family Safety Apps Market Revenue, By Application, 2026 – 2033 (USD Million) 83
TABLE NO. 10. : North America Family Safety Apps Market Revenue, By End-user, 2020 – 2025 (USD Million) 84
TABLE NO. 11. : North America Family Safety Apps Market Revenue, By End-user, 2026 – 2033 (USD Million) 84
TABLE NO. 12. : North America Family Safety Apps Market Revenue, By Subscription Model, 2020 – 2025 (USD Million) 85
TABLE NO. 13. : North America Family Safety Apps Market Revenue, By Subscription Model, 2026 – 2033 (USD Million) 85
TABLE NO. 14. : Europe Family Safety Apps Market Revenue, By Country, 2020 – 2025 (USD Million) 88
TABLE NO. 15. : Europe Family Safety Apps Market Revenue, By Country, 2026 – 2033 (USD Million) 89
TABLE NO. 16. : Europe Family Safety Apps Market Revenue, By Platform, 2020 – 2025 (USD Million) 90
TABLE NO. 17. : Europe Family Safety Apps Market Revenue, By Platform, 2026 – 2033 (USD Million) 90
TABLE NO. 18. : Europe Family Safety Apps Market Revenue, By Application, 2020 – 2025 (USD Million) 91
TABLE NO. 19. : Europe Family Safety Apps Market Revenue, By Application, 2026 – 2033 (USD Million) 91
TABLE NO. 20. : Europe Family Safety Apps Market Revenue, By End-user, 2020 – 2025 (USD Million) 92
TABLE NO. 21. : Europe Family Safety Apps Market Revenue, By End-user, 2026 – 2033 (USD Million) 92
TABLE NO. 22. : Europe Family Safety Apps Market Revenue, By Subscription Model, 2020 – 2025 (USD Million) 93
TABLE NO. 23. : Europe Family Safety Apps Market Revenue, By Subscription Model, 2026 – 2033 (USD Million) 93
TABLE NO. 24. : Asia Pacific Family Safety Apps Market Revenue, By Country, 2020 – 2025 (USD Million) 96
TABLE NO. 25. : Asia Pacific Family Safety Apps Market Revenue, By Country, 2026 – 2033 (USD Million) 97
TABLE NO. 26. : Asia Pacific Family Safety Apps Market Revenue, By Platform, 2020 – 2025 (USD Million) 98
TABLE NO. 27. : Asia Pacific Family Safety Apps Market Revenue, By Platform, 2026 – 2033 (USD Million) 98
TABLE NO. 28. : Asia Pacific Family Safety Apps Market Revenue, By Application, 2020 – 2025 (USD Million) 99
TABLE NO. 29. : Asia Pacific Family Safety Apps Market Revenue, By Application, 2026 – 2033 (USD Million) 99
TABLE NO. 30. : Asia Pacific Family Safety Apps Market Revenue, By End-user, 2020 – 2025 (USD Million) 100
TABLE NO. 31. : Asia Pacific Family Safety Apps Market Revenue, By End-user, 2026 – 2033 (USD Million) 100
TABLE NO. 32. : Asia Pacific Family Safety Apps Market Revenue, By Subscription Model, 2020 – 2025 (USD Million) 101
TABLE NO. 33. : Asia Pacific Family Safety Apps Market Revenue, By Subscription Model, 2026 – 2033 (USD Million) 101
TABLE NO. 34. : Latin America Family Safety Apps Market Revenue, By Country, 2020 – 2025 (USD Million) 104
TABLE NO. 35. : Latin America Family Safety Apps Market Revenue, By Country, 2026 – 2033 (USD Million) 104
TABLE NO. 36. : Latin America Family Safety Apps Market Revenue, By Platform, 2020 – 2025 (USD Million) 105
TABLE NO. 37. : Latin America Family Safety Apps Market Revenue, By Platform, 2026 – 2033 (USD Million) 105
TABLE NO. 38. : Latin America Family Safety Apps Market Revenue, By Application, 2020 – 2025 (USD Million) 106
TABLE NO. 39. : Latin America Family Safety Apps Market Revenue, By Application, 2026 – 2033 (USD Million) 106
TABLE NO. 40. : Latin America Family Safety Apps Market Revenue, By End-user, 2020 – 2025 (USD Million) 107
TABLE NO. 41. : Latin America Family Safety Apps Market Revenue, By End-user, 2026 – 2033 (USD Million) 107
TABLE NO. 42. : Latin America Family Safety Apps Market Revenue, By Subscription Model, 2020 – 2025 (USD Million) 108
TABLE NO. 43. : Latin America Family Safety Apps Market Revenue, By Subscription Model, 2026 – 2033 (USD Million) 108
TABLE NO. 44. : Middle East Family Safety Apps Market Revenue, By Country, 2020 – 2025 (USD Million) 111
TABLE NO. 45. : Middle East Family Safety Apps Market Revenue, By Country, 2026 – 2033 (USD Million) 111
TABLE NO. 46. : Middle East Family Safety Apps Market Revenue, By Platform, 2020 – 2025 (USD Million) 112
TABLE NO. 47. : Middle East Family Safety Apps Market Revenue, By Platform, 2026 – 2033 (USD Million) 112
TABLE NO. 48. : Middle East Family Safety Apps Market Revenue, By Application, 2020 – 2025 (USD Million) 113
TABLE NO. 49. : Middle East Family Safety Apps Market Revenue, By Application, 2026 – 2033 (USD Million) 113
TABLE NO. 50. : Middle East Family Safety Apps Market Revenue, By End-user, 2020 – 2025 (USD Million) 114
TABLE NO. 51. : Middle East Family Safety Apps Market Revenue, By End-user, 2026 – 2033 (USD Million) 114
TABLE NO. 52. : Middle East Family Safety Apps Market Revenue, By Subscription Model, 2020 – 2025 (USD Million) 115
TABLE NO. 53. : Middle East Family Safety Apps Market Revenue, By Subscription Model, 2026 – 2033 (USD Million) 115
TABLE NO. 54. : Africa Family Safety Apps Market Revenue, By Country, 2020 – 2025 (USD Million) 118
TABLE NO. 55. : Africa Family Safety Apps Market Revenue, By Country, 2026 – 2033 (USD Million) 118
TABLE NO. 56. : Africa Family Safety Apps Market Revenue, By Platform, 2020 – 2025 (USD Million) 119
TABLE NO. 57. : Africa Family Safety Apps Market Revenue, By Platform, 2026 – 2033 (USD Million) 119
TABLE NO. 58. : Africa Family Safety Apps Market Revenue, By Application, 2020 – 2025 (USD Million) 120
TABLE NO. 59. : Africa Family Safety Apps Market Revenue, By Application, 2026 – 2033 (USD Million) 120
TABLE NO. 60. : Africa Family Safety Apps Market Revenue, By End-user, 2020 – 2025 (USD Million) 121
TABLE NO. 61. : Africa Family Safety Apps Market Revenue, By End-user, 2026 – 2033 (USD Million) 121
TABLE NO. 62. : Africa Family Safety Apps Market Revenue, By Subscription Model, 2020 – 2025 (USD Million) 122
TABLE NO. 63. : Africa Family Safety Apps Market Revenue, By Subscription Model, 2026 – 2033 (USD Million) 122