
Market Overview
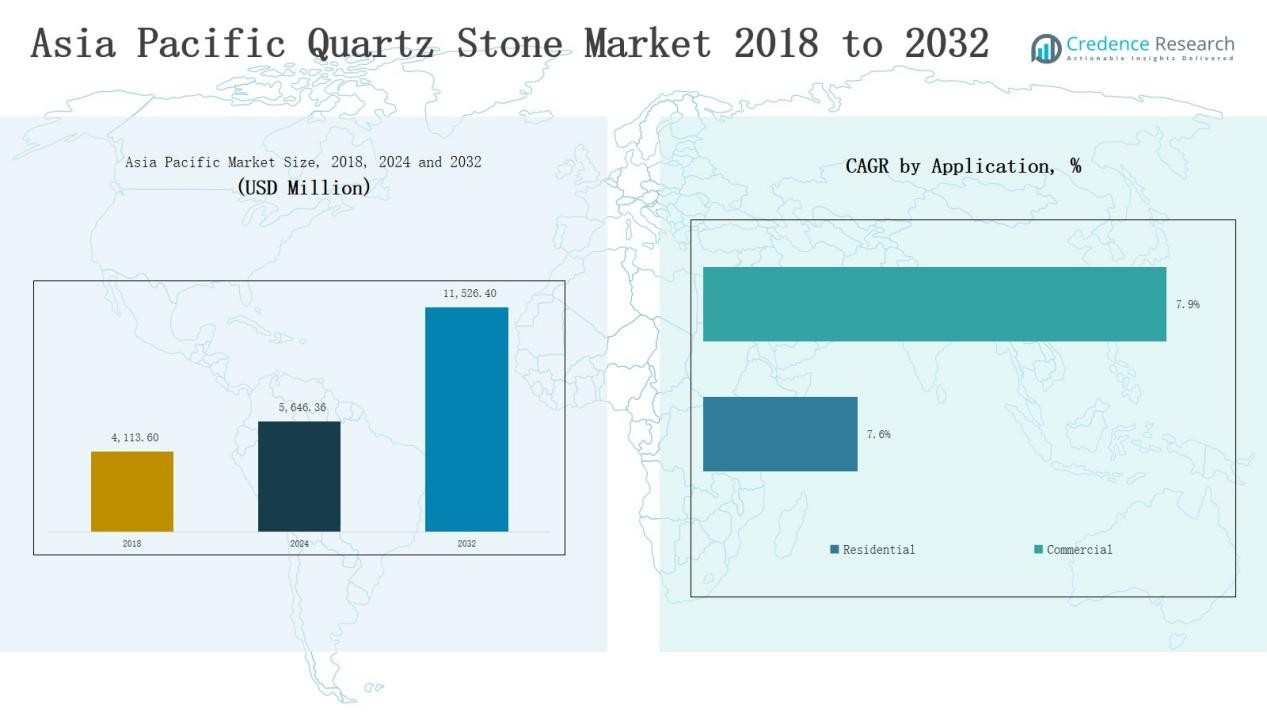
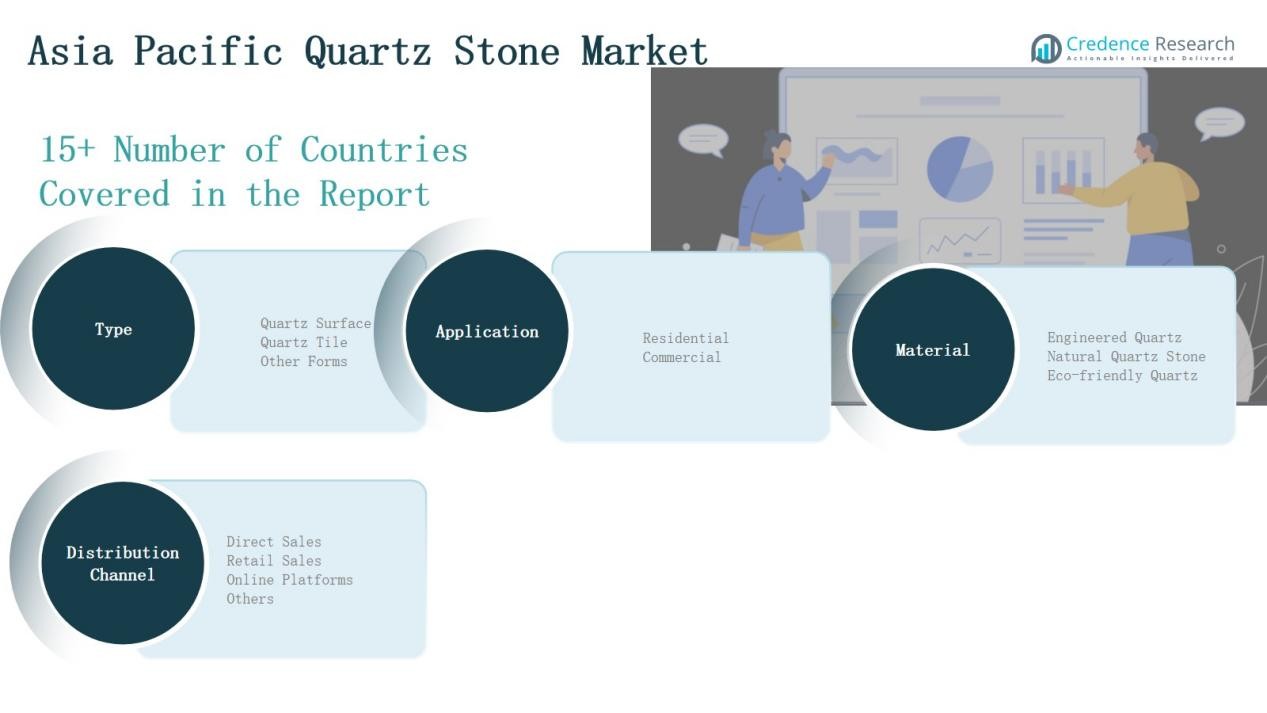
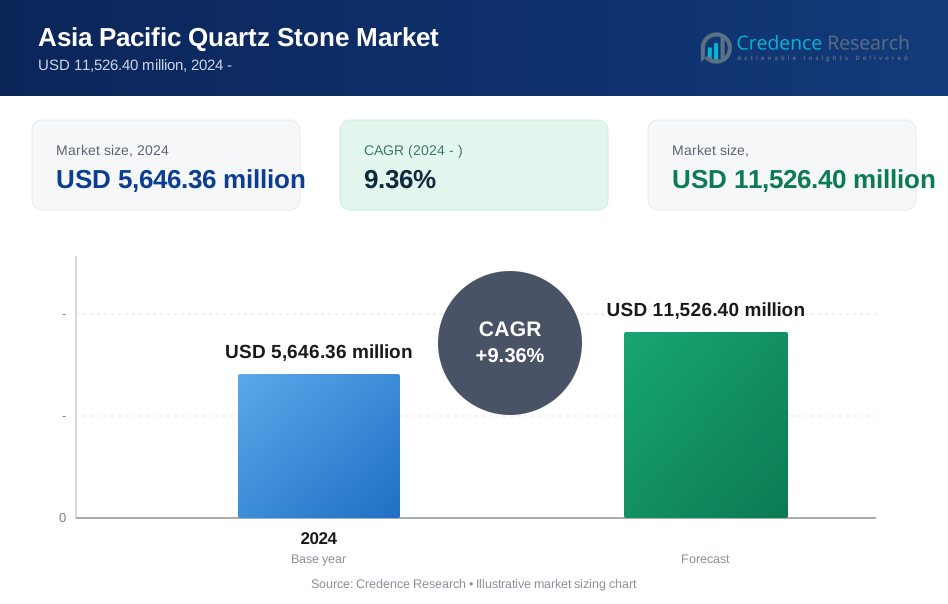
The Asia Pacific Quartz Stone Market was valued at USD 4,113.60 million in 2018, increased to USD 5,646.36 million in 2024, and is projected to reach USD 11,526.40 million by 2032, growing at a CAGR of 9.36% during the forecast period.
| REPORT ATTRIBUTE | DETAILS |
|---|---|
| Historical Period | 2020-2023 |
| Base Year | 2024 |
| Forecast Period | 2025-2032 |
| Asia Pacific Quartz Stone Market Size 2024 | USD 5,646.36 Million |
| Asia Pacific Quartz Stone Market, CAGR | 9.36% |
| Asia Pacific Quartz Stone Market Size 2032 | USD 11,526.40 Million |
The Asia Pacific Quartz Stone Market is dominated by key players such as Sinostone, Bitto Quartz Stone, Pokarna Limited, LG Hausys, Quantra Quartz, Alicante Surfaces, and Bao Phat Vietnam New Material Co. Ltd. These companies lead through advanced manufacturing technologies, extensive product portfolios, and strong regional distribution networks. They focus on engineered quartz production, emphasizing durability, sustainability, and design innovation to meet rising interior and architectural demand. Among all regions, China emerged as the leading market in 2024, holding a 41% share, driven by its robust industrial base, high domestic consumption, and expanding export capacity.
Market Insights
- The Asia Pacific Quartz Stone Market grew from USD 4,113.60 million in 2018 to USD 5,646.36 million in 2024 and is expected to reach USD 11,526.40 million by 2032, expanding at a CAGR of 9.36%.
- China led the market in 2024 with a 41% share, driven by strong manufacturing capacity, abundant raw materials, and rising domestic demand for engineered quartz products.
- The Quartz Surface segment dominated by type with a 58% share in 2024, supported by high use in countertops, flooring, and wall cladding applications across residential and commercial projects.
- The Residential application segment held a 63% share, fueled by urban housing projects, renovation trends, and increasing preference for durable, low-maintenance surfaces.
- Engineered Quartz accounted for 71% of material composition share due to its superior strength, design flexibility, and growing adoption in modular kitchens across China and India.
Market Segment Insights
By Type:
The Quartz Surface segment dominated the Asia Pacific Quartz Stone Market in 2024, accounting for 58% of the total share. Its leadership stems from high demand in kitchen countertops, flooring, and wall cladding. The segment benefits from the material’s durability, non-porous nature, and premium finish. Growing adoption in residential and commercial construction, particularly across China and India, further supports its dominance. Rising design flexibility and improved manufacturing technologies continue to drive segment growth.
- For instance, PACIFIC launched commercial operations at a new Indian quartz manufacturing plant using Breton Stone Technology and advanced automation, setting a production benchmark of 1.1 million square meters annually and supplying super jumbo slabs for residential and commercial projects.
By Application:
The Residential segment held a 63% share of the Asia Pacific Quartz Stone Market in 2024. Demand is driven by rising urban housing projects, premium interior design preferences, and renovation activities. Quartz stones’ stain resistance and longevity make them ideal for kitchen and bathroom installations. Rapid urbanization in emerging economies like China, India, and Vietnam strengthens this segment’s outlook. Increasing consumer spending on home aesthetics and sustainable surfaces boosts residential usage.
- For instance, Johnson Marble & Quartz offers the Cristal quartz series, which includes Cristal Grey and Cristal White. The company has a manufacturing plant in Gujarat, near Rajkot, and supplies its engineered marble and quartz products across India for a range of residential and commercial projects.
By Material Composition:
The Engineered Quartz segment led the Asia Pacific Quartz Stone Market in 2024, representing 71% of the total share. Its dominance arises from superior uniformity, color consistency, and enhanced strength over natural alternatives. Manufacturers favor engineered quartz for its design versatility and resistance to scratches, heat, and chemicals. Rapid growth in modular kitchen adoption and expanding production capacity across China and India sustain this lead. Eco-friendly innovations further increase consumer preference for engineered quartz solutions.
Key Growth Drivers
Expanding Construction and Remodeling Activities
Rising residential and commercial construction across China, India, and Southeast Asia drives quartz stone demand. The region’s focus on infrastructure modernization, luxury housing, and urban redevelopment projects boosts installations of quartz surfaces and tiles. Increasing consumer preference for durable, low-maintenance materials in kitchens and bathrooms further supports market expansion. Rapid urbanization and government-led housing programs enhance consumption of engineered quartz products across major Asia Pacific economies.
- For instance, Sinostone, a Chinese quartz manufacturer, offers engineered quartz products with NSF and GREENGUARD certifications, catering to residential and commercial applications.
Growing Adoption of Engineered Quartz
Engineered quartz leads due to superior strength, uniform texture, and wide design variety. The segment’s non-porous and low-maintenance properties make it ideal for modern interiors. Increased production capabilities in China and India and advancements in resin bonding technologies strengthen its market position. Rising awareness of sustainable and recyclable quartz composites encourages greater adoption across residential and commercial projects. Manufacturers are expanding product lines to meet rising aesthetic and performance standards.
- For instance, Cambria Company LLC released its Inverness Frost design in February 2022, as an addition to its existing Inverness quartz surface line. The company has a longstanding commitment to sustainable manufacturing practices, and this design, like others, reflects that dedication.
Technological Advancements in Manufacturing
Advanced fabrication technologies like CNC machining, automated polishing, and resin infusion improve precision and efficiency. These developments enable consistent surface quality, enhanced customization, and reduced material waste. Automation integration lowers production costs and boosts scalability for large infrastructure projects. Manufacturers also invest in digital design tools and surface treatments that enhance aesthetics and functionality, meeting the diverse preferences of Asia Pacific’s growing middle-class population.
Key Trends & Opportunities
Rising Demand for Sustainable and Eco-friendly Materials
Eco-friendly quartz, incorporating recycled content and low-emission resins, is gaining traction across Asia Pacific. Consumers are increasingly focused on green interiors and sustainable building practices. Governments promoting environmental certifications like LEED further encourage adoption. Manufacturers are developing energy-efficient processes and offering recyclable quartz surfaces, aligning with regional sustainability goals. This trend creates strong opportunities for innovative product lines with minimal ecological impact and longer life cycles.
- For instance, Granite & TREND Transformations and Eco Surfaces Australia also use significant amounts of recycled glass in their engineered stone products, diverting substantial landfill waste while maintaining durability and design versatility.
Increasing Penetration in Emerging Markets
Emerging economies such as Vietnam, Indonesia, and the Philippines are experiencing rapid urbanization and income growth, fueling quartz stone demand. Expanding construction of hotels, offices, and retail spaces increases commercial application potential. Local manufacturing capacity expansion and affordable quartz alternatives enhance accessibility. Market players are focusing on localized distribution networks and tailored designs to capture this demand surge. This expansion offers a significant opportunity for long-term regional growth.
- For instance, HanStone Quartz, a brand of Hyundai L&C, is manufactured in a state-of-the-art facility in London, Ontario, Canada, primarily serving the North American market. The company also has production facilities in South Korea.
Key Challenges
High Manufacturing and Installation Costs
Quartz stone production involves costly raw materials and energy-intensive processes, increasing overall expenses. Transportation and installation also require specialized handling, further raising costs. These factors limit adoption among price-sensitive customers in developing economies. Fluctuating resin and silica prices affect profitability margins. Despite technological advancements, maintaining competitive pricing while ensuring quality remains a key challenge for regional manufacturers.
Environmental and Regulatory Constraints
Quartz manufacturing emits silica dust and other particulates, leading to occupational health and environmental concerns. Stricter environmental regulations across countries like China and Australia demand cleaner production technologies. Compliance with emission standards and waste management adds operational costs. Manufacturers must adopt sustainable practices to meet government norms while maintaining production efficiency. Delays in regulatory adaptation can slow expansion in some regions.
Intense Market Competition and Price Pressure
The Asia Pacific Quartz Stone Market faces stiff competition from regional and international players. Local manufacturers offer low-cost alternatives, creating pricing pressure on established brands. High product similarity limits differentiation, leading to narrow profit margins. Continuous innovation and branding are needed to sustain market presence. Companies must balance quality, design, and affordability to maintain competitiveness in this rapidly evolving market.
Regional Analysis
China
China dominated the Asia Pacific Quartz Stone Market in 2024, holding a 41% share. It benefits from large-scale manufacturing capabilities, abundant raw material availability, and strong domestic demand. Rapid urbanization and government infrastructure programs drive product usage in residential and commercial spaces. The country’s extensive export network further enhances regional growth. Manufacturers such as Sinostone and Bitto Quartz Stone lead innovation and capacity expansion. Rising adoption of engineered quartz for kitchen and bathroom applications supports sustained market growth.
India
India accounted for a 22% share of the regional market in 2024. It experiences robust growth driven by expanding construction, rising disposable income, and growing preference for premium interiors. Increasing investments in housing and commercial projects strengthen local consumption. Key producers like Pokarna Limited and Maestro Surfaces enhance the country’s position in engineered quartz exports. Government initiatives promoting affordable housing and smart city development create strong market opportunities. Domestic processing capacity expansion improves supply reliability and cost competitiveness.
Japan
Japan captured a 10% share in 2024, supported by advanced technological infrastructure and demand for high-quality materials. The market focuses on precision-engineered quartz surfaces tailored for architectural and industrial applications. Strong emphasis on sustainability and energy-efficient buildings drives quartz adoption. Japanese consumers value durability and aesthetics, favoring premium engineered quartz variants. It benefits from the presence of advanced processing technologies and research-based material innovation. Urban redevelopment and renovation projects continue to create steady demand.
South Korea
South Korea represented a 9% share of the regional market in 2024. It shows strong demand for engineered quartz surfaces in modern residential and commercial interiors. Manufacturers such as LG Hausys focus on product diversification and aesthetic enhancements. The country’s innovation-driven manufacturing ecosystem supports quality and sustainability. Expanding export opportunities to neighboring countries also boost production efficiency. Rising renovation activities in urban housing further fuel market expansion.
Australia and Southeast Asia
Australia and Southeast Asia together accounted for a 18% share of the Asia Pacific Quartz Stone Market in 2024. Australia’s strong residential remodeling activities and sustainable material trends promote quartz adoption. Southeast Asia, led by Vietnam, Thailand, and Indonesia, experiences rising demand from rapid urbanization and hospitality projects. Local manufacturing advancements and competitive pricing attract new buyers. It continues to emerge as a key growth hub supported by government-led infrastructure programs and foreign investment inflows.
Market Segmentations:
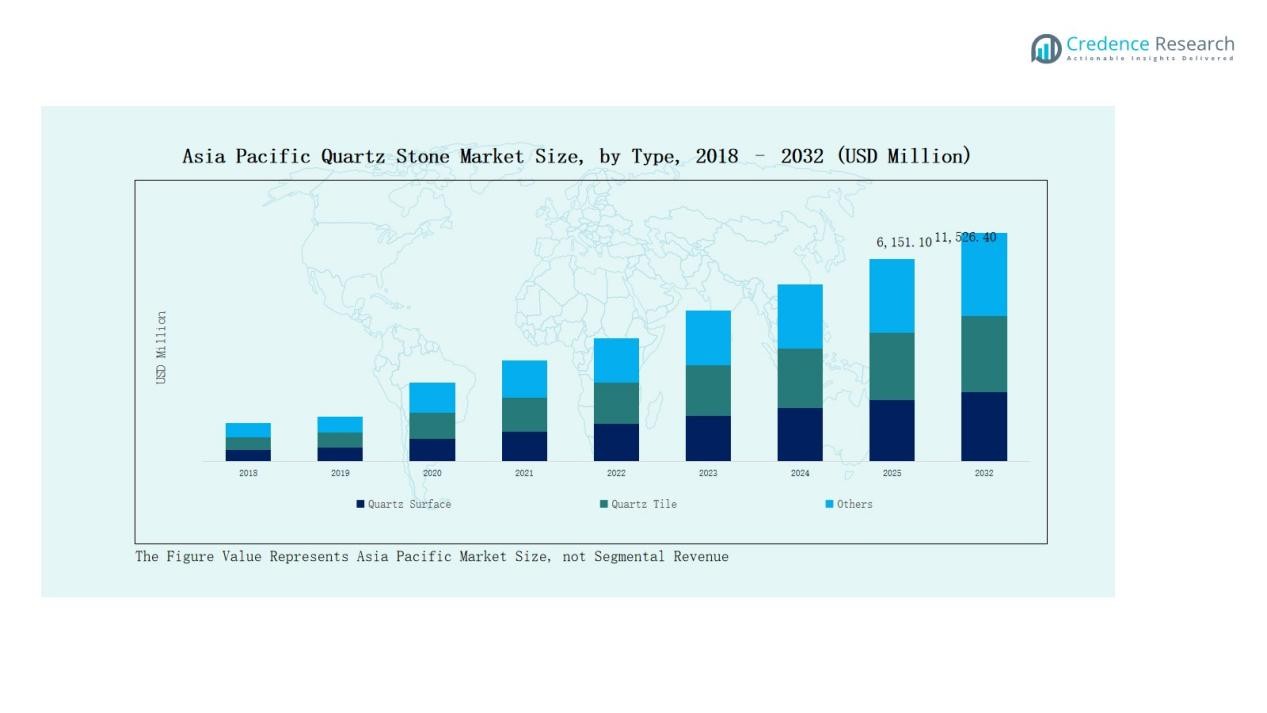
By Type
- Quartz Surface
- Quartz Tile
- Other Forms
By Application
- Residential
- Commercial
By Material Composition
- Engineered Quartz
- Natural Quartz Stone
- Eco-friendly Quartz
By Distribution Channel
- Direct Sales
- Retail Sales
- Online Platforms
- Others
By Region
- China
- Japan
- South Korea
- India
- Australia
- Southeast Asia
- Rest of Asia Pacific
Competitive Landscape
The Asia Pacific Quartz Stone Market features strong competition among regional and global manufacturers focused on innovation, cost efficiency, and design diversity. Leading players such as Sinostone, Bitto Quartz Stone, Pokarna Limited, LG Hausys, and Quantra Quartz dominate through advanced production facilities and extensive distribution networks. Companies emphasize engineered quartz development using precision fabrication and eco-friendly materials to meet evolving consumer preferences. Expanding infrastructure and housing projects in China and India drive capacity upgrades and product differentiation. Strategic initiatives, including partnerships, product launches, and regional expansions, strengthen brand presence and market reach. Mid-tier companies like Alicante Surfaces, UMGG Stone, and Bao Phat Vietnam New Material Co. Ltd. focus on affordability and design customization to capture emerging markets. The competitive landscape remains fragmented, with intense pricing pressure and a growing shift toward sustainable quartz solutions enhancing innovation and long-term market consolidation.
Key Players
- Sinostone
- Bitto Quartz Stone (China)
- Pengxiang Quartz (China)
- UMGG Stone (China)
- Bao Phat Vietnam New Material Co. Ltd. (Vietnam)
- RenShou Industries (China)
- Pokarna Limited (India)
- Alicante Surfaces (India)
- Quantra Quartz (Pokarna Engineered Stone Ltd.) (India)
- LG Hausys (South Korea)
- Lung Shing Quartz Stone (China)
- Maestro Surfaces (India)
Recent Developments
- In December 2024, SCHOTT AG announced the acquisition of QSIL GmbH Quarzschmelze Ilmenau to strengthen its quartz glass and semiconductor materials portfolio. The transaction was completed in January 2025, expanding SCHOTT’s footprint across the Asia Pacific quartz value chain.
- In October 2025, Cosentino introduced its new mineral surface brand Éclos®, developed using Inlayr® technology, which eliminates crystalline silica. The launch highlights the company’s focus on sustainable and advanced quartz alternatives in the Asia Pacific market.
- In 2025, Vicostone launched ten new quartz surface colors in Japan to enhance its product range for residential and commercial interiors. The new collection reflects the company’s strategy to expand its presence and design offerings across Asia Pacific markets.
- In May 2025, Caesarstone launched its ICON line, featuring higher recycled content and enhanced durability for commercial and residential uses.
Report Coverage
The research report offers an in-depth analysis based on Type, Application, Material Composition, Distribution Channel and Region. It details leading market players, providing an overview of their business, product offerings, investments, revenue streams, and key applications. Additionally, the report includes insights into the competitive environment, SWOT analysis, current market trends, as well as the primary drivers and constraints. Furthermore, it discusses various factors that have driven market expansion in recent years. The report also explores market dynamics, regulatory scenarios, and technological advancements that are shaping the industry. It assesses the impact of external factors and global economic changes on market growth. Lastly, it provides strategic recommendations for new entrants and established companies to navigate the complexities of the market.
Future Outlook
- Demand for engineered quartz will rise due to growing residential and commercial construction.
- Manufacturers will focus on expanding production capacity across China and India.
- Eco-friendly and recyclable quartz surfaces will gain higher adoption among consumers.
- Technological advancements in surface finishing will enhance product durability and appeal.
- Increasing renovation and remodeling activities will support sustained market demand.
- Local players will strengthen export potential through improved manufacturing efficiency.
- Smart city and infrastructure projects will drive large-scale quartz installations.
- Rising consumer preference for premium interiors will boost high-end quartz designs.
- Strategic collaborations between suppliers and builders will improve product accessibility.
- Continued investment in sustainable manufacturing will shape long-term regional competitiveness.
Request a Free Sample
Fill in your details and we'll send you a free sample report.
- Sample data tables & charts
- Research methodology
Need a Custom Version of This Report?
Tailor the scope, geography, or segments to your exact requirements.
- Custom geography or segment scope
- Direct access to our analyst team
Frequently Asked Questions
What is the current market size for Asia Pacific Quartz Stone Market, and what is its projected size in 2032?
At what Compound Annual Growth Rate is the Asia Pacific Quartz Stone Market projected to grow between 2025 and 2032?
Which Asia Pacific Quartz Stone Market segment held the largest share in 2024?
What are the primary factors fueling the growth of the Asia Pacific Quartz Stone Market?
Who are the leading companies in the Asia Pacific Quartz Stone Market?
Which region commanded the largest share of the Asia Pacific Quartz Stone Market in 2024?
Table of Content
Chapter 1. Report Introduction
- 1.1 Report Description & Purpose
- 1.1.1 Report Title & Market Definition
- 1.1.2 Unique Selling Propositions (USP) & Key Differentiators
- 1.1.3 Value Proposition for Stakeholders
- 1.2 Research Objectives
- 1.2.1 Market Sizing Objectives (Volume & Revenue)
- 1.2.2 Segmentation Objectives
- 1.2.3 Competitive Intelligence Objectives
- 1.2.4 Forecast & Scenario Objectives
- 1.3 Report Scope
- 1.3.1 Asia Pacific Quartz Stone Scope – Types & Subtypes Covered
- 1.3.2 Geographic Scope – Regions & Countries Covered
- 1.3.3 Historical Period, Base Year & Forecast Period (2024; forecast to the forecast period)
- 1.3.4 Inclusions & Exclusions
- 1.4 HS Code & Classification Framework
- 1.5 Currency, Units & Pricing Basis
- 1.6 Target Stakeholders
- 1.7 Limitations & Assumptions
Chapter 2. Executive Summary
- 2.1 Global Asia Pacific Quartz Stone Market Snapshot
- 2.1.1 Market Size – Historical (2024) & Forecast (the forecast period) (2024: USD 5,646.36 million → forecast year: USD 11,526.40 million)
- 2.1.2 Volume & Revenue – Global Totals
- 2.1.3 Key Market Highlights – Top Five Facts
- 2.2 Asia Pacific Quartz Stone Market Segmentation Snapshot
- 2.2.1 Market Split by Region – 2024 vs.
- 2.3 Competitive Snapshot
- 2.3.1 Top 10 Players by Revenue Share – 2024
- 2.3.2 Top 10 Players by Volume Share – 2024
- 2.3.3 Recent Strategic Developments (18-Month Summary)
- 2.4 Key Investment Highlights & Strategic Conclusions
Chapter 3. Asia Pacific Quartz Stone Market Dynamics & Industry Analysis
- 3.1 Market Overview & Context
- 3.1.1 Asia Pacific Quartz Stone Market Position in the Broader Automotive Value Chain
- 3.1.2 OEM vs. Replacement Market Dynamics
- 3.1.3 Market Maturity & Development Stage by Region
- 3.2 Asia Pacific Quartz Stone Market Drivers
- 3.3 Asia Pacific Quartz Stone Market Restraints & Challenges
- 3.4 Asia Pacific Quartz Stone Market Opportunities
- 3.5 Porter's Five Forces Analysis
- 3.5.1 Threat of New Entrants
- 3.5.2 Bargaining Power of Suppliers
- 3.5.3 Bargaining Power of Buyers
- 3.5.4 Threat of Substitutes
- 3.5.5 Competitive Rivalry – Intensity Assessment
- 3.6 Asia Pacific Quartz Stone Value Chain Analysis
- 3.6.1 Upstream – Raw Material/Input Suppliers
- 3.6.1.1 Raw Material/Input 1
- 3.6.1.2 Raw Material/Input 2
- 3.6.1.3 Raw Material/Input 3
- 3.6.2 Midstream – Production/Manufacturing/Service Delivery
- 3.6.2.1 Production/Process Overview
- 3.6.2.2 Key Facility Locations & Capacity by Manufacturer
- 3.6.3 Downstream – Distribution & End Consumer
- 3.6.3.1 Primary Channel – B2B/OEM
- 3.6.3.2 Secondary Channels – Dealer, Retail, Online, Direct
- 3.6.4 Value Chain Profitability Analysis
- 3.6.1 Upstream – Raw Material/Input Suppliers
- 3.7 PESTEL Analysis
- 3.7.1 Political Factors
- 3.7.2 Economic Factors
- 3.7.3 Social Factors
- 3.7.4 Technological Factors
- 3.7.5 Environmental Factors
- 3.7.6 Legal Factors
- 3.8 Asia Pacific Quartz Stone Supply Chain Analysis
- 3.8.1 Raw Material/Input Supply Risk Assessment
- 3.8.2 Manufacturing Concentration Risk (Geographic Exposure)
- 3.8.3 Trade Disruption Impact Analysis
- 3.9 Regulatory & Policy Landscape
Note: The regulatory and policy landscape section covers regulations based on their applicability to the market, Asia Pacific Quartz Stone category, geography, and scope of the study. Only regulatory frameworks with a material impact on operations, compliance, trade, sustainability, or market access are analyzed in detail.
Chapter 4. Key Investment Pockets & Opportunity Analysis
- 4.1 Asia Pacific Quartz Stone Market Attractiveness Analysis
- 4.1.1 By Region – Investment Attractiveness Matrix (Volume × CAGR)
- 4.2 Absolute Revenue Growth Opportunity
- 4.2.1 By Region – Absolute USD Growth Through the forecast period
- 4.3 Incremental Volume Opportunity
- 4.3.1 By Region – Incremental Volume Through the forecast period
- 4.3.2 Segment – Incremental Volume
- 4.4 Emerging Submarket Opportunity Deep Dive (Subject to Applicability)
- 4.5 Emerging Market Opportunity Scorecards
- 4.5.1 United States
- 4.5.2 Europe
- 4.5.3 Asia
- 4.5.4 Middle East & Africa
Note: Emerging Market Opportunity Scorecards will be included based on relevance and strategic importance. Regions listed are indicative and may vary depending on data availability and market dynamics.
Chapter 5. Asia Pacific Quartz Stone Import-Export Analysis & Trade Flows
- 5.1 Global Trade Overview
- 5.1.1 Global Export Value by Country (2024)
- 5.1.2 Global Export Volume by Country (2024)
- 5.1.3 Global Import Value by Country (2024)
- 5.1.4 Global Import Volume by Country (2024)
- 5.1.5 Net Trade Balance by Country (2024)
- 5.2 Export Analysis – Segment
- 5.2.1 Type 1 (HS Code)
- 5.2.2 Type 2 (HS Code)
- 5.2.3 Type 3 (HS Code)
- 5.2.4 Type 4 (HS Code)
- 5.2.5 Type 5 (HS Code)
- 5.3 Import Analysis – Segment
- 5.3.1 Type 1 (HS Code)
- 5.3.2 Type 2 (HS Code)
- 5.3.3 Type 3 (HS Code)
- 5.3.4 Type 4 (HS Code)
- 5.3.5 Type 5 (HS Code)
- 5.4 Average Unit Trade Prices
- 5.4.1 Average Export Price – Segment & Country
- 5.4.2 Average Import Price – Segment & Source Country
- 5.4.3 Price Trends (2024)
- 5.5 Key Trade Route Analysis
- 5.5.1 Trade Route 1
- 5.5.2 Trade Route 2
- 5.5.3 Trade Route 3
- 5.5.4 Trade Route 4
- 5.5.5 Trade Route 5
- 5.6 Trade Policy Impact Assessment
- 5.6.1 US Anti-Dumping & Section 301 Tariffs
- 5.6.2 EU Customs Union Impact
- 5.6.3 Major Free Trade Agreements
- 5.6.4 USMCA Rules of Origin
Note: Trade policy analysis will be included only where relevant to the Asia Pacific Quartz Stone market.
Chapter 6. Competitive Landscape & Company Benchmarking
- 6.1 Asia Pacific Quartz Stone Market Concentration & Structure
- 6.1.1 Herfindahl-Hirschman Index (HHI) – vs. 2024
- 6.1.2 Tier 1, Tier 2 & Tier 3 Market Structure
- 6.1.3 Global, Regional & Local Player Dynamics
- 6.2 Asia Pacific Quartz Stone Market Share Analysis – 2024
- 6.2.1 Global Revenue Share by Company
- 6.2.2 Global Volume Share by Company
- 6.2.3 Regional Revenue Share
- 6.2.4 Market Share Evolution ( vs. 2024)
- 6.2.5 OEM Segment Share by Company
- 6.2.6 Replacement Segment Share by Company
- 6.3 Production/Delivery Capacity & Facility Analysis
- 6.3.1 Global Installed Capacity
- 6.3.2 Capacity Utilization Rates
- 6.3.3 Production/Output Volume
- 6.3.4 Facility Locations & Capacity Map
- 6.3.5 Planned Capacity Additions
- 6.4 Asia Pacific Quartz Stone Competitive Benchmarking Matrix
- 6.4.1 Revenue, Volume, CAGR & Profitability Comparison
- 6.4.2 Channel Revenue Mix
- 6.4.3 Geographic Revenue Exposure
- 6.4.4 R&D Intensity
- 6.4.5 Sustainability Maturity
- 6.5 Strategic Developments in Asia Pacific Quartz Stone (Last 24 Months)
- 6.5.1 Mergers, Acquisitions & Divestments
- 6.5.2 New Asia Pacific Quartz Stone Launches
- 6.5.3 Facility Expansions
- 6.5.4 Strategic Alliances, Joint Ventures & Partnerships
- 6.5.5 Distribution Expansion & Market Entry
- 6.5.6 Sustainability & ESG Initiatives
- 6.6 Competitive Strategy Mapping
- 6.6.1 Leader, Challenger, Follower & Niche Classification
- 6.6.2 Pricing Strategy Comparison
- 6.6.3 Channel Strategy Matrix
Note: Strategic developments are included based on their materiality and the availability of reliable information.
Chapter 7. Global Asia Pacific Quartz Stone Market – By Distribution Channel
- 7.1 Segment Overview
- 7.1.1 Volume & Revenue Split by Channel (2024 & )
- 7.1.2 Channel Mix Evolution (the forecast period)
Chapter 8. Regional Market Analysis – Global Overview
- 8.1 Global Regional Overview
- 8.1.1 Regional Volume Share
- 8.1.2 Regional Revenue Share
- 8.1.3 Regional Volume by Region
- 8.1.4 Regional Revenue by Region
- 8.1.5 Regional Forecast Through the forecast period
- 8.2 Cross-Regional Segment Analysis
- 8.2.1 By Distribution Channel
- 8.2.2 By Brand/Price Tier
Chapter 9. North America Asia Pacific Quartz Stone Market
- 9.1 United States
- 9.2 Canada
- 9.3 Mexico
Chapter 10. Europe Asia Pacific Quartz Stone Market
- 10.1 Germany
- 10.2 France
- 10.3 Italy
- 10.4 United Kingdom
- 10.5 Spain
- 10.6 Poland
- 10.7 Russia
- 10.8 Netherlands
- 10.9 Belgium
- 10.10 Sweden
- 10.11 Denmark
- 10.12 Norway
- 10.13 Rest of Europe
Chapter 11. Asia Pacific Asia Pacific Quartz Stone Market
- 11.1 China
- 11.2 India
- 11.3 Japan
- 11.4 South Korea
- 11.5 Thailand
- 11.6 Indonesia
- 11.7 Vietnam
- 11.8 Malaysia
- 11.9 Australia
- 11.10 Rest of Asia Pacific
Chapter 12. Latin America Asia Pacific Quartz Stone Market
- 12.1 Brazil
- 12.2 Argentina
- 12.3 Colombia
- 12.4 Chile
- 12.5 Rest of Latin America
Chapter 13. Middle East Asia Pacific Quartz Stone Market
- 13.1 Saudi Arabia
- 13.2 United Arab Emirates
- 13.3 Turkey
- 13.4 Israel
- 13.5 Iran
- 13.6 Rest of the Middle East
Chapter 14. Africa Asia Pacific Quartz Stone Market
- 14.1 South Africa
- 14.2 Egypt
- 14.3 Nigeria
- 14.4 Morocco
- 14.5 Rest of Africa
Chapter 15. Asia Pacific Quartz Stone Company Profiles
- 15.1 [Company 01]
- 15.1.1 Company Overview
- 15.1.2 Key Management Personnel
- 15.1.3 Products & Services Portfolio
- 15.1.4 Financial Performance
- 15.1.5 Key Market Focus & Geographic Presence
- 15.1.6 Recent Developments & Strategic Initiatives
Note: The company profile list is preliminary and may change based on research findings, market developments, data availability, and client requirements.
Chapter 16. Appendices
- Appendix A – List of Abbreviations & Acronyms
- Appendix B – Industry Classification Code Reference – Full Series
- Appendix C – Production & Capacity Data Tables
- Appendix D – End-Use & Demand Base Tables
- Appendix E – Consumption & Replacement Rate Assumptions
- Appendix F – ASP Reference Tables
- Appendix G – Manufacturing & Facility Database
- Appendix H – Import-Export Data Tables
- Appendix I – Regulatory Summary Tables
- Appendix J – Primary Research Participant List (Anonymized)
- Appendix K – Primary Research Questionnaire Framework
- Appendix L – Data Sources & Bibliography
- Appendix M – Market Size Divergence & Source Comparison
Chapter 17. Research Methodology
- 17.1 Research Framework & Philosophy
- 17.2 Secondary Research – Sources, Hierarchy & Data Extraction
- 17.3 Data Modeling – Bottom-Up & Top-Down Market Sizing
- 17.4 Primary Research – Stakeholder Framework, LOI & Sample Sizes
- 17.5 Forecast Methodology – Regression, Scenario & Sensitivity Analysis
- 17.6 Quality Control – Four-Layer Validation Framework
- 17.7 Limitations & Standard Assumptions
- 17.8 Disclaimer
